
25 December, 2023
This week we look at the drivers of the continued slump in the lithium price, which is facing pressure on the demand side from a slowing rate of global electric vehicle sales and on the supply side as new lithium chemical capacity came online this year.
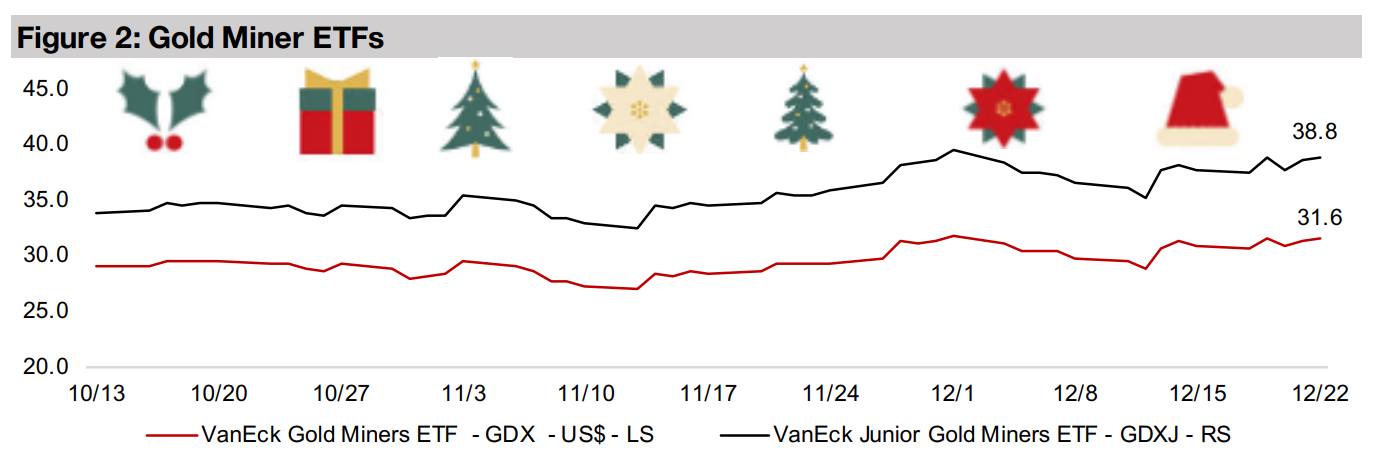
Gold stocks gained as the metal and equity markets picked up, with the GDX up 2.0%, outpacing a 0.6% rise in the S&P 500, and the GDXJ jumping 3.4%, ahead of a 2.1% rise in the Russell 2000, and the TSXV larger cap gold stocks mostly increased.


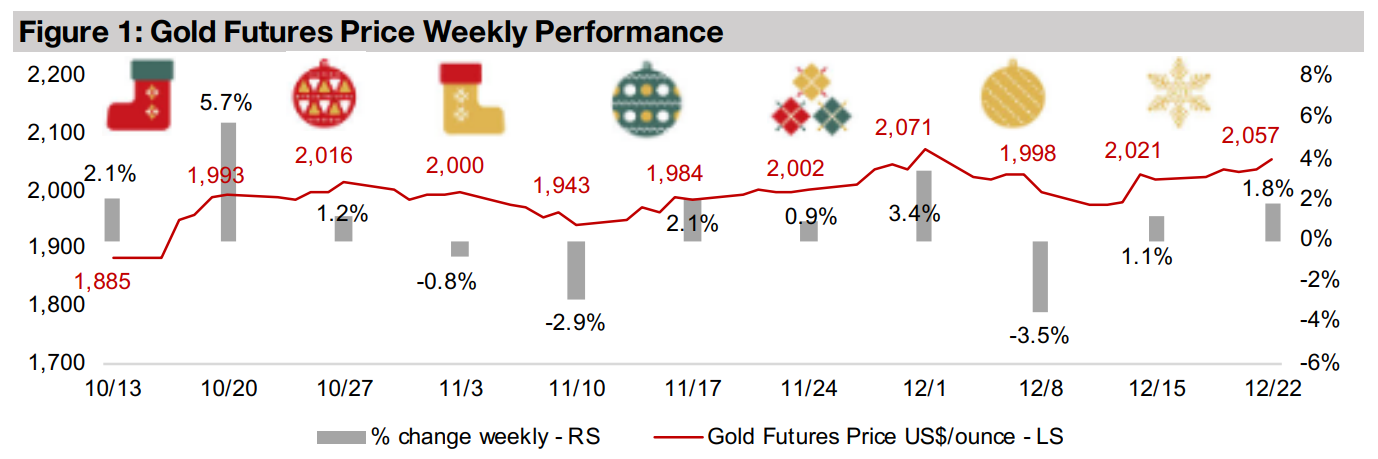
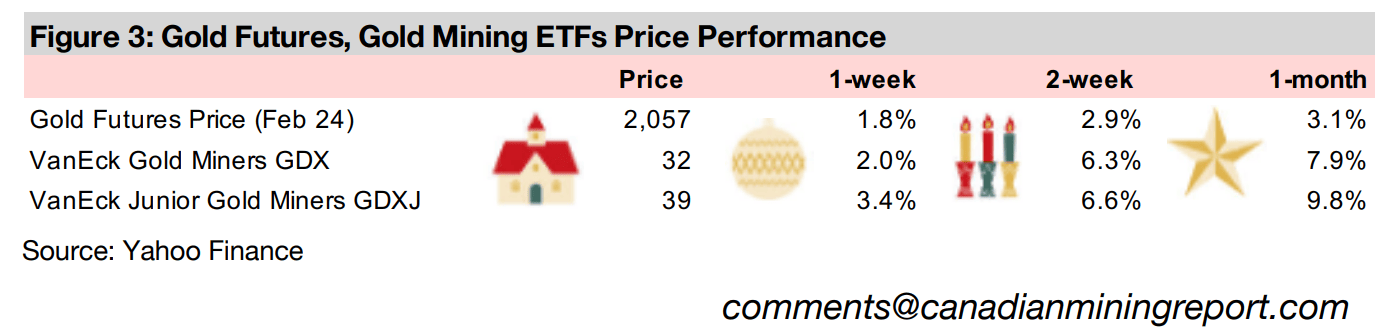
The gold futures price rose 1.8% to US$2,057/oz and has remained over
US$2,000/oz for seventeen out of the last twenty-one trading days, by far its longest
stretch above this key level. The price continues to be supported by a combination
of high geopolitical and economic risks, as well a range of fundamental factors
moving in its favour. The moderate boost to the price this week was mainly from the
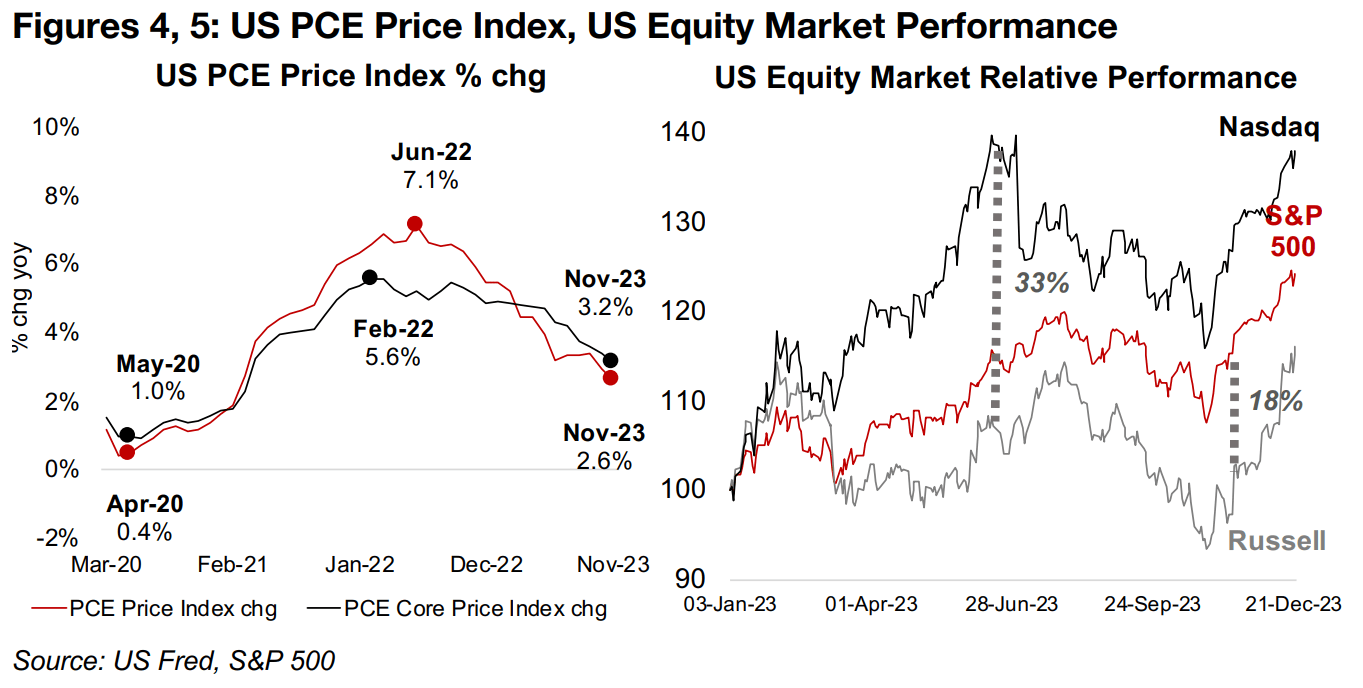
release of the US Personal Consumption Expenditure (PCE) Price Index data, which
came in weaker than expected. The headline PCE Price Index fell to just 2.6% in
November 2023, down from a peak 7.1% in June 2022, while the Core Index dropped
to 3.2%, off a peak of 5.6% in February 2022 (Figure 4). These trends are inline with
recent US CPI inflation data, further confirming a cooling of prices over the past year.
This was viewed positively by the market, as the PCE Price Index is a key inflation
measure watched by the US Fed and gave more support for rate cuts which are
widely expected to start next year, as early as March. However, some Fed officials
have pushed back on these market targets recently, indicating that first quarter could
be too early for rate cuts. The combination of these factors led to only a moderate
rise in the major US equity markets, with the S&P up 0.61% and Nasdaq gaining
1.21%, although there was a strong 2.1% gain in the Russell 2000 small cap index.
This has been part of an ongoing rotation in recent months more towards small caps
in a range of sectors versus the focus on large cap tech that dominated the earlier
part of 2023. The Nasdaq performance had been ahead of the Russell 2000 by as
much as 33% in June 2023, but this has contracted to just 22% (Figure 5). The S&P
500’s biggest spread with the Russell 2000 was in November at 18%, but this is now
down to just 8%. A continuation of this move could support the junior mining stocks.
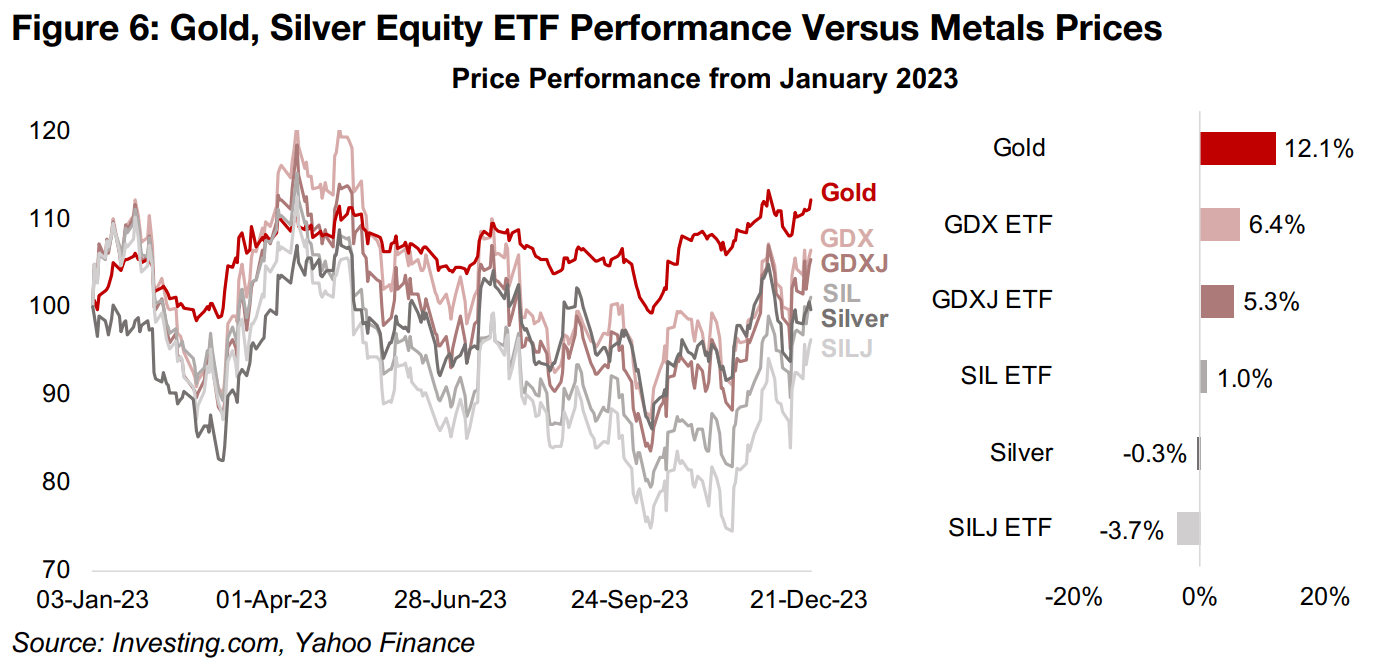
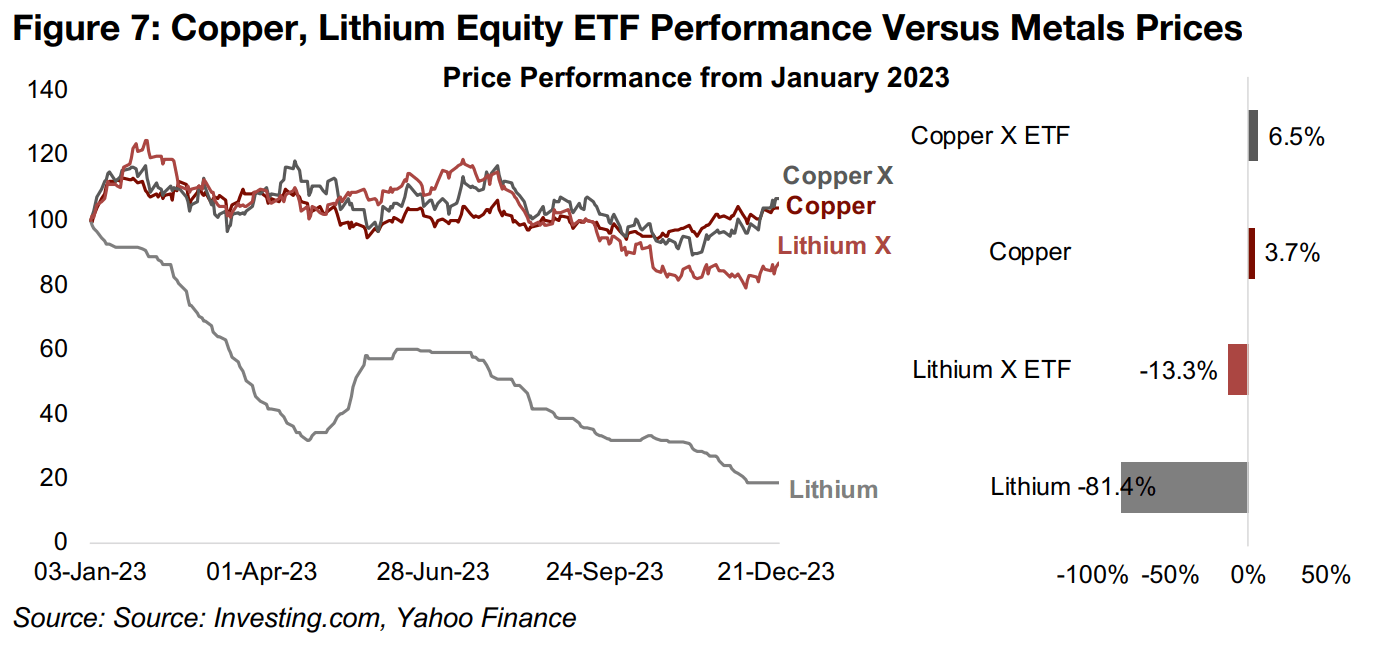
The continued rebound in several major metals and rising interest in non-big-tech equities have seen a substantial pickup in the gold, silver and copper stock ETFs over the past two months. The GDX ETF of producing gold stocks is up 6.4% year to date and GDXJ ETF of junior gold stocks up 5.3%, about 6.0% below gold’s 12.1% rise (Figure 6). This has closed most of what had been a 30% gap below the gold price performance around September and October 2023 for these ETFs. Silver stock ETFs have also regained ground, with the SIL ETF of producers, down -0.3% year to date, just behind a 1.0% rise in silver and trailed by the SILJ ETF of juniors, down -3.7%. The COPX ETF of copper producers, up 6.5%, is actually outpacing the 3.7% gain in the metal, and while LIT, the lithium and battery metals ETF is down -13.3%, it has far outperformed the -81.4% plunge in the lithium price (Figure 7).
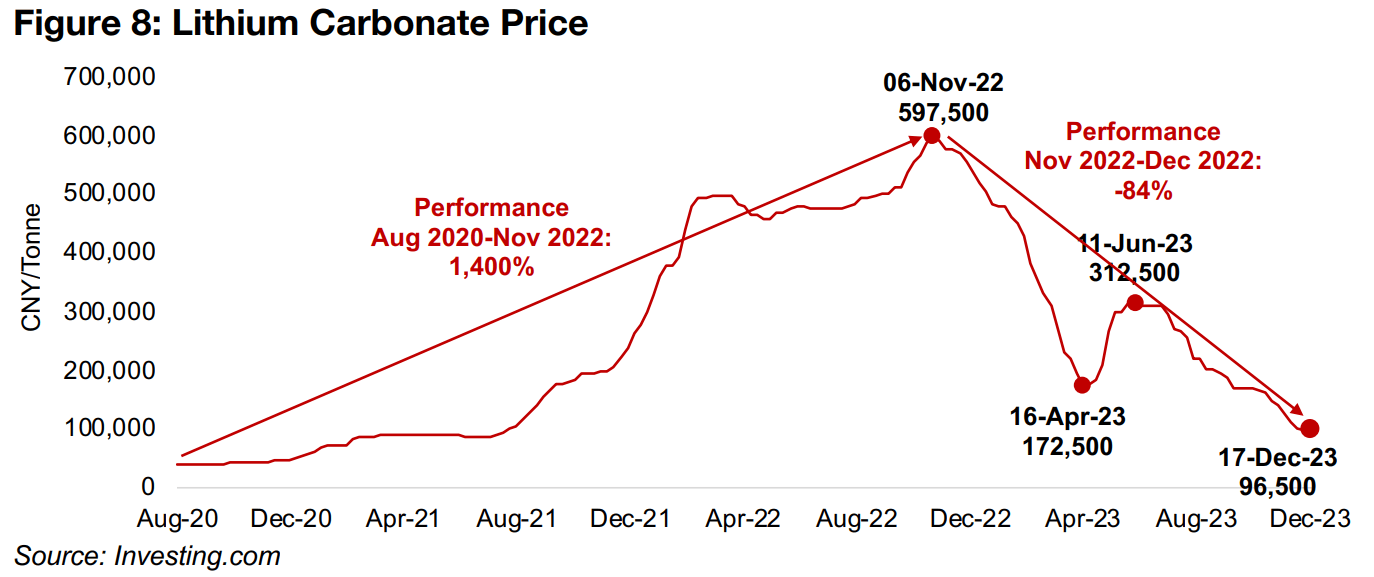
In contrast to the huge gold, copper and silver market, the lithium market is relatively small, and tends to be less driven by broad macro factors like these other major metals, and more by industry specific shifts. The lithium carbonate price tumbled from a high of CNY597,500/tonne in November 2022 to CNY172,500/tonne as of April 2023, rebounded briefly to CNY312,500/tonne by June 2023, and has dropped back to new lows of CNY95,600/tonne in December 2023 (Figure 8). Issues on both sides of the market have been moving against the lithium price over the past year, with electric vehicle sales the key demand factor and lithium chemical production from China the key supply driver, with the country at nearly 80% of global output.
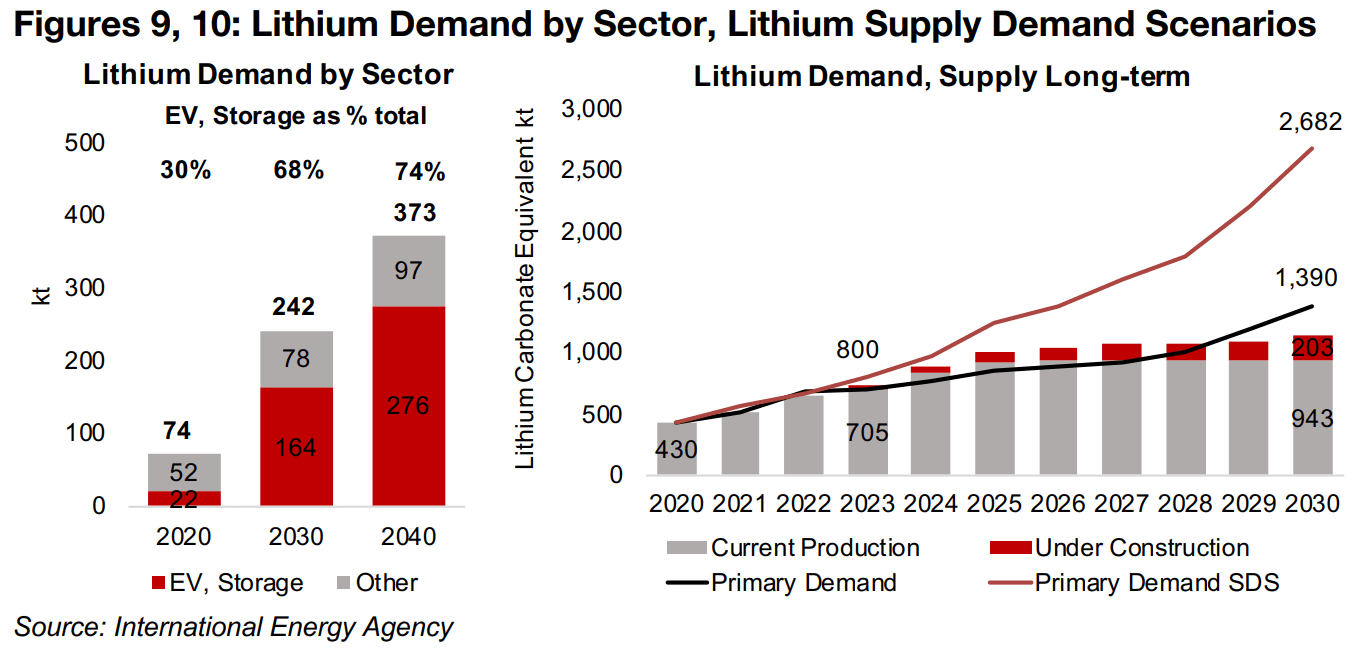
On lithium’s demand side, electric vehicles (EV) have increasingly become the main
driver of consumption in recent years and are forecast to rise from 30% of the total
in 2020 to 68% in 2030 and 74% by 2040 (Figure 9). Forecasts from the International
Energy Agency (IEA) project that this EV growth will push lithium demand ahead of
supply, including capacity under construction, by 2029, in a base case scenario.
However, under a Sustainable Development Scenario (SDS), the demand for lithium
will be far higher, and a major deficit could erupt as early as 2025.
Note that the IEA forecasts are now over a year old, and so more recent estimates
for the lithium supply and demand balance shown below from Australia’s Office of
the Chief Economist (AOCE) are probably more accurate for 2023E and 2024E.
However, as the AOCE reports only short-term forecasts, the IEA data is useful as a
long-term indicator. One issue to consider is that if the Sustainable Development
Scenarios for demand are not realized and projects currently under construction are
completed, the lithium market could actually remain in surplus for another five years,
which would not indicate strong upward pressure on the metal’s price (Figure 10).
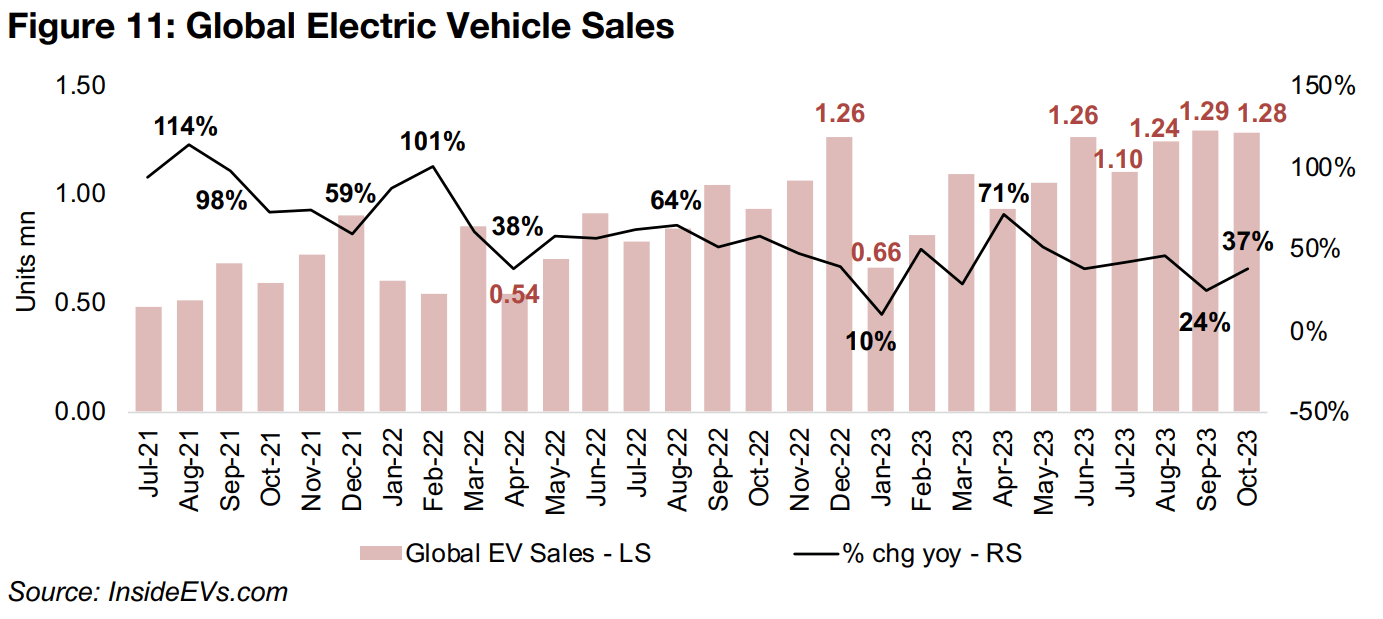
This rise in lithium demand for batteries in electric vehicles means that tracking global
unit sales of EVs will be critical in forecasting the price of the metal. Recent EV growth
numbers year on year hardly indicate a weak market in absolute terms, with a 37%
rise yoy in October 2023 to 1.28 mn units, just off an all-time peak of 1.29 mn units
in September 2023, when yoy growth was 24% (Figure 11). However, this strong
expansion is still far down from the explosive growth rates in previous years, with
highs of 114% yoy in August 2021 and 101% in February 2022.
The first major signs that the boom in EV sales was easing came in April 2022, when
the growth rate fell to a low for the year of 38%. While there was a moderate pickup
in growth to as high as 64% in August 2022, the rate of expansion fell further through
2022 and hit its low of the past three years at 10% in January 2023. One of the main
drivers for this plunge was the removal of subsidies for electric vehicles on January
1, 2023, by China, which is the largest market for the industry, accounting for 58% of
total global unit sales over the first ten months of 2023.
Even without the subsidies, however, EV sales growth resurged in the first half of
2023, reaching as high as 71% in April 2023, although a combination of high global
inflation and interest rates started to put downward pressure on demand. The growth
rate has trended down since, and the 24% rise in September 2023 is actually the
second weakest expansion for EV sales in recent years. China has offered some more
support for the industry by extending tax waivers for electric vehicles, originally to
end in 2023, to 2025, and for 2025-2027 EV taxes will be at half the regular levels
before full rates return in 2028. However, upside from these measures could be offset
from a demand decline if a global recession occurs.
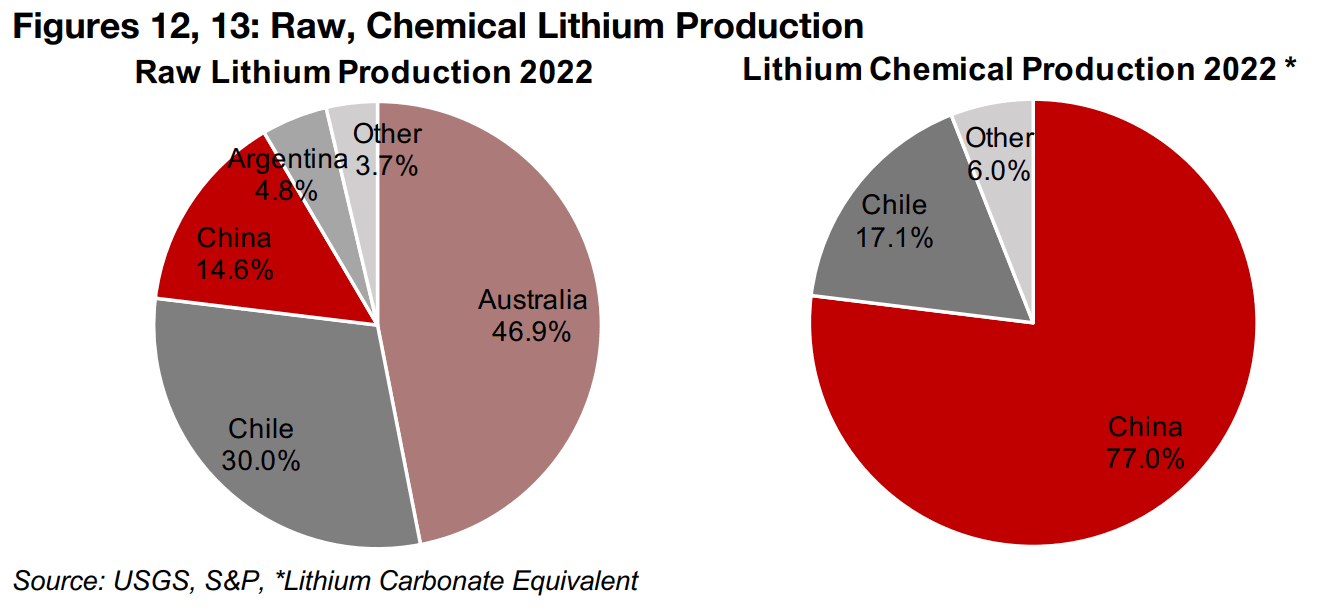
On the supply side, a big hit to the lithium price has come from a major increase in the supply of lithium chemicals from China, with the country finally starting to catch up with surging demand. China is actually a smaller producer of raw lithium, at just 13.3% of the total 2022, with Australia the market leader, at 46.9%, mostly hard rock spudomene, and Chile second, at 30.0%, mainly brine (Figure 12). However, the lithium chemical market is dominated by China, with over 77.0% of the total output in 2022, with Chile second, at 17.1% of the total (Figure 13).
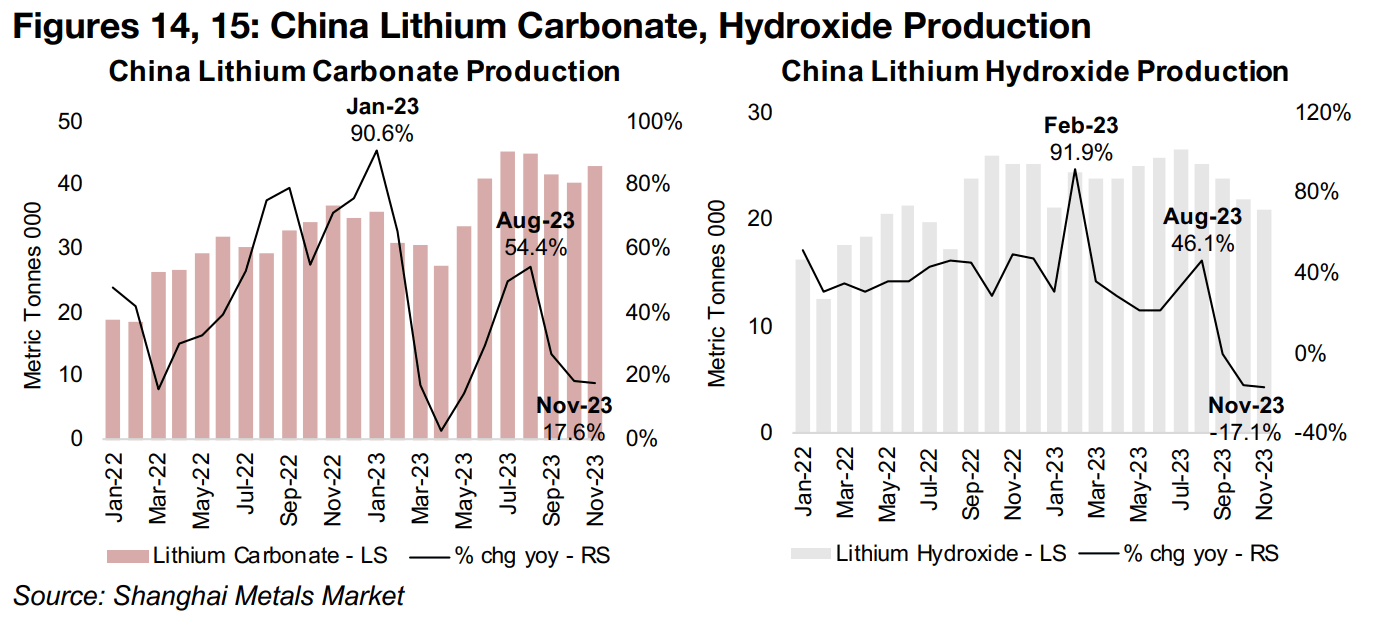
China’s output of carbonate jumped from 27k tonnes in April 2023 to 45k tonnes July 2023, with the growth rate peaking at 54.4% yoy in August 2023 and still at reasonably high 17.6% as of November 2023 (Figure 14). Lithium hydroxide output from the country has also been strong overall this year, rising from 21k tonnes in January 2023 to a peak 27k tonnes in July 2023, although growth has turned negative over the past two months, with a -17.1% contraction in November 2023 (Figure 15).
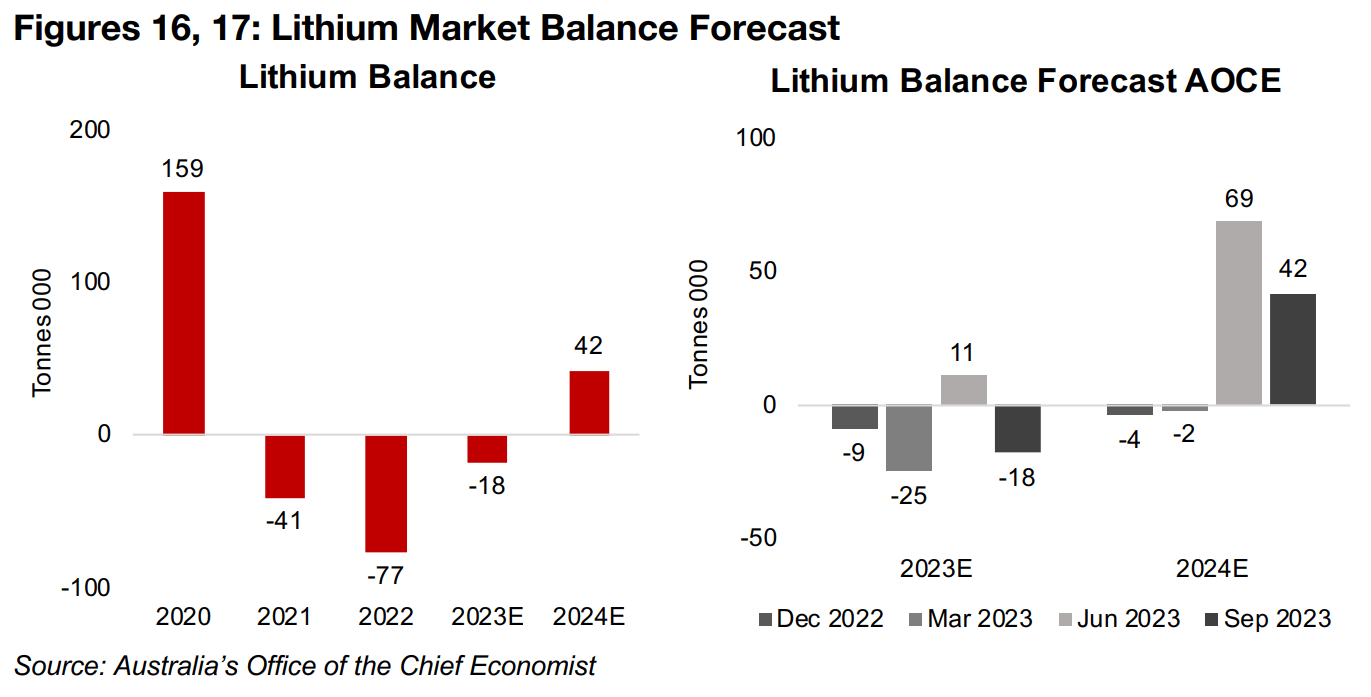
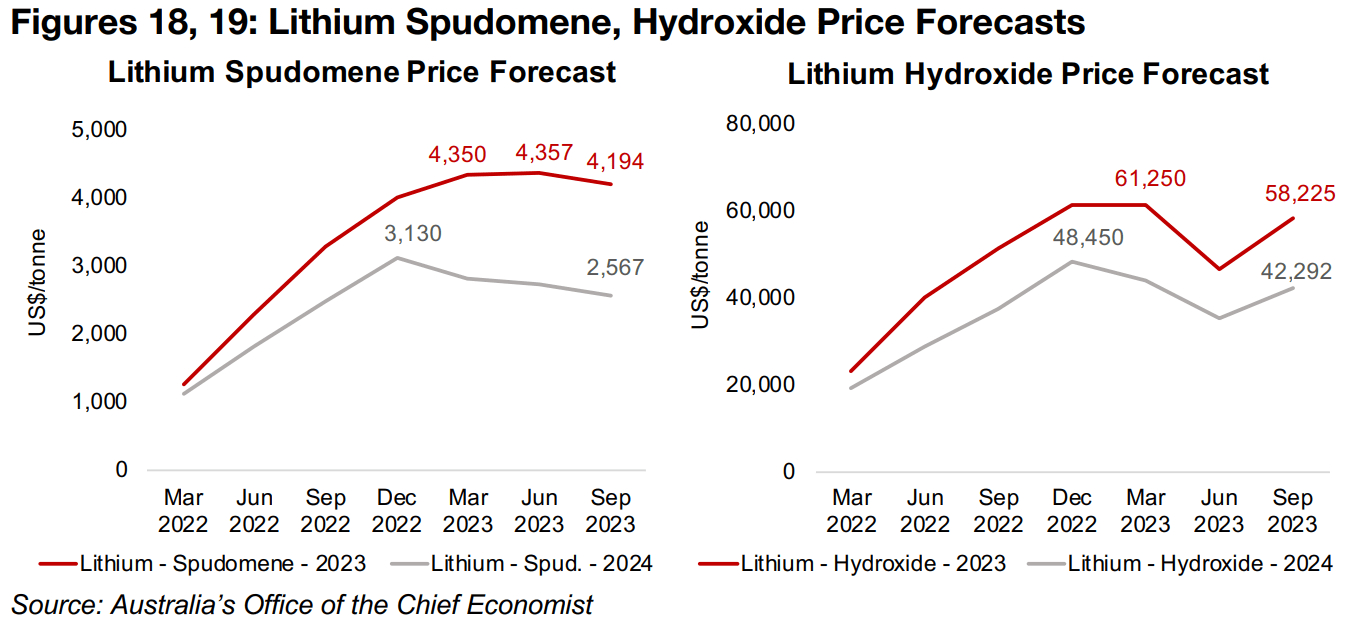
Australia’s Office of the Chief Economist (AOCE) forecasts that the lithium market will have its third consecutive year of deficit in 2023E, at -18k tonnes of lithium carbonate equivalent, but move into a surplus of 42k tonnes in 2024E (Figure 16). This is a shift from this time last year when the AOCE forecasted a nearly balanced market, an estimate that carried over to March 2023, before a major revision in June 2023 (Figure 17). The AOCE has also downgraded its 2023E forecasts for raw lithium spudomene prices for the past two quarters, and its 2024E forecasts for the past three quarters (Figure 18). While lithium hydroxide price estimates for both 2023E and 2024E were revised up in the September 2023 report after a substantial reduction June 2023, current forecasts are still below March 2023 levels (Figure 19).
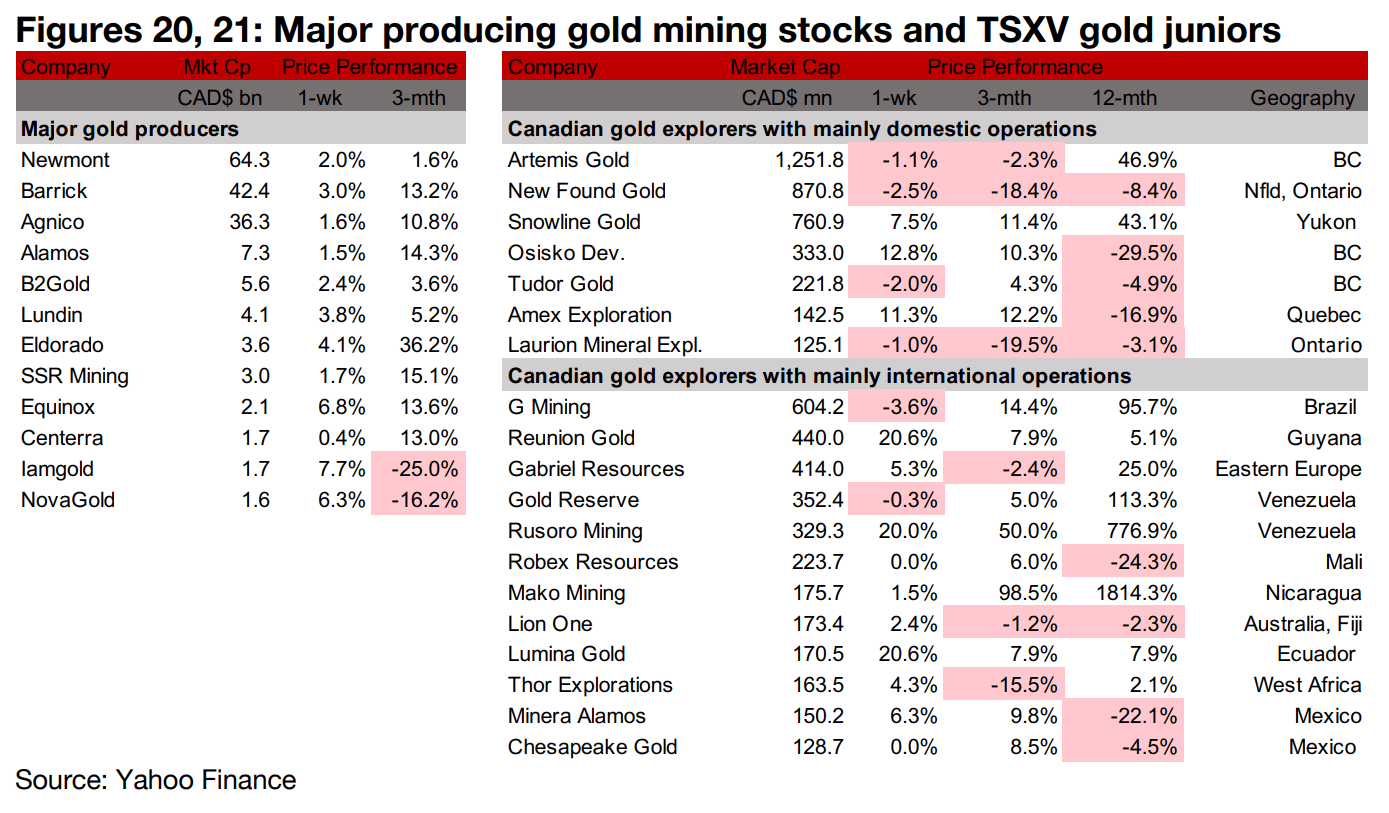
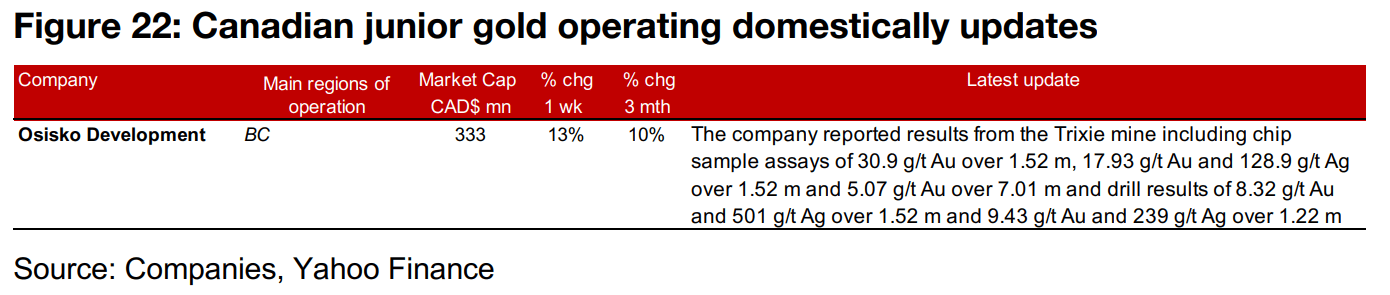
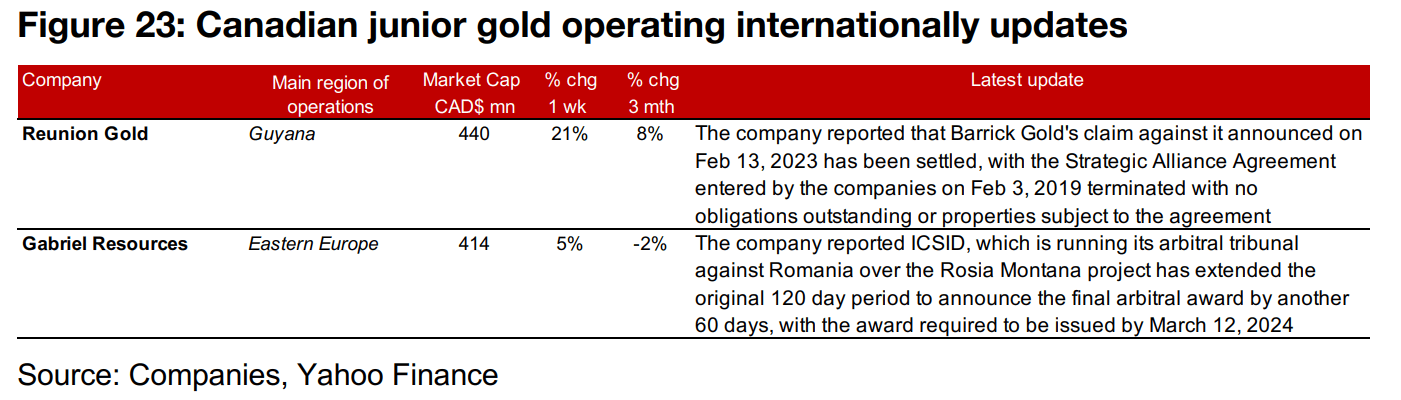
All of the major gold producers and most of the larger TSXV gold stocks rose on the gain in the metal and equity markets (Figures 20, 21). For the TSXV gold companies operating domestically, Osisko Development reported chip sample and drilling results from the Trixie mine (Figure 22). For the TSXV gold companies operating internationally, Reunion Gold announced that Barrick Gold’s claim against it had been settled and Gabriel Resources reported that ICSID had extended the period to make its final award decision on the company’s arbitration case in Romania over the Rosia Montana project by sixty days (Figure 23).
Disclaimer: This report is for informational use only and should not be used an alternative to the financial and legal advice of a qualified professional in business planning and investment. We do not represent that forecasts in this report will lead to a specific outcome or result, and are not liable in the event of any business action taken in whole or in part as a result of the contents of this report.
Author
Ben McGregor authors the Weekly Roundup at CanadianMiningReport.com, providing sharp analysis of the metals and mining sector. With a talent for spotting trends, Ben distills complex market shifts into clear, engaging insights on TSXV junior miners. His weekly updates cover gold, copper, uranium, and more, blending data-driven perspectives with a knack for identifying opportunities. A vital resource for investors, Ben’s work navigates the dynamic junior mining landscape with precision.