The precious metals all soared in 2025, and while a continued monetary expansion and geopolitical risk could still drive gains especially for gold in 2026, a pullback in silver, platinum and palladium is possible after recent partly speculative surges.
After decent gains in 2025, the outlook for base metals is opaque on an unclear macroeconomic situation, with an inflationary expansion, stagflation or deflationary downturn all possible, indicating quite different outcomes for prices in the sector.
The metals stocks are no longer clearly inexpensive, as they were in 2024 and early 2025, with sector multiples for silver quite elevated, for gold somewhat high, and for base and other metals at moderate levels, which could put some pressure on gains.


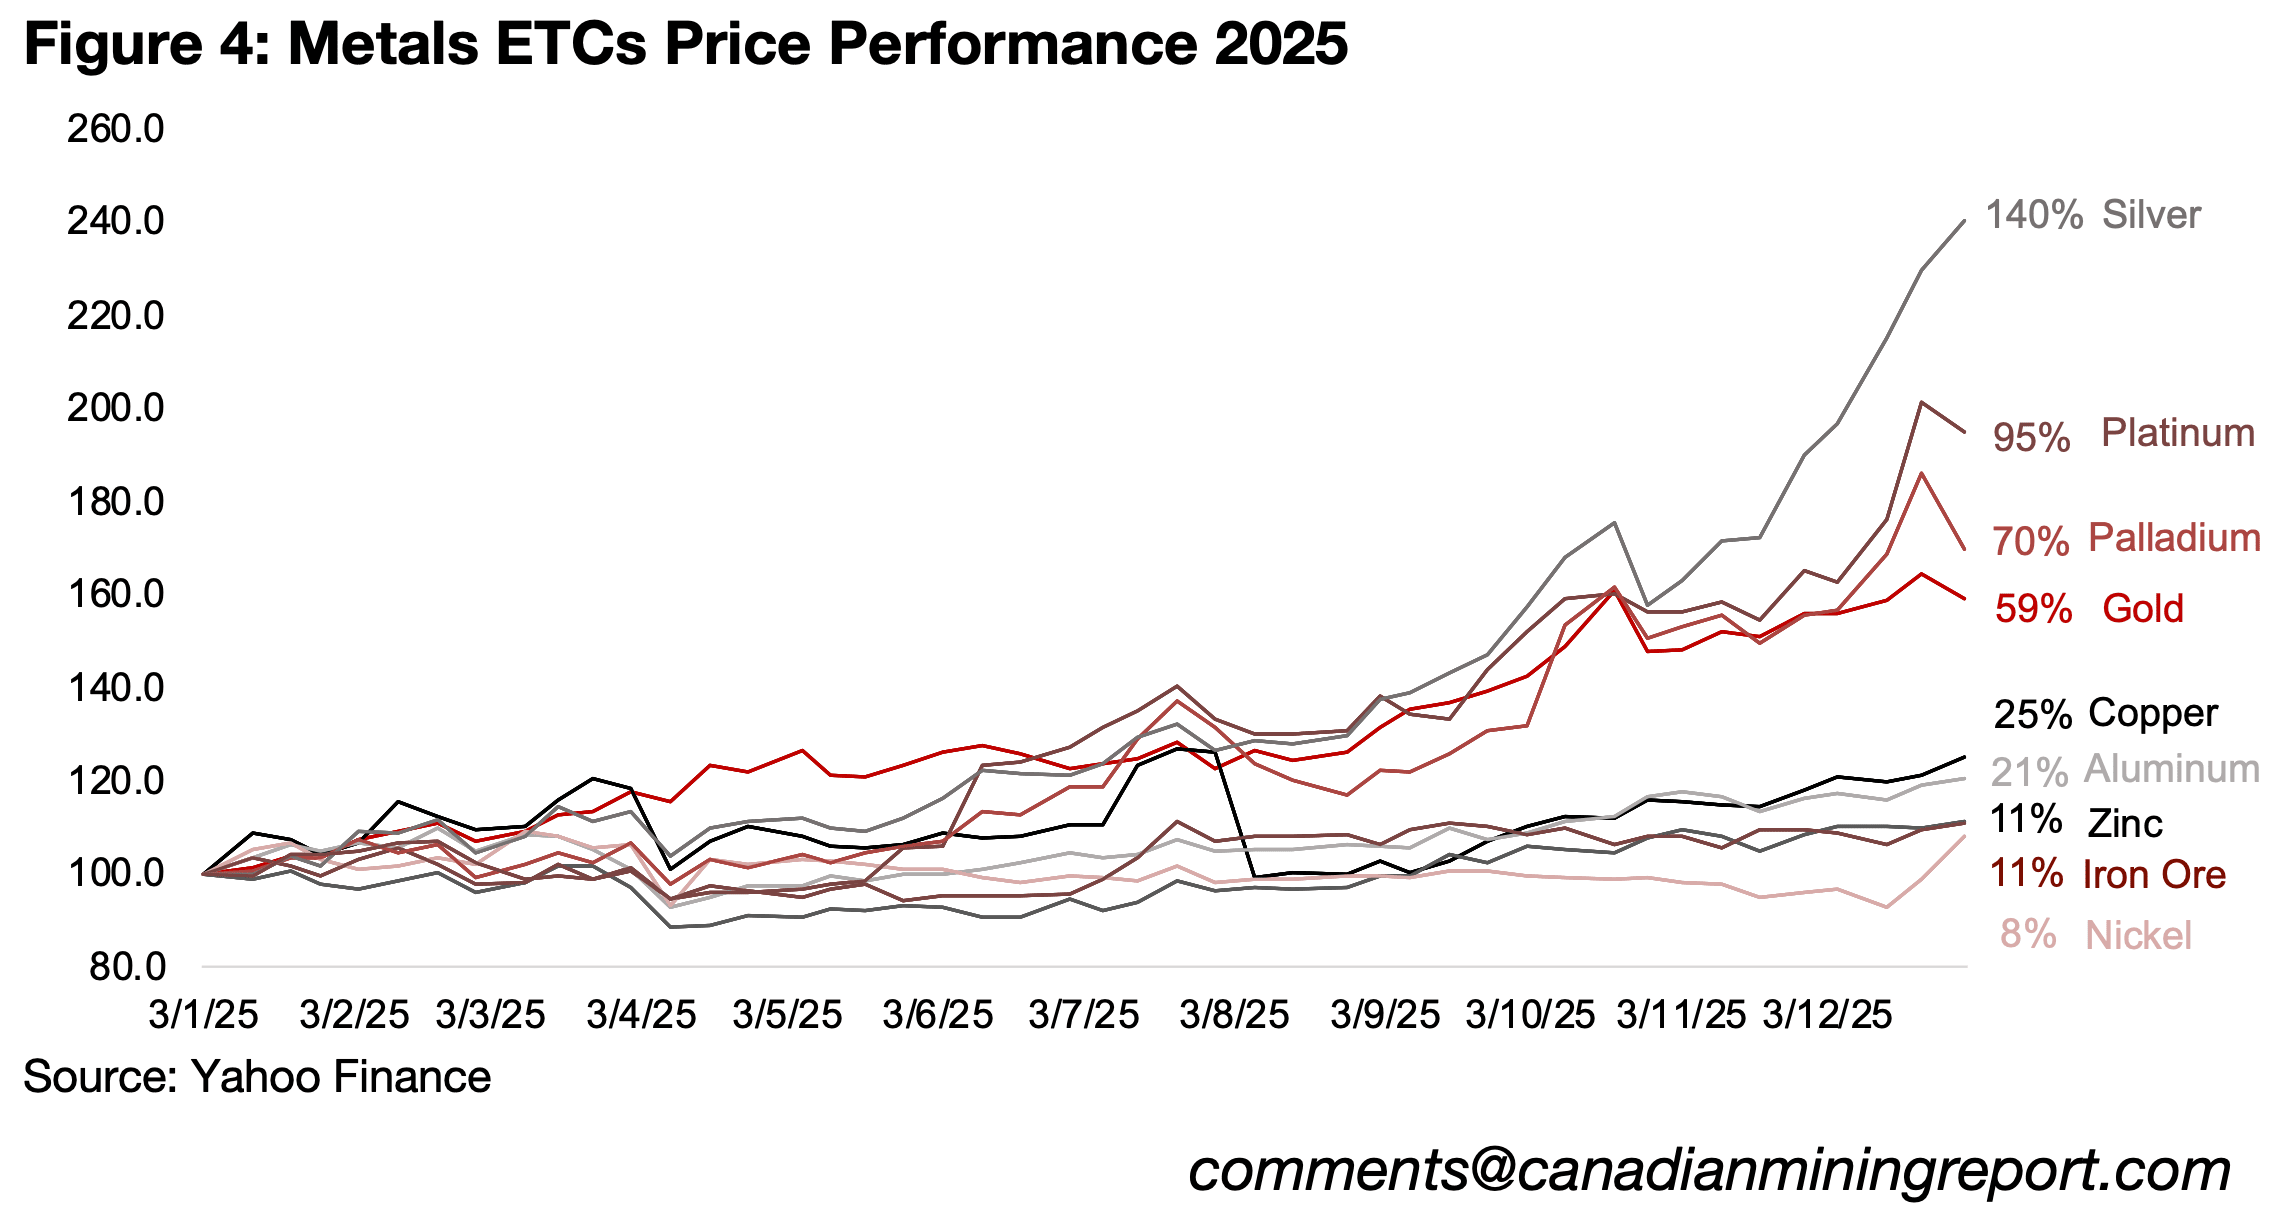
Last year saw gains for all the major metals, but it was especially big for the precious
metals (Figure 4). While gold was the star over H1/25, other precious metals gained
pace by Q3/25, and after a huge run in the last quarter of the year, had moved far
ahead of the 59% gain for the sector ETC. Silver was the stand-out, with acute supply
side issues seeing it surge 140%, while there was a 95% rise in platinum, with the
market also in deficit, and palladium gained 70%. The base metals were also strong
in absolute terms and only looked relatively subdued in the context of the precious
metals’ outsized gains. Copper rose 25% on supply shocks and aluminum gained 21%
on a moderate expected deficit, while iron ore and zinc rose 11% and nickel 8%,
even as all three faced a slowdown in the steel sector, their key source of demand.
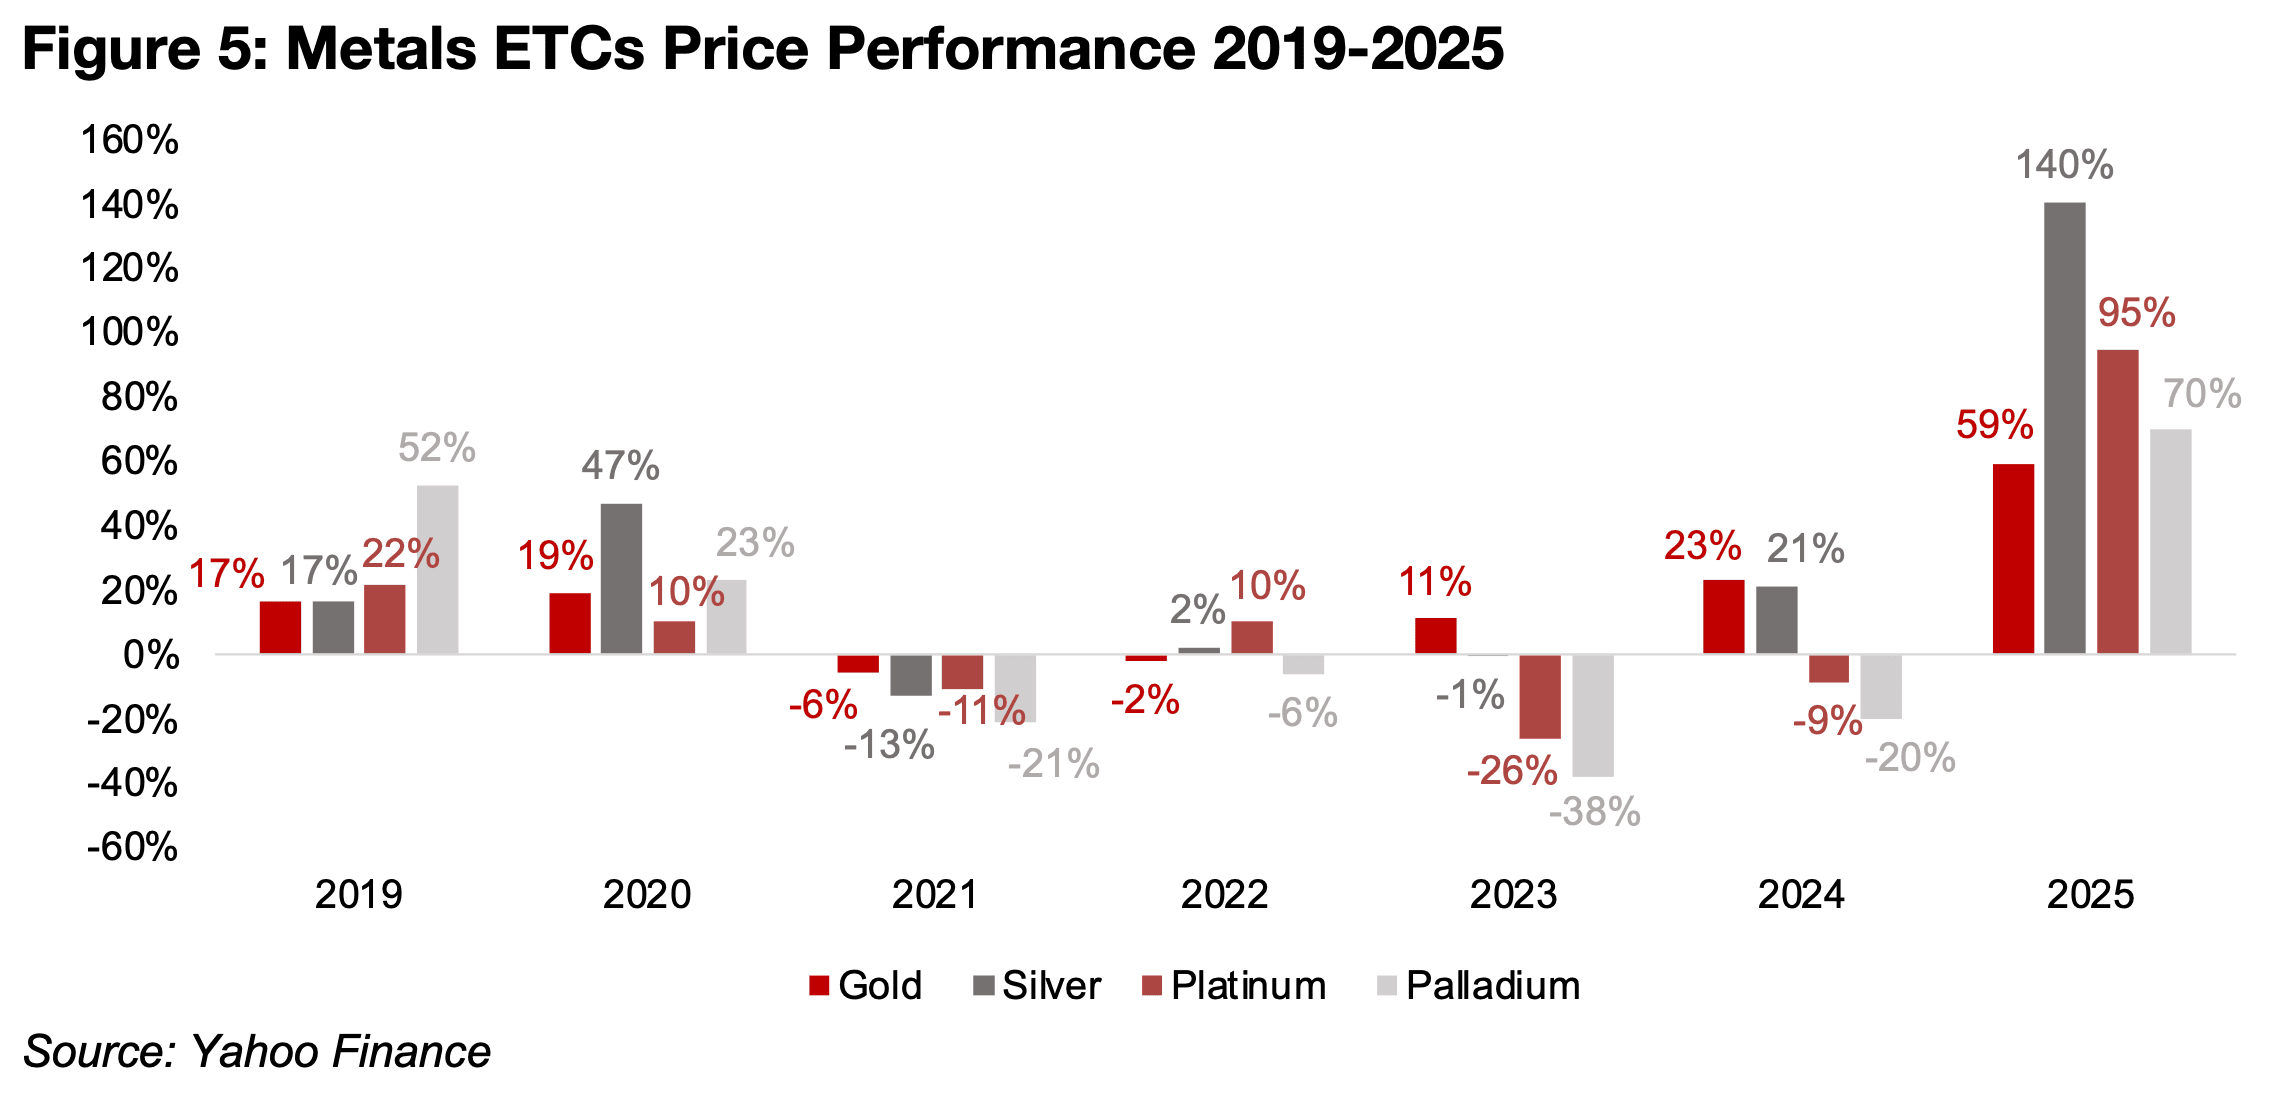
While gold and silver have been in a bull market overall really since 2019, this was the
strongest year by far for these two metals, dwarfing the gains of previous standout
years including 2019, 2020 and 2024 (Figure 5). While both platinum and palladium
were also relatively strong in 2019 and 2020, they mostly struggled with losses from
2021 to 2024, so the past year has been a remarkable rebound.
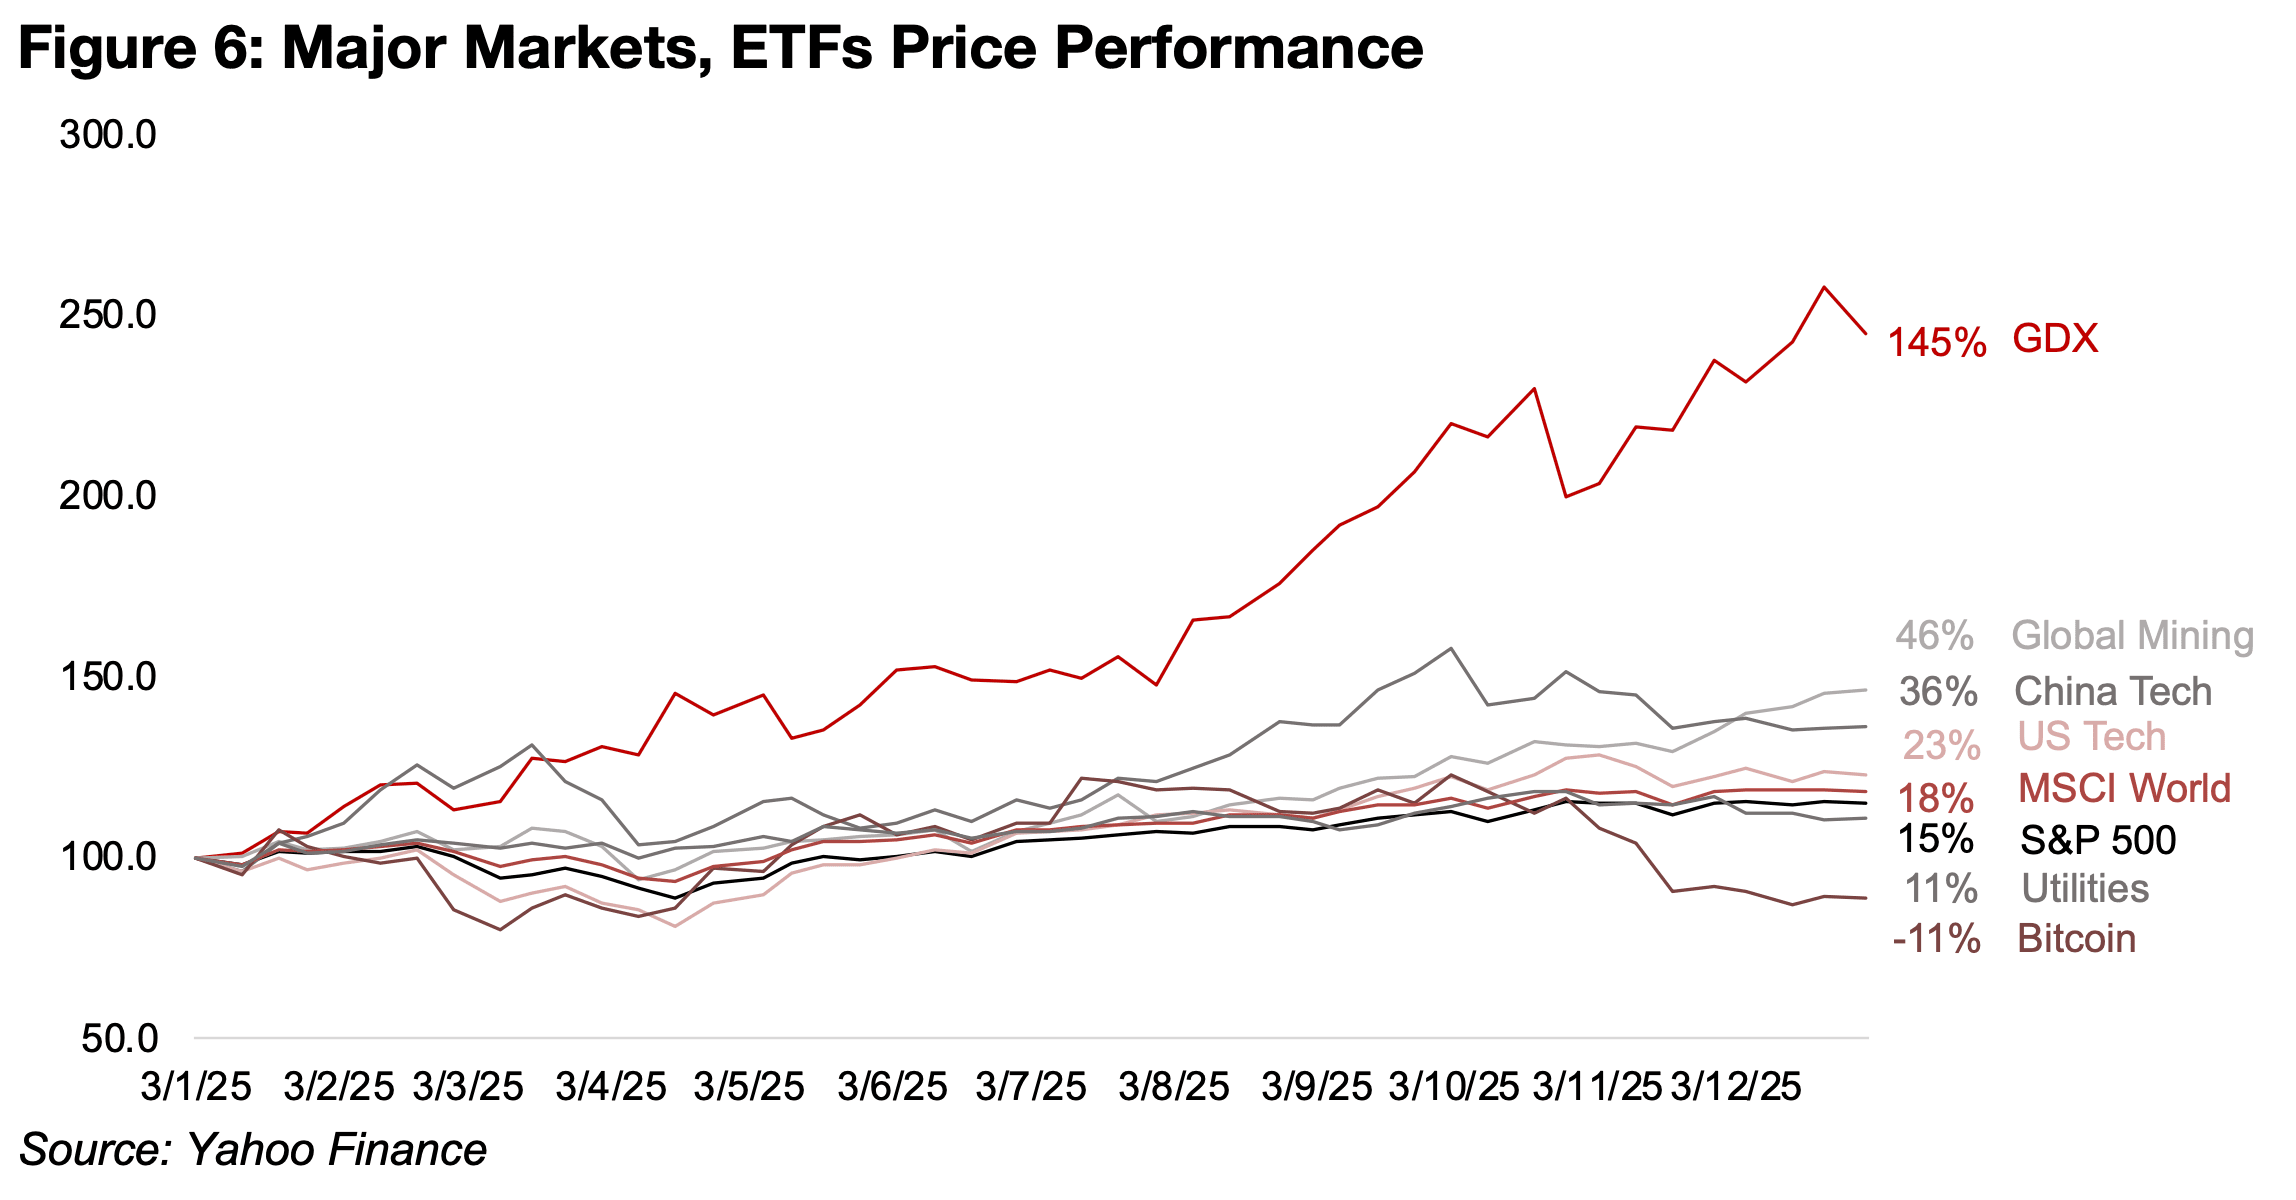
The gold stocks dramatically outperformed the markets, with the GDX ETF of
producers up 145%, 100% ahead of other major sectors (Figure 6). While the MSCI
Global Metals & Mining ETF did very well in absolute terms, up 46%, also
outperformed most other major sectors, this was still just a third of the rise in the gold
stocks, given its heavy exposure to the more moderate rise in iron ore and copper
prices. This saw the mining sector overall dramatically outpace global tech, which
was up 36% in China and just 23% in the US, after having been one of the strongest
sectors in 2023 and 2024.
The tech underperformance came as the sustainability of the AI boom and extremely
elevated valuations came into question in 2025. Markets had already started hedging
risk more with defensives from H2/24, and this continued in 2025. While this included
the shift into the gold sector, the highly defensive utilities sector was also strong, at
times matching the performance of the tech sector. While the performance of utilities
fell behind tech by the end of the year, it was still up 11%, only moderately below the
15% gain in the S&P 500. The slower US tech sector also saw the country
underperform the MSCI World, which rose 18% and a shift towards lower risk was
also demonstrated by the major underperformance of Bitcoin, down -11% for 2025.
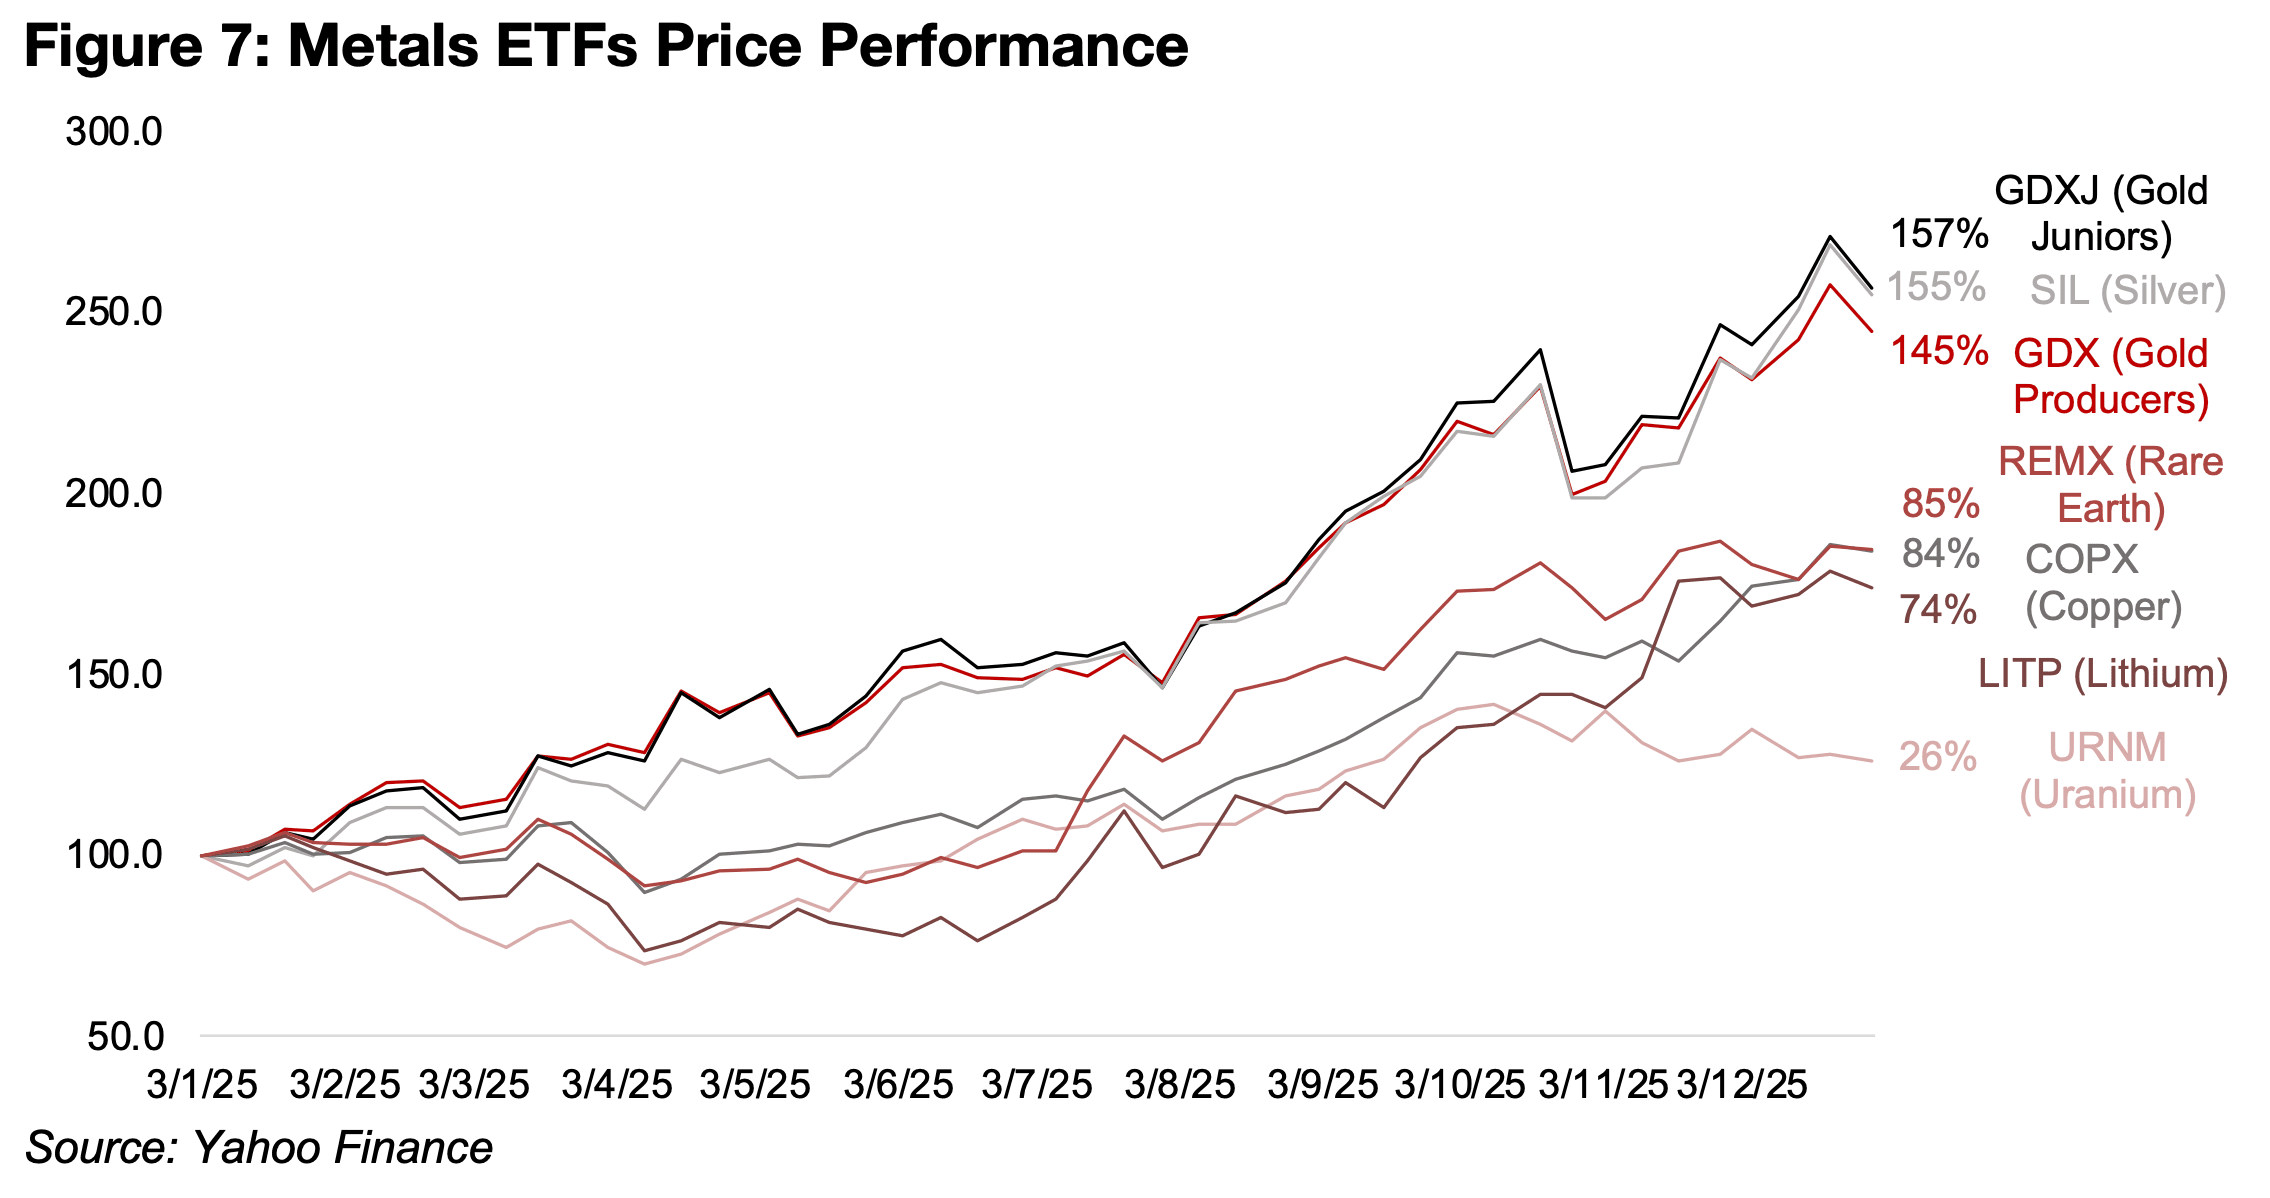
While the gold producers saw major gains, they were outpaced by the gold juniors, with GDXJ ETF for the sector rising 157% (Figure 7). With the strength in the silver price, it might have been expected that the SIL ETF of silver producers would have far outpaced the gold stocks, but it gained 155%, just below the GDXJ. This is because there are virtually no ‘pure play’ large silver stocks, and they all have large contributions to revenue from gold, and in most cases the proportion of revenue from gold is actually considerably higher than from silver. This makes the performance of SIL more of a combination of the gold and silver prices.
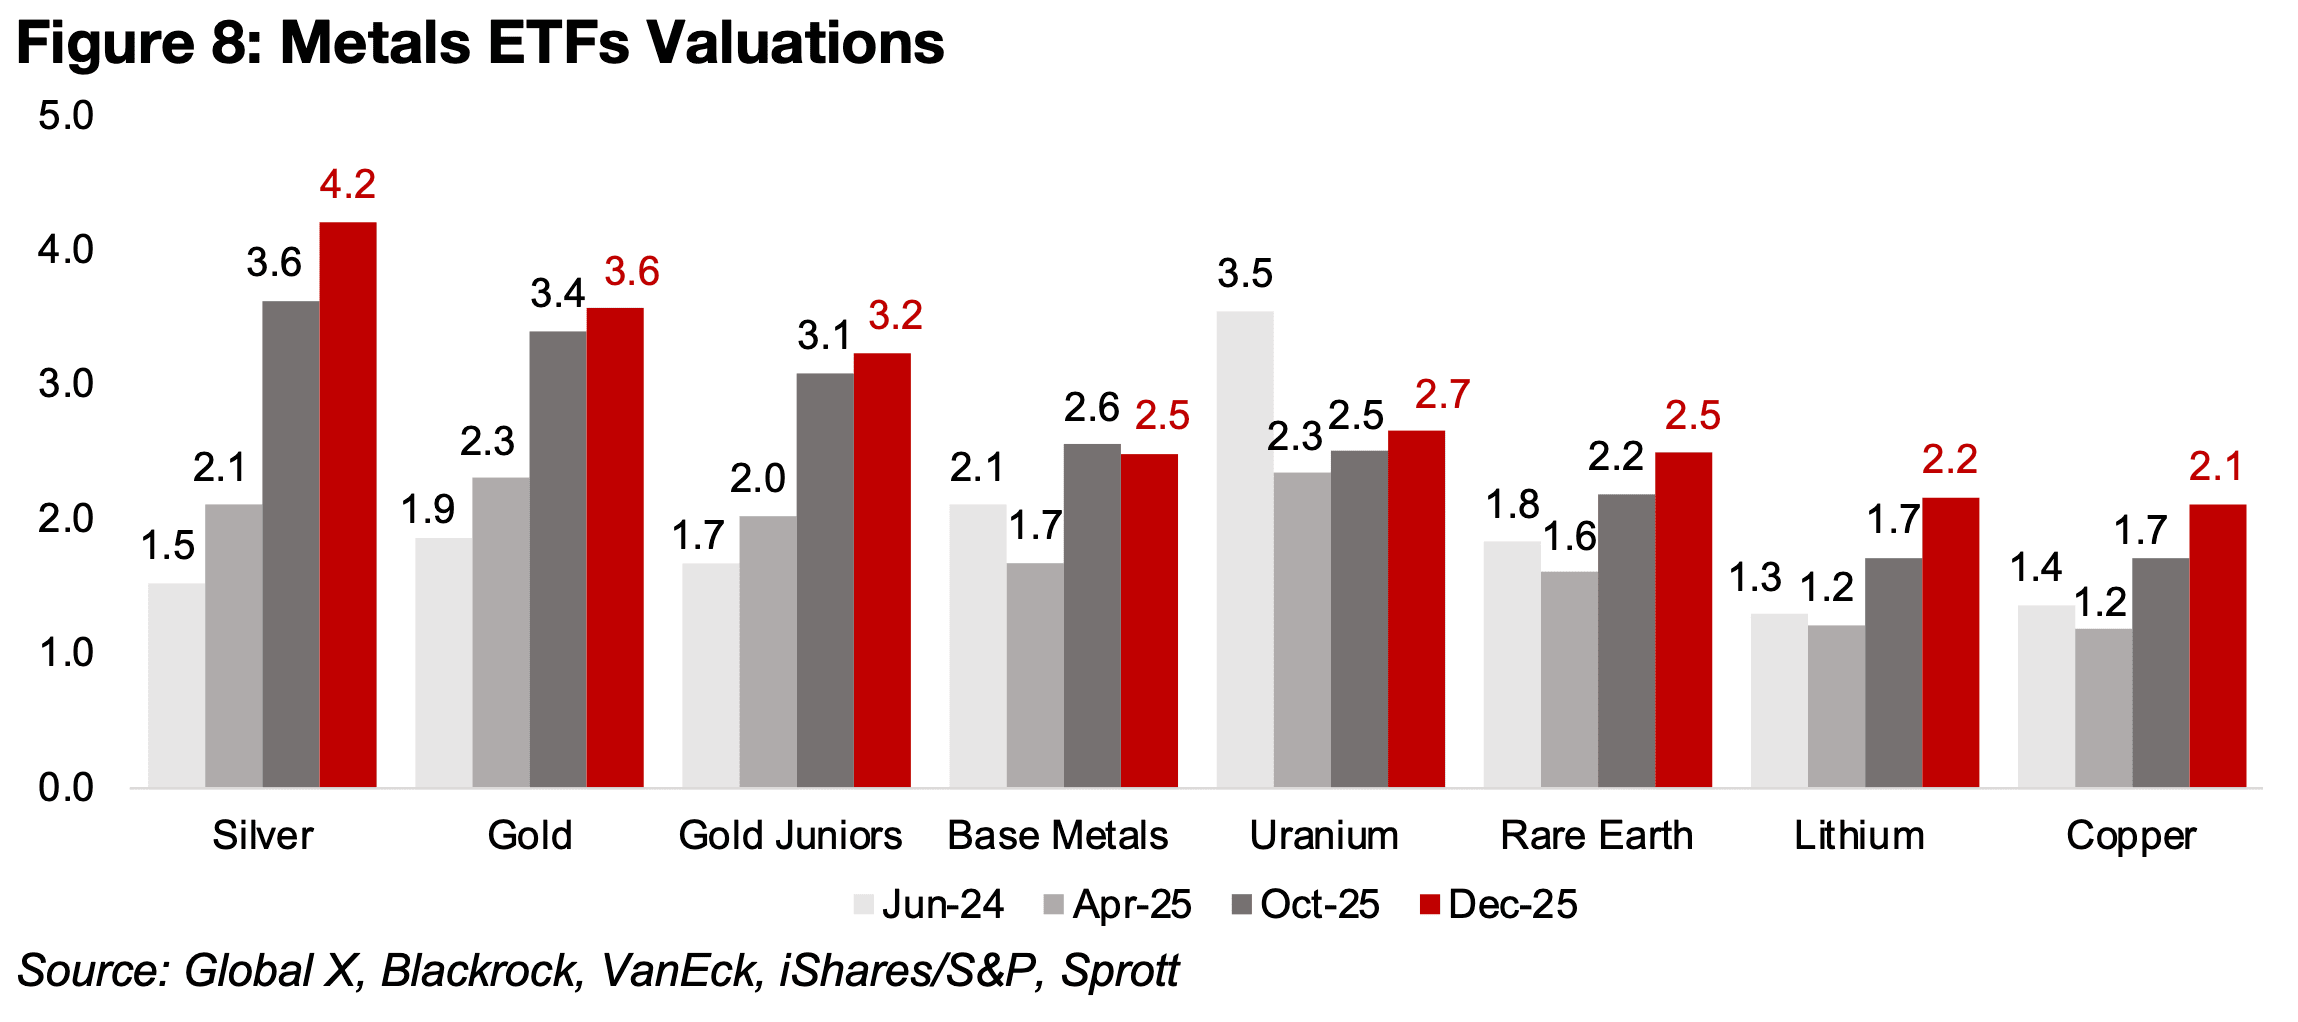
The rise in the silver price has driven up the valuations of silver stocks considerably
above the gold stocks, with the SIL price to book (P/B) multiple reaching 4.2x, by far
the highest of the major metals ETFs, and well over double the 1.5x of last year (Figure
8). The gold stocks have breached the 3.0x level, which could be considered where
multiples start to look expensive, with the GDX at 3.6x and GDXJ at 3.2x. This
suggests that the market is finally starting to price in higher gold and silver prices for
a longer period. While gold prices could continue to make gains in 2026, which could
pull these multiples down, even if they drop to 3.0x or 2.5x, this would not be the
extreme bull case present about a year ago.
The multiples for the ETFs of the other metals have also risen substantially over the
past year, with the P/Bs of the base metals, uranium and rare earth sectors between
2.5x-2.7x, up from just 1.2x-1.7x in April 2025. While these multiples are still only
moderate, they are also no longer clearly expensive. Only the lithium and copper ETF
multiples are still at reasonably lows levels of just above 2.2x, but even this is far up
from the just 1.2x multiples for both as of April 2025, with a P/B of below 1.0x
generally considered inexpensive for a company not in distress.
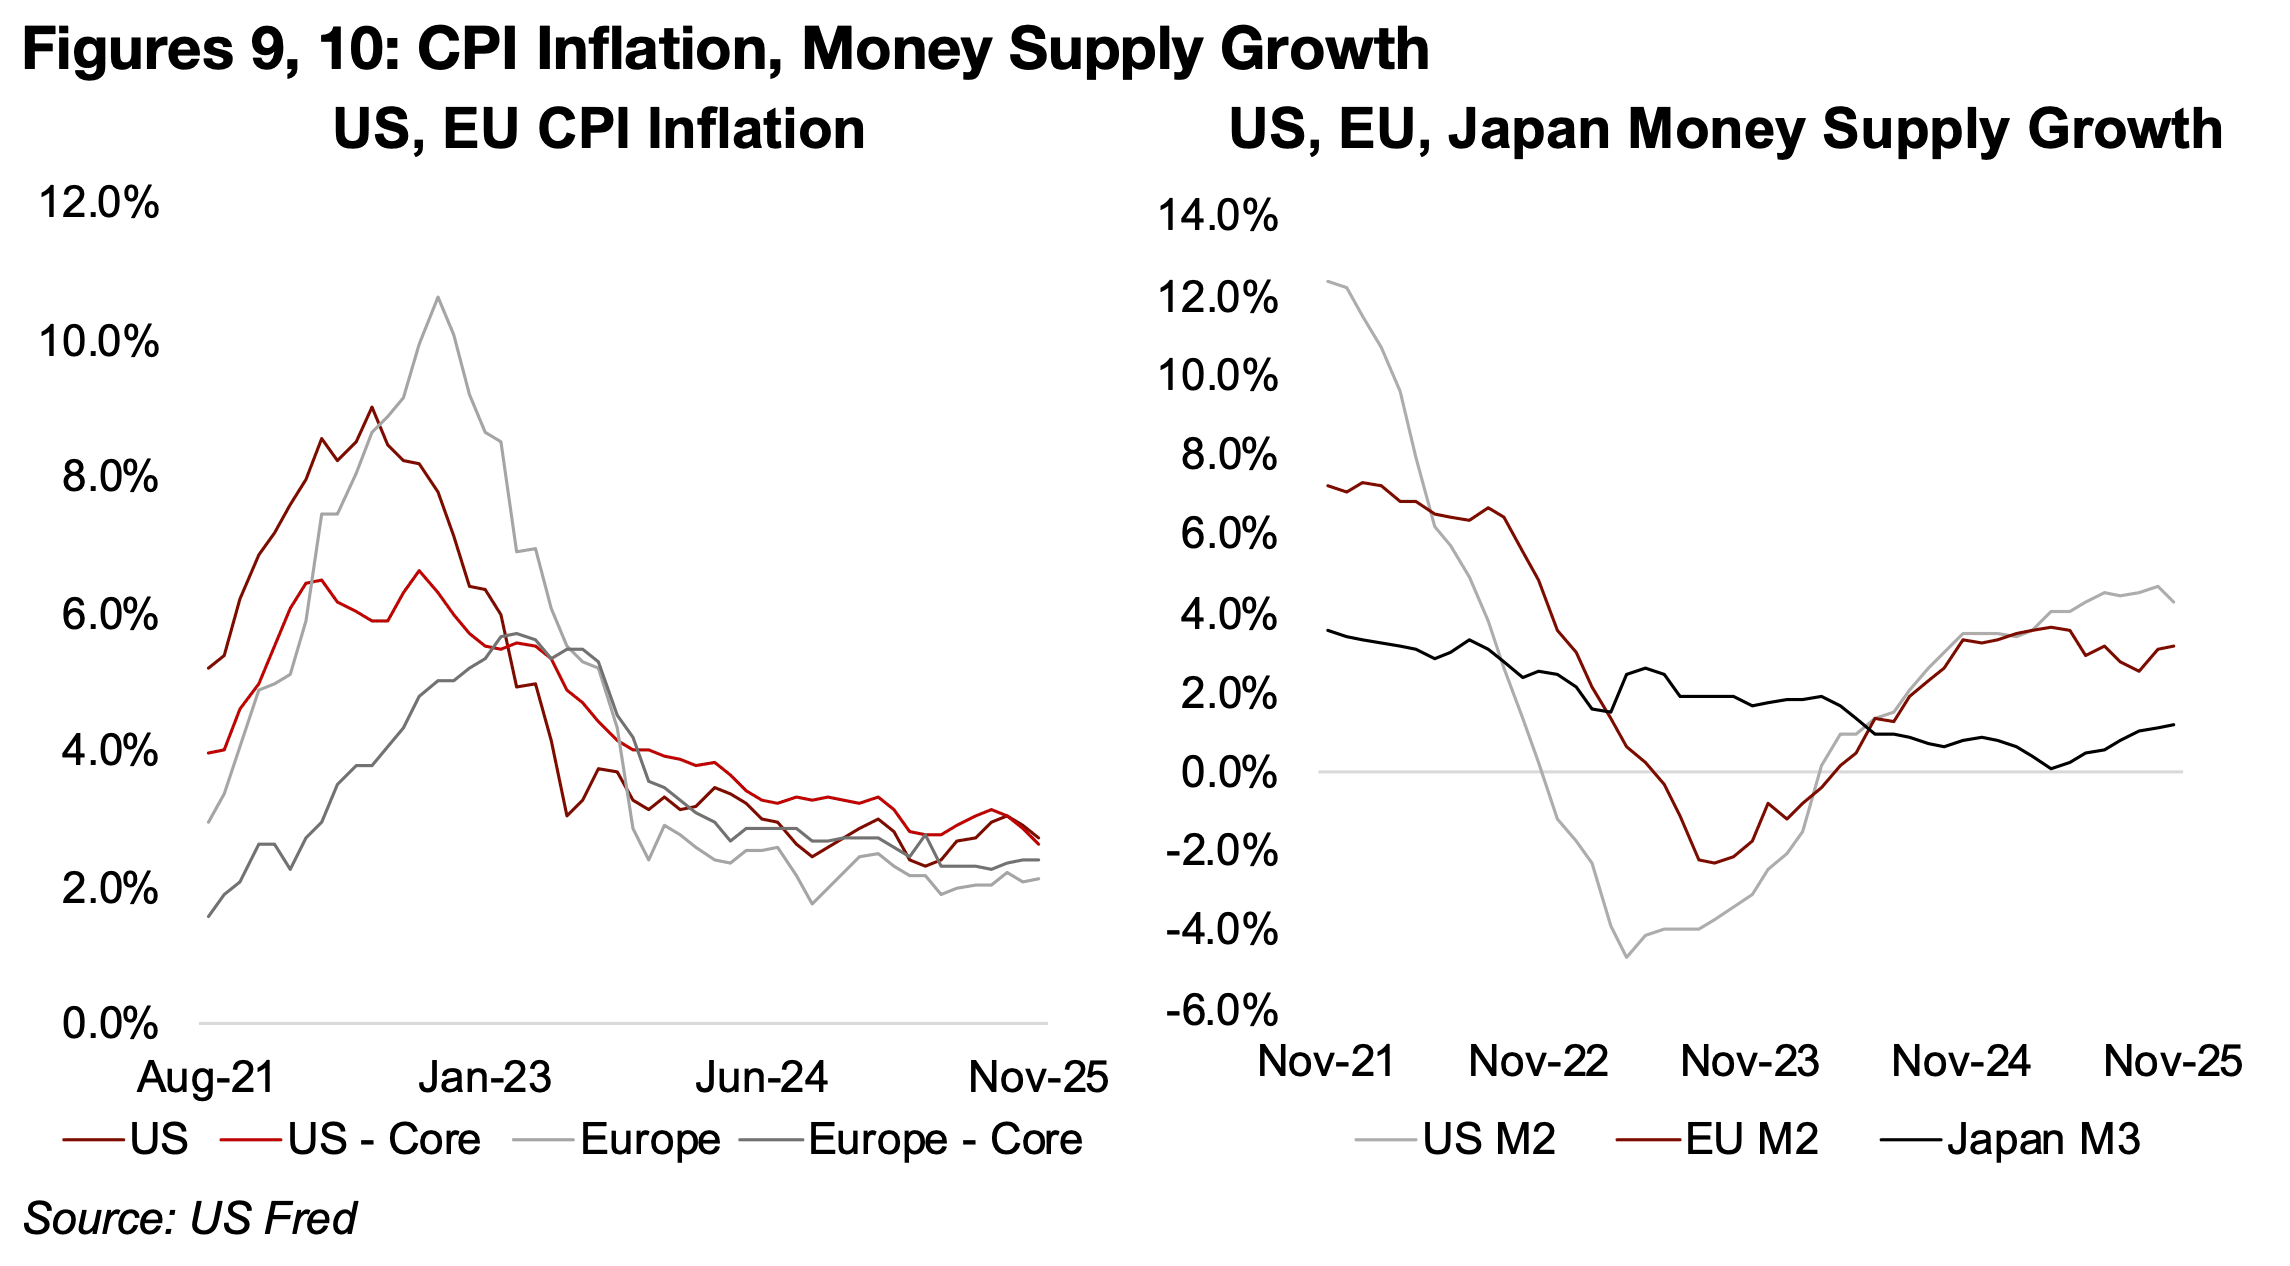
The macroeconomic situation in 2025 came in ahead of our expectations for potential
stagflation earlier last year, which would have seen low economic growth and
relatively high inflation. However, global output saw a decent expansion and prices
generally trended down overall, although much more gradually than the plunge in the
US and EU CPI from 2022 to 2024, and inflation did pick up briefly at points during
the year (Figure 9). Core inflation in the US and the EU remains slightly above the 2.0%
targets for both and there is still a risk for 2026 that a continued rise in the global
money supply could again drive up inflation.
The money supply has been expanding globally as most central banks have been
cutting rates since mid-2024, with the US holding off for most of 2025, but finally
capitulating in September 2025, and making three 0.25% rate cuts through to the end
of the year. Even with no rates cuts for much of 2025, the US money supply was
rising, while the EU money supply also continued to rise, although the expansion
slowed towards the end of the year (Figure 10). Money supply growth for the US and
EU had contracted from peaks in 2021 to troughs of -4.7% in April 2023 and -2.3%
in the EU in September 2023 and started to rise again from April 2024.
For Japan, money supply growth has not gone negative in recent years, although it
had trended down from a peak in February 2020 to a trough of 0.2% in May 2025,
with it rising since. China’s money supply growth in recent years has been relatively
strong, dropping only as low as 6.2% in June 2024, and has also increased this year.
Overall monetary expansion does tend to drive up CPI eventually, although there can
be a significant lag of a year or more, suggesting that the increases of the past two
years could results in inflation by 2026. The rise in the money supply tends be a core
driver of the gold price long-term and there are few indications that this trend of
money supply growth will reverse in 2026.
While the risk for inflation seems to be to the upside, the risk for growth remains to the downside, which could lead to stagflation for 2026. There are reports of consumers broadly under pressure globally, and they could reduce expenditure into 2026. Private investment could also be under pressure from rising yields, and many global governments are not in particularly strong fiscal situations that would allow them to spend aggressively, and even if they did, it could drive up inflation.
While central banks have been cutting rates over the past year and half overall, bond
yields have actually risen, with the 10-year yield of the US, UK, France and Germany
all up from mid-2024, even after a reduction in base rates for the countries (Figure
11). This could be because markets are expecting higher inflation or government debt
issuance medium to long-term. While higher yields and moderating inflation imply
higher real yields, which would generally be a negative driver for gold as it increases
the opportunity cost of the yield-less metal, other factors have clearly offset this driver.
Japan, which has historically seen low rates, had the largest absolute rise in yields in
2025, by 0.8%, which has raised concerns about an unwinding of the Japan carry
trade. The carry trade had been based on the high spread between borrowing at very
low rates in Japan and making higher yields in other markets, but this has become
less attractive as domestic rates rise and foreign rates decline. This could have a
disruptive effect on markets as it removes a major source of low-cost global liquidity.
The macroeconomic outlook for 2026 remains quite opaque, with an inflationary
economic expansion, stagflation or even a deflationary downturn all possible. There
would likely be enough inflation or surging risk in all these scenarios to continue
driving up the gold price. A scenario of high growth with low inflation and interest
rates, which would be negative for gold, seems unlikely this year. However, the effect
of these scenarios could vary widely for the base metals. An economic expansion
would likely drive up prices, stagflation could boost prices if the inflation is high
enough, but could also drive prices down if the decline in growth dominates. A
deflationary economic decline would likely be very negative for base metals prices.
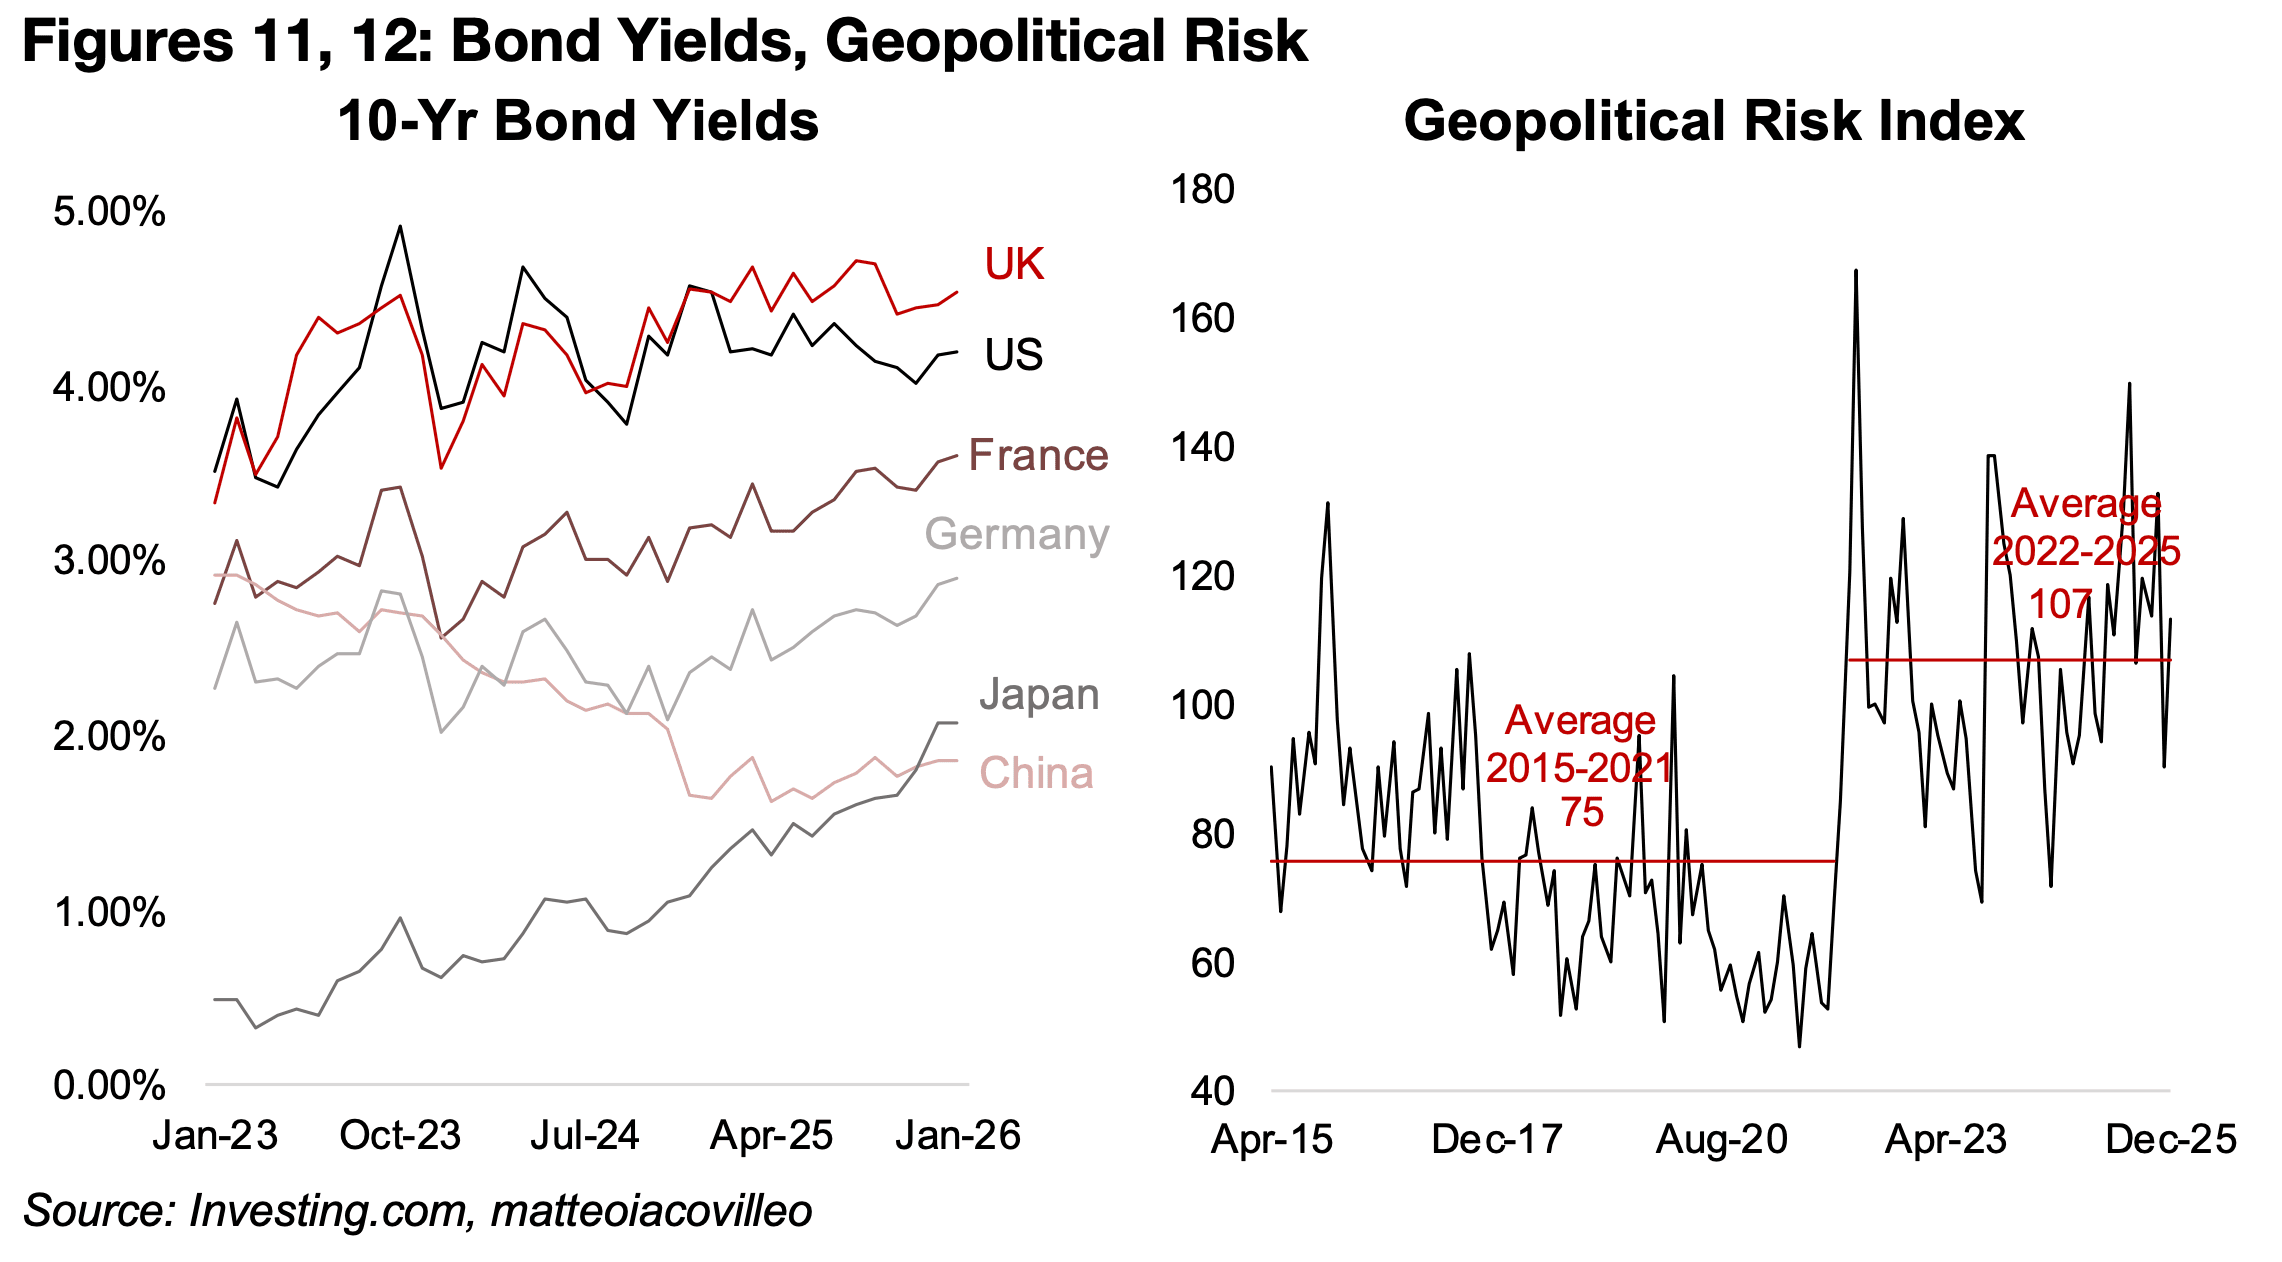
There were many developments in 2025 that showed a decline in geopolitical risk on the surface, but it seems that many global conflicts are still simmering below the surface. While there was a ceasefire in the Middle East and peace talks related to the Russia-Ukraine war, the situation in these regions seems far from stable, while China’s regional power projection continued and Germany and Japan indicated more aggressive military plans for the first time really in seventy years. It seems unlikely given this that the market would be willing to substantially reduce the premium in the gold price for geopolitical risk. The geopolitical risk index has declined to 113 from the highs for the year in June 2025 of 150, and is off its March 2022 peak of 167, but it has still been relatively high in recent years, averaging 107 from 2022-2025, compared to 75 from 2015-2021 (Figure 12).
While the core drivers for gold and silver especially, but also platinum and palladium to some degree, are a combination of the ongoing monetary expansion and geopolitical risk, there are also other factors driving the metals. For gold, one has been central bank purchases, which were 260 tonnes over 10M/25, putting them on track for 300 tonnes for the year, roughly matching 2024, although this is down from over 400 tonnes from 2021 to 2023 (Figure 13). While central banks may be easing off on purchases and see their reserves as sufficient after nearly twenty years of additions, they may also be waiting for a slightly lower potential buy in price. Huge central bank net gold additions have continued since the financial crisis of 2008, which made central banks globally wary of the stability of a system mainly based on the US$ since the late 1940s, with the last significant net selling in 2007 and 2008.
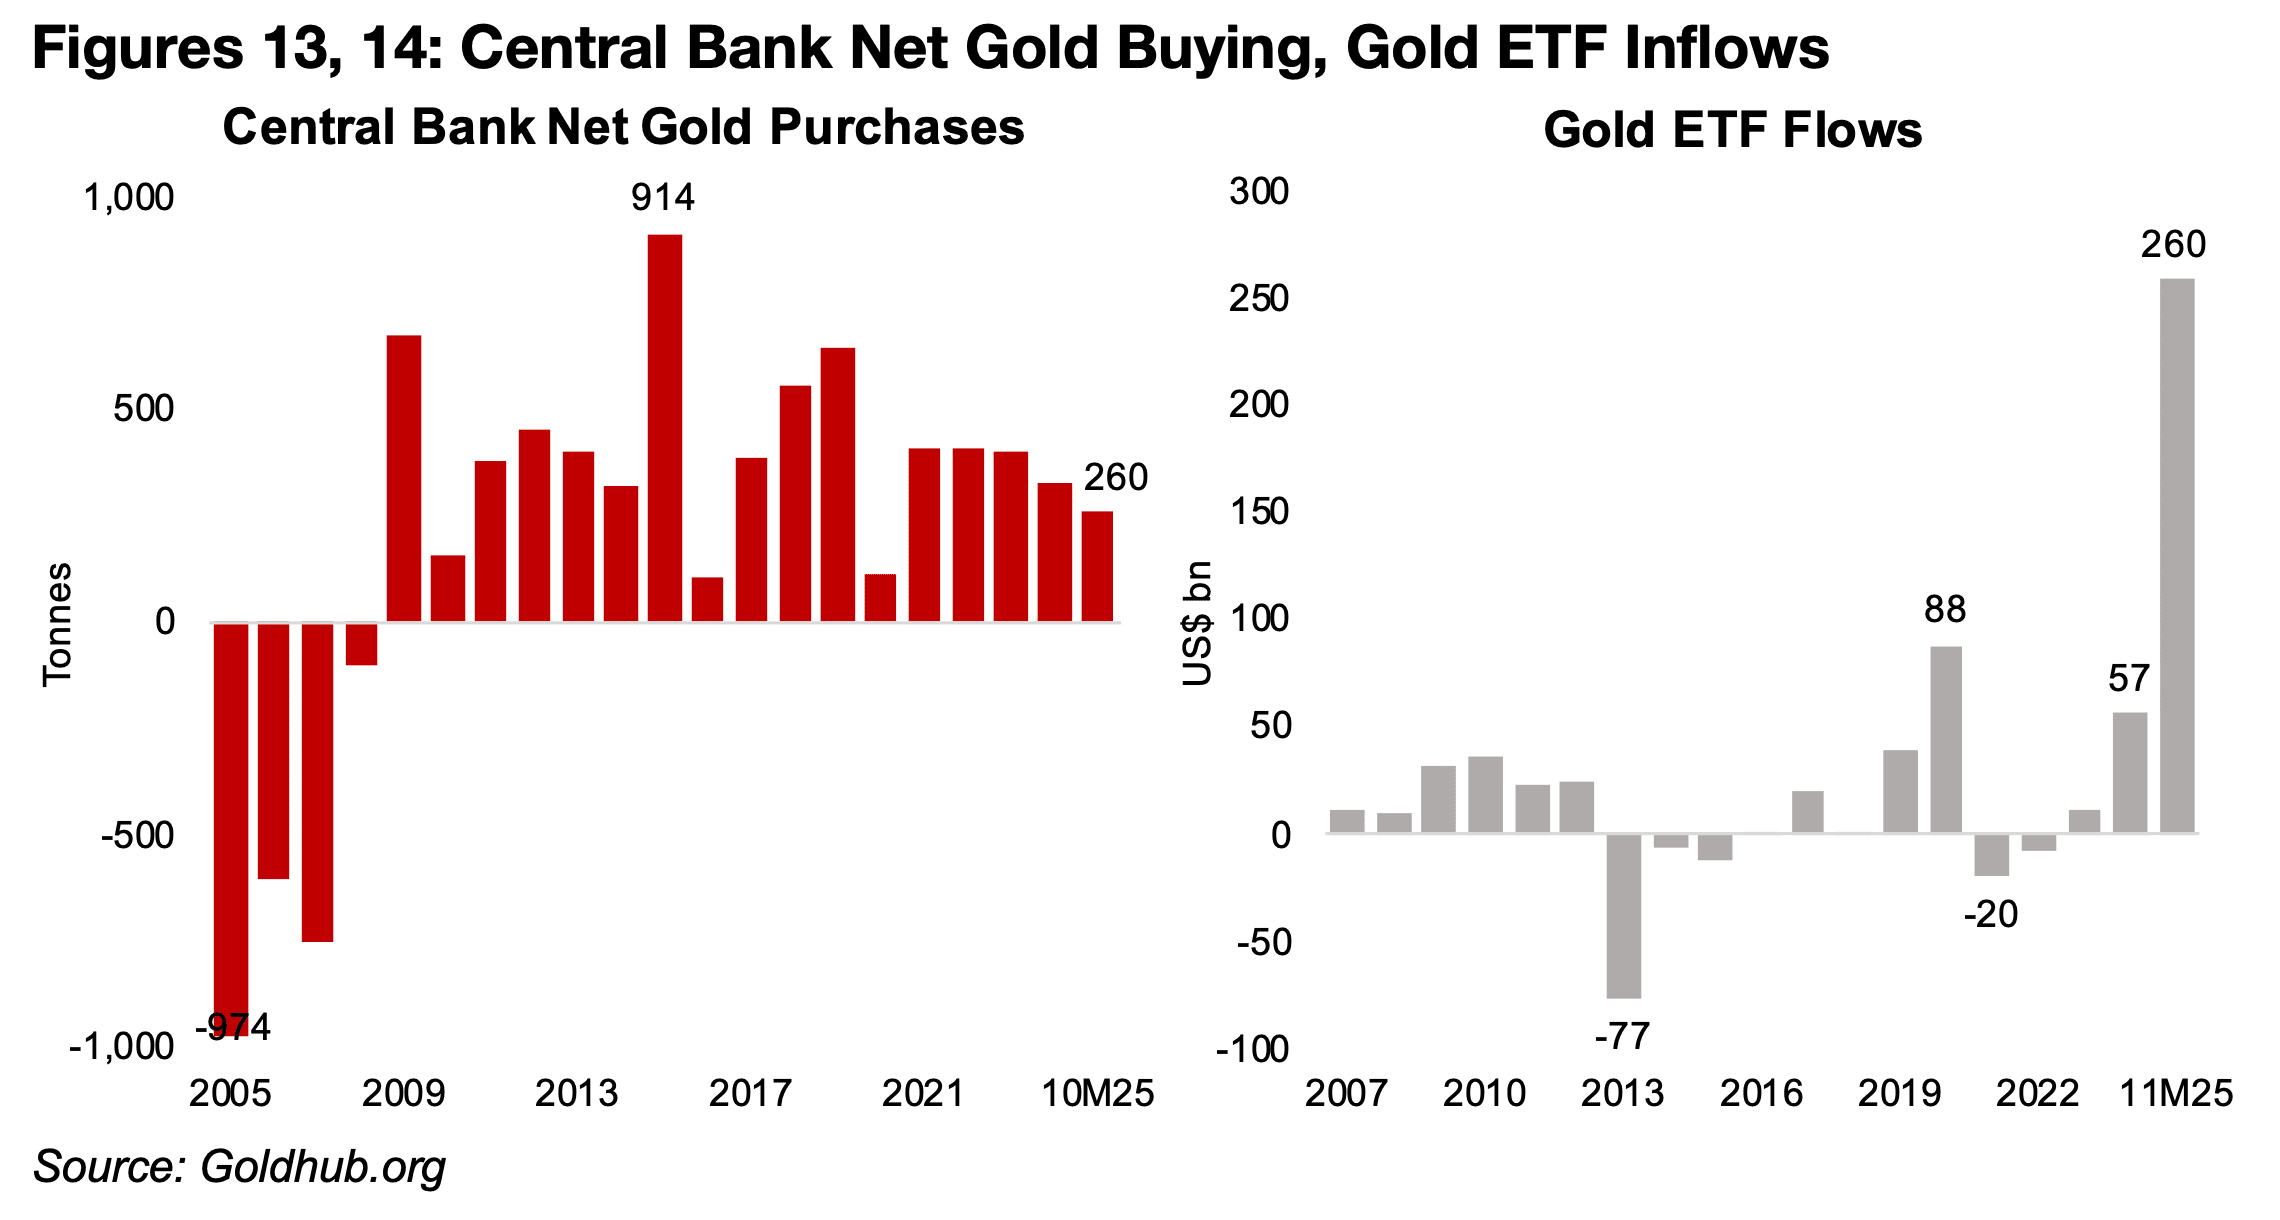
Net inflows into gold ETFs were enormous last year, surging to US$260bn, three times the previous peak of US$88bn in 2020, and far above the additions in 2023 and 2024 at just US$12bn and US$57bn (Figure 14). This shows a very strong retail interest in the sector which is not necessarily a great sign for the bull market, as hot money can flow out of these ETFs equally as quickly. It also shows that the gold trade has become a very consensus one, far more than during the large surge in gold ETFs in 2020. This can tend to make a trade risky as a shift towards too many buyers and an insufficient number of sellers starts to make a market unbalanced.
The silver market has seen some wild swings this year, as shown by its ratio versus
gold, which surged as high as 99.0x in April 2025, far above the medium-term average
of 82.3x from 2021-2025, as its price lagged, but has plummeted to just 60.5x, up
from lows of 56.8x in December 2025, given a severe supply shortage (Figure 15).
Silver inventories had been depleted at the London Bullion Market Association and
only replenished by major imports of silver from China through Hong Kong, which
nearly doubled in recent months versus the average earlier in the year.
This has been driven by a fifth year of deficit for the metal, with the price until this
year still too low to prompt miners to develop significant new supply. While silver
production from mines has grown over the past year, it has been outpaced by
demand from relatively new industries like data centers for AI and from electric
vehicles and the general continued electrification of the global economy. However,
there was an abrupt reversal in this silver spike towards the end of the year, which
could indicate that a move that started more with fundamental issues had become
more speculative.
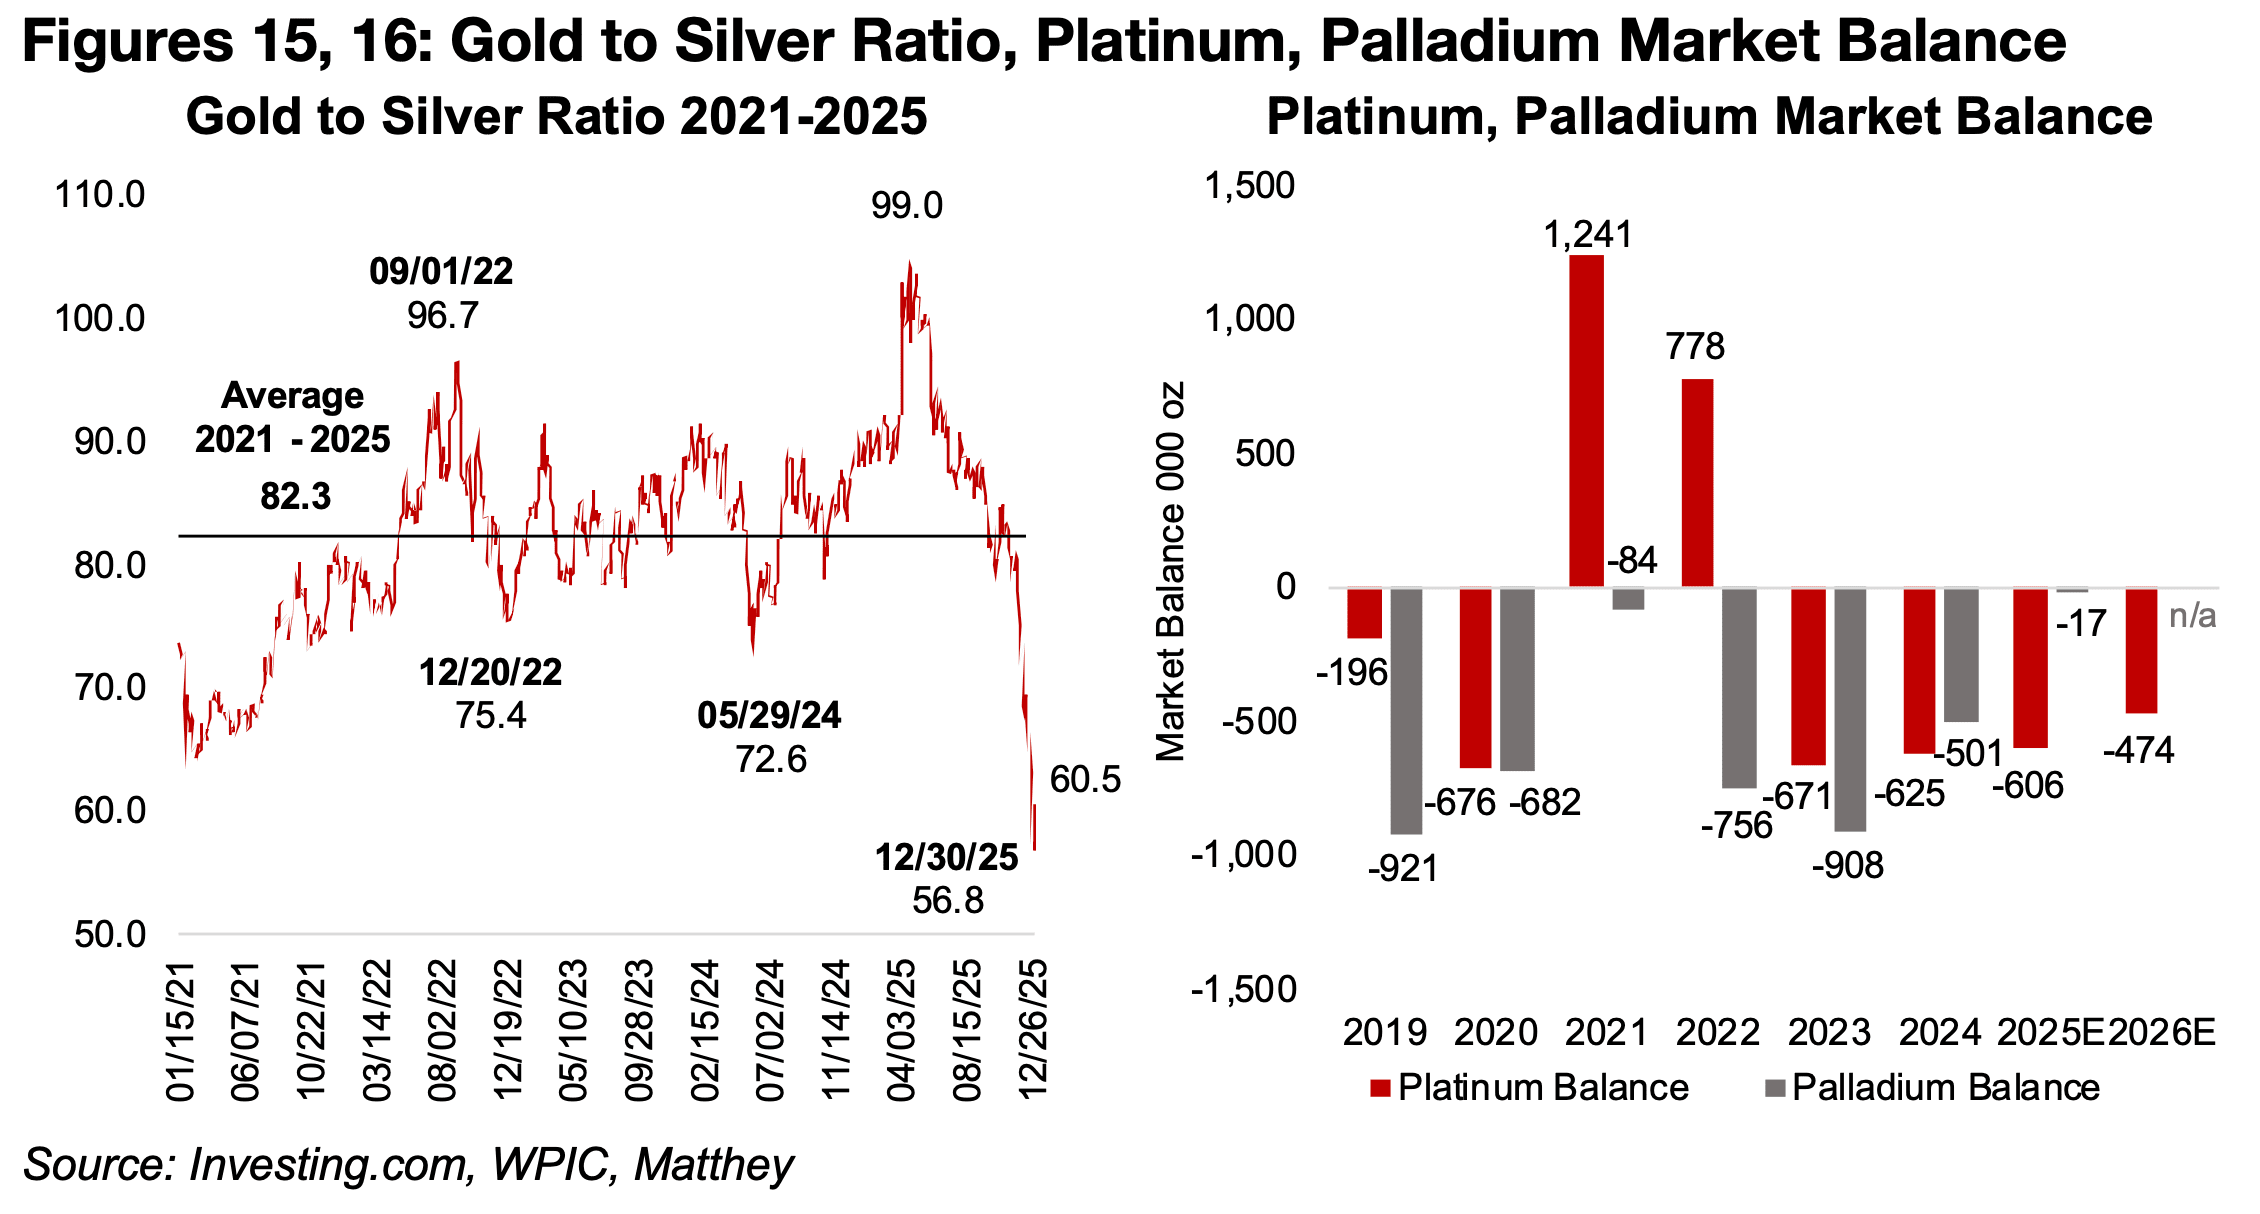
The platinum market has also been in deficit, which likely has been a factor driving up the price, although palladium has also gained even though its market has been relatively balanced (Figure 16). The largest components of demand for both of these metals are for use as autocatalysts, at about 40% for the former and 70% for the latter, and the auto industry performed better than expected in 2025. However, it seems that monetary factors, which are especially key for platinum, but also drive palladium to a lesser degree, were a major cause of the gains in 2025, as markets shift to ‘hard money’ sources and remained concerned over global currency debasement. There had also been a shift in China, the largest global buyer of gold jewellery, of substitution towards platinum jewellery earlier in the year, although this may have reversed in the last few months of 2025, as the price of the latter surged.
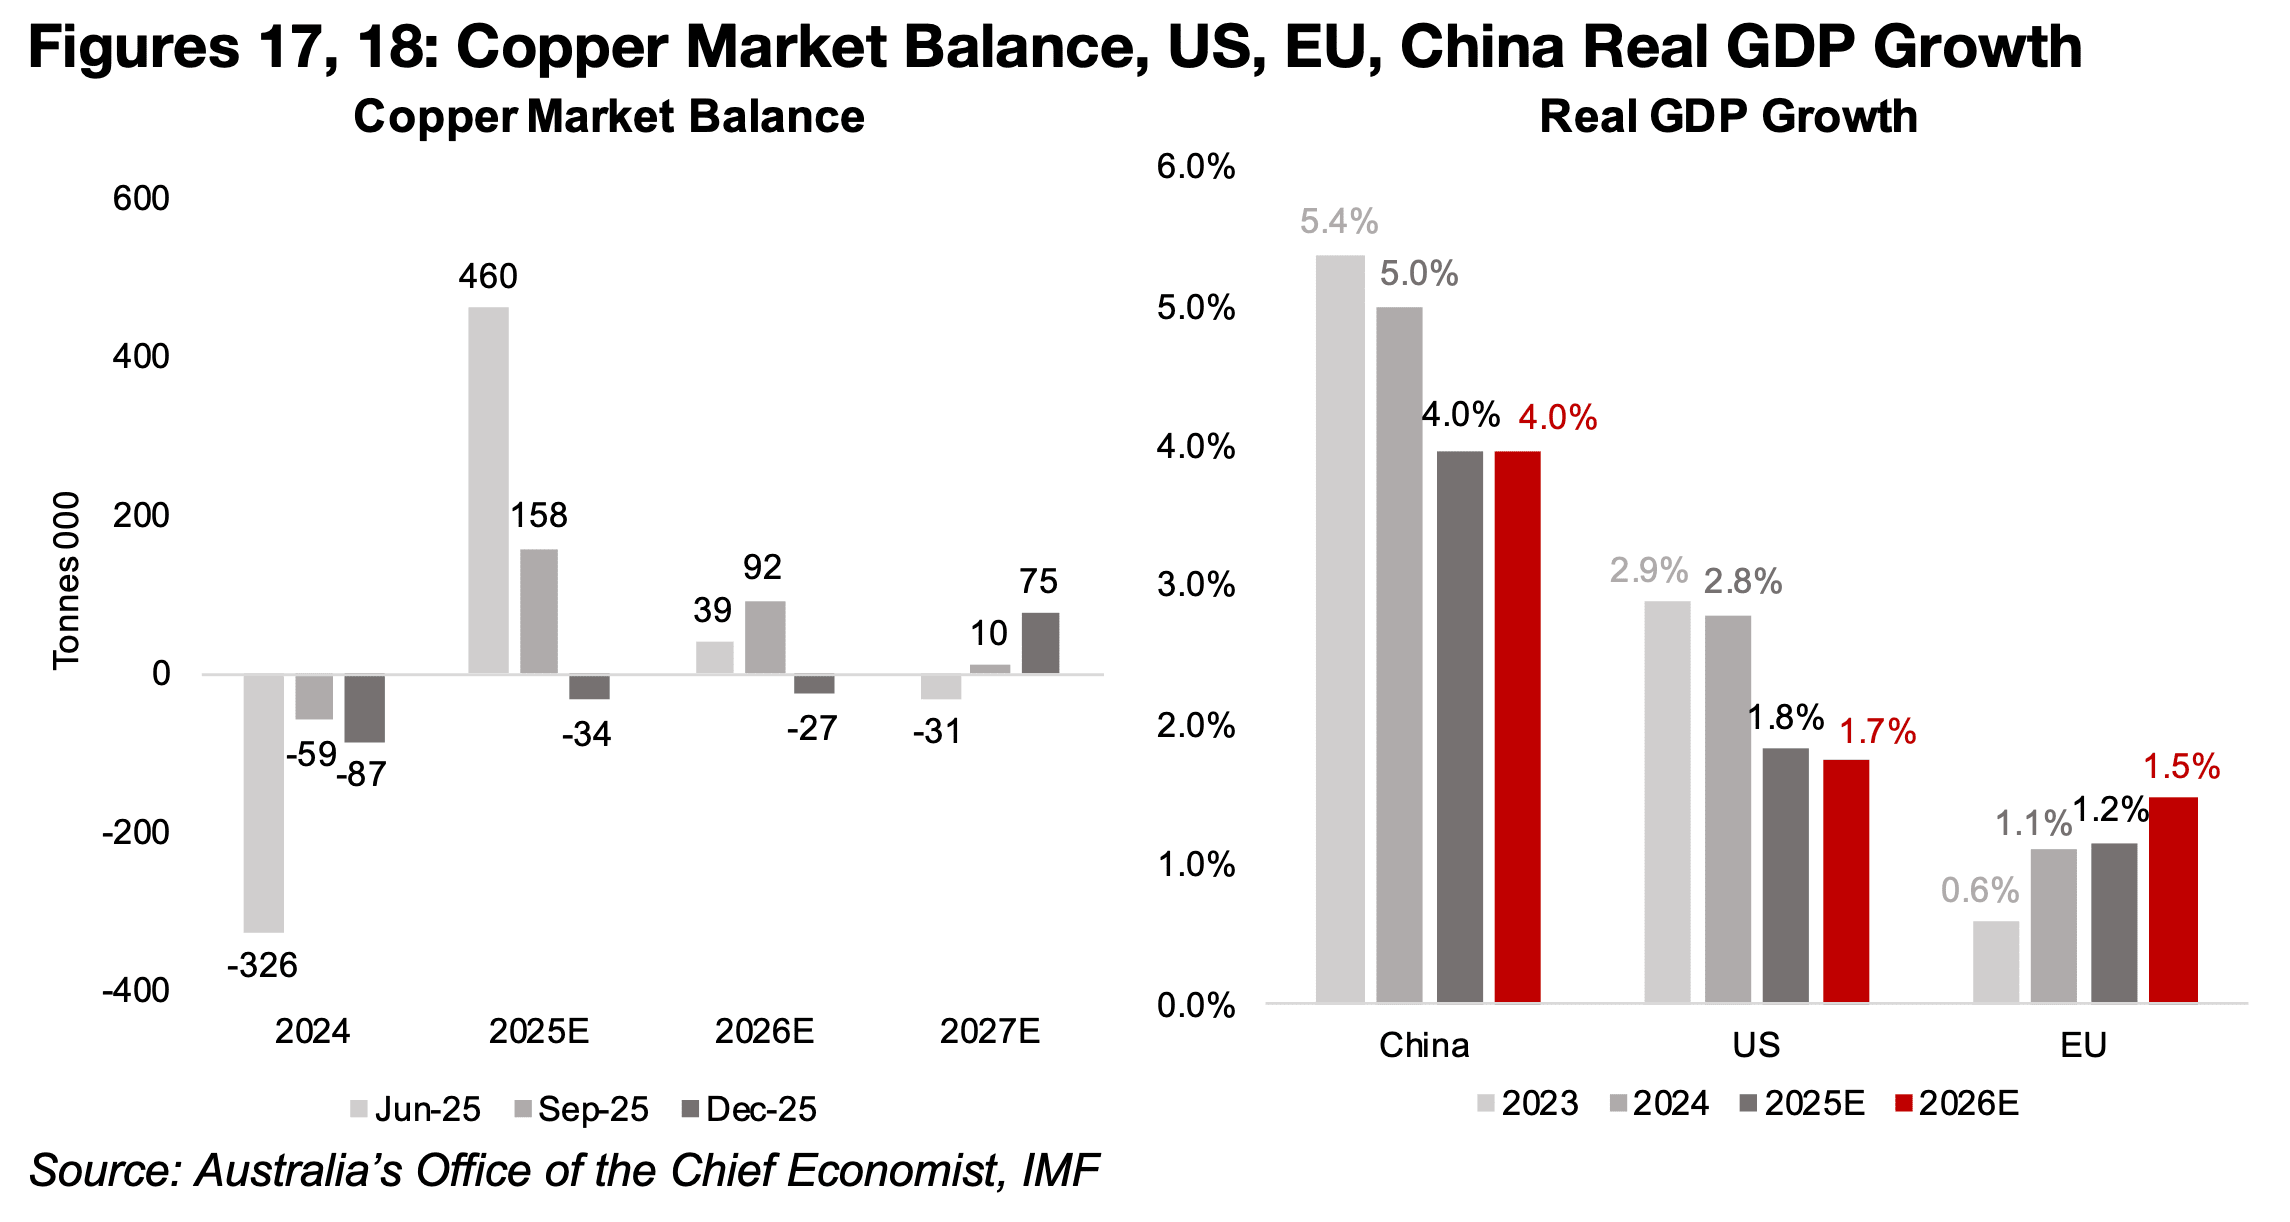
The copper price rose on a substantial change in expectations for a large surplus for
2025 to a small deficit, especially on the shutdown of a part of Grasberg in Indonesia,
the second largest mine for the metal globally, after a mudslide. This led Australia’s
Office of the Chief Economist’s to shift its 2025 forecast from a 460k tonne surplus
as of June 2025 forecast to a -34k tonne deficit in October 2025 with its 2026 forecast
changing from a small surplus in 2026 to a small deficit (Figure 17).
The copper price did see a significant surge related to US tariffs, with a large and
widening gap in the CME price in the US and the LME price in the UK from early 2025
to August 2025. This came after the US announced that it was investigating the
potential for major tariffs on copper imports. While the majority of global copper
inventories have historically been held in the UK, with the US and China having
smaller holdings, this caused copper inventories held in the US surge.
The price gap between the US and UK copper prices collapsed from early September
2025 as tariffs were finally announced on a much smaller proportion of US copper
imports than initially expected. However, the imbalance in global inventories versus
historical norms continues, and similar to silver, inventories in China plunged towards
the end of 2025 as the metal was exported to the UK to cover the decline there.
The iron price has lagged the rest of the metals, especially copper and aluminum,
which have demand from the global economy more broadly, as the majority of its
demand comes from China. The main sectors in the country driving demand for steel,
and in turn iron ore, property and infrastructure, continue to slow, and steel
production in the country declined over the past year. This has been a major cause
of the slowing rate of growth in China to 4.0% in 2025 from 5.0% in 2024, and growth
is expected to remain subdued at 4.0% for 2026E (Figure 18). Iron ore is also facing
a supply shock, but to the upside, with production starting from the huge Simandou
mine in Guinea, which is expected to ramp up to a significant proportion of global
production over the next few years, and drive the iron ore price down.
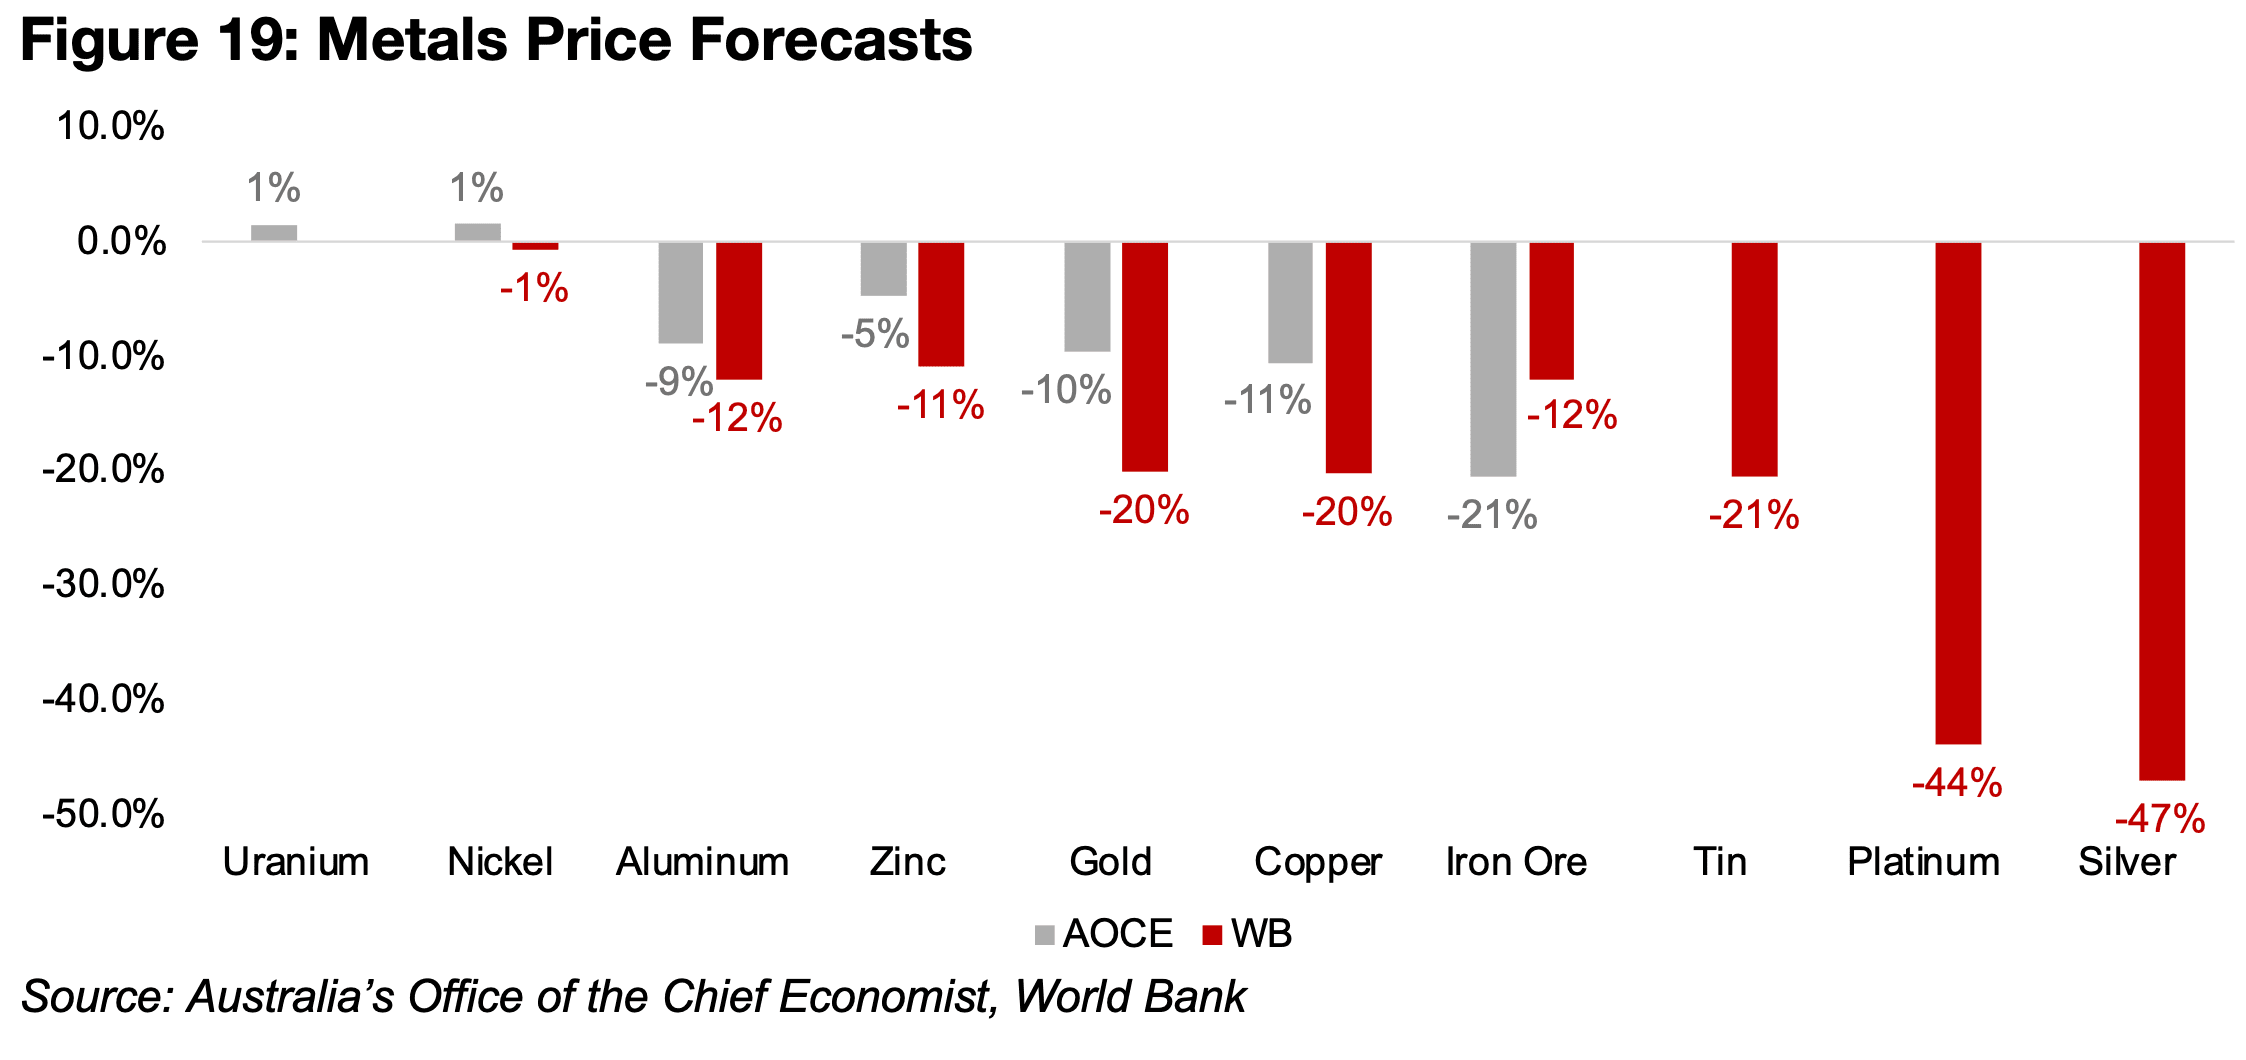
The two major institutions regularly releasing metals price forecasts, Australia’s Office of the Chief Economist (AOCE) and the World Bank (WB), have bearish outlooks for 2026, with forecasts flat only for uranium and nickel, and significant declines for the others (Figure 19). Both are negative on gold, although they have underestimated the metal every year of the bull market, as a strong gain tends to imply a worsening economic outlook. They are most bearish on platinum and silver, expecting severe reversals, apparently on an easing of the shortages driving their recent price spikes. The decline for copper, aluminum, iron ore, zinc and tin do not imply strong economic growth for 2026, although these forecasts were issued in October, before the huge moves in many of these metals in Q4/25, and could be revised.
In contrast, the major investment banks are quite bullish on the gold price at least, with targets from many of over US$5,000/oz next year. However, like the retail gold ETF inflows, this may not necessarily be a great sign for the bull market, as the investment bank forecasts have tended to lag the realized gold price significantly over the past few years. This is the first year their forecasts look like they might actually get ahead of the gold price, and further indicates that the trade has become increasingly consensus, and not the less crowded trade it was in 2024.
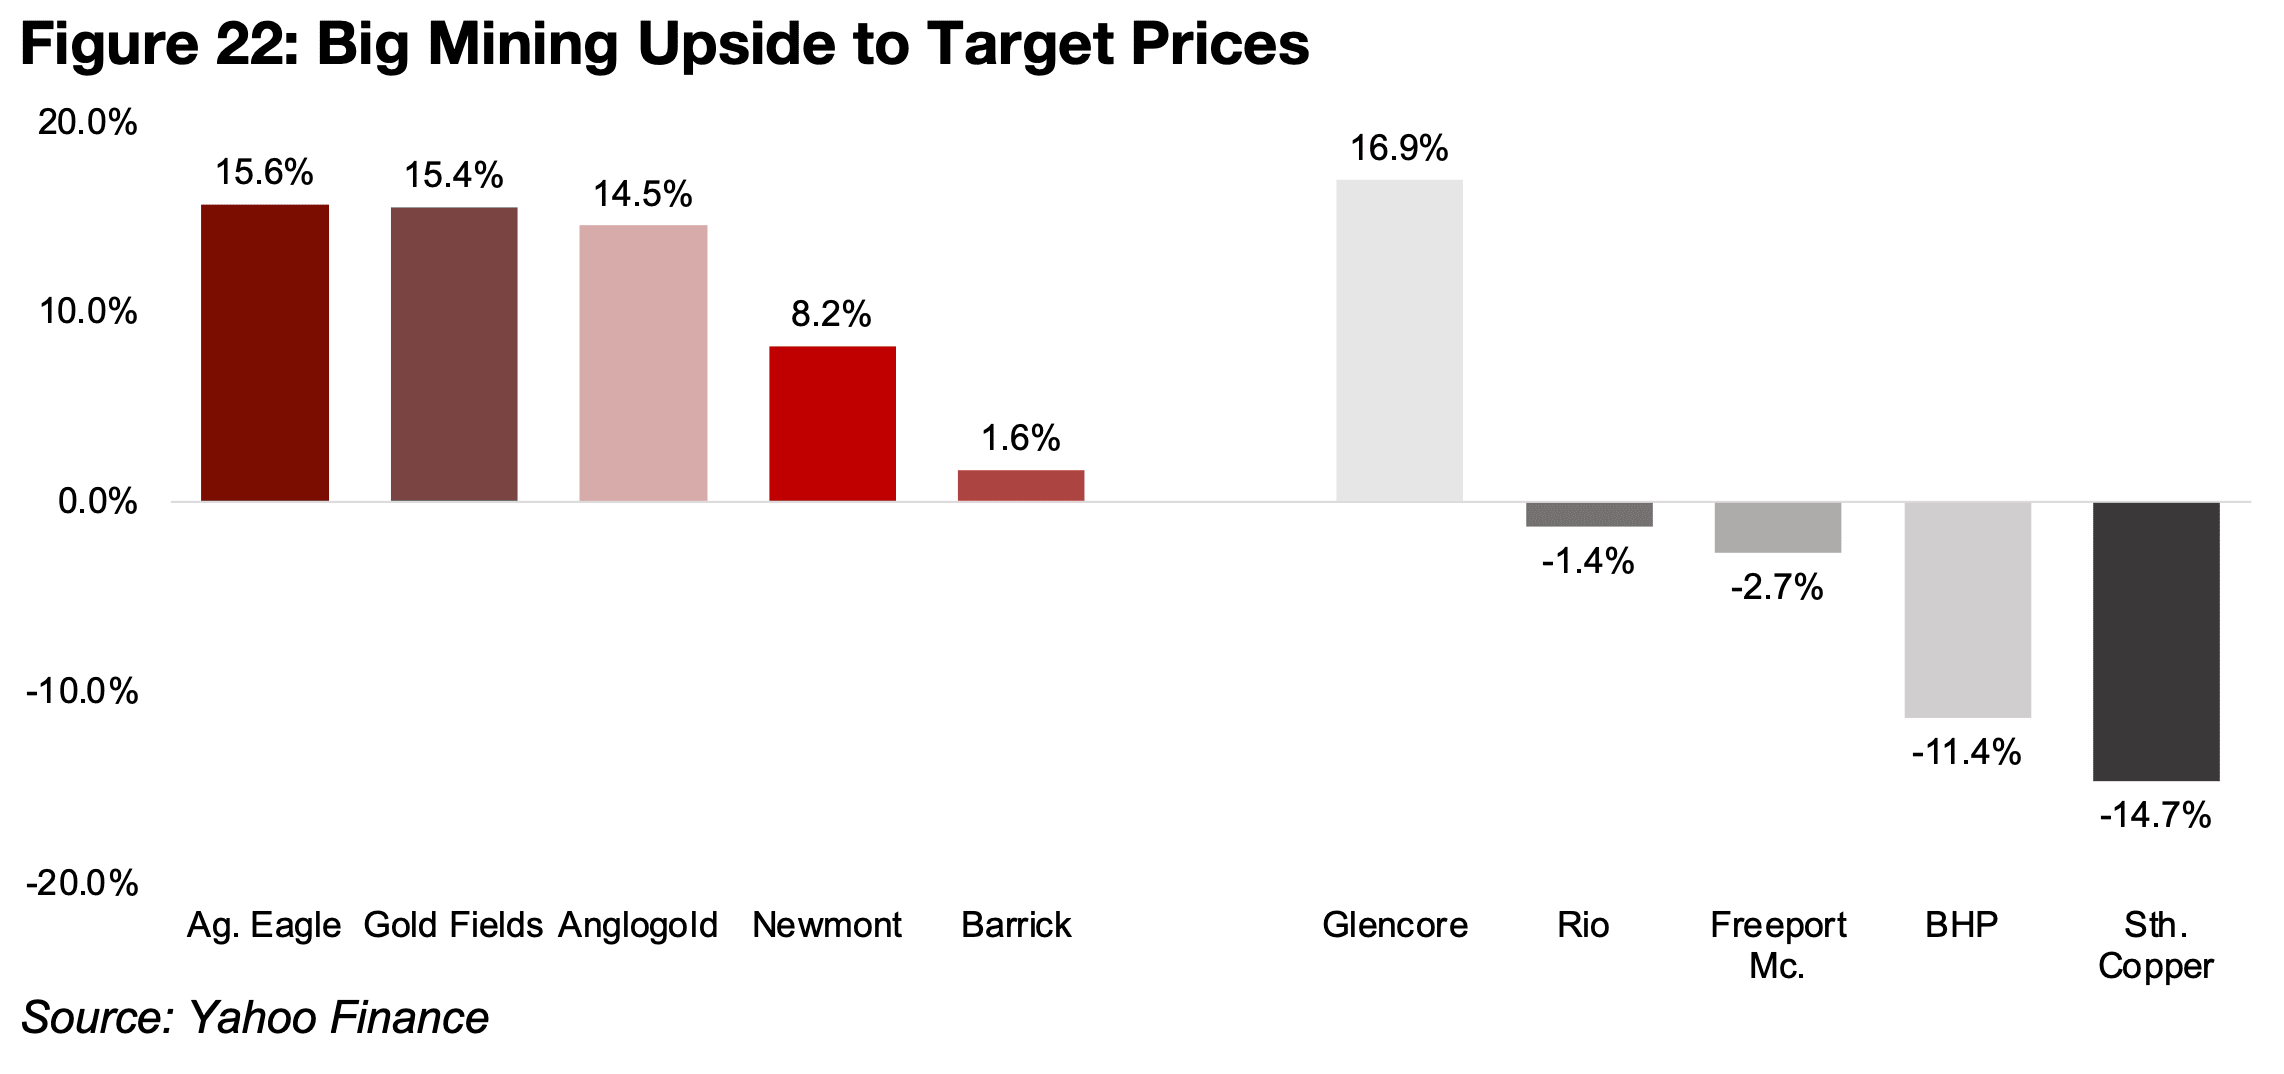
The largest global mining stocks all saw significant gains, with gold stocks leading, but base metals stocks also had decent increases. The two top performers were South Africa’s Anglogold, up 258%, and Gold Fields, gaining 213%, while Canadian producers Barrick and Agnico Eagle rose 175% and 109% and US operator Newmont increased 162% (Figures 20, 21). This came mainly on the rise in gold price, but also from subdued increases in operating costs for the sector. The gains have seen the sector move towards their target prices, which have been significantly revised upwards this year to incorporate the rise in the gold price. There is about 15% upside to the consensus targets of Agnico Eagle, Gold Fields and Anglogold and 8% for Newmont, with the market seeing Barrick as nearly fully valued (Figure 22).
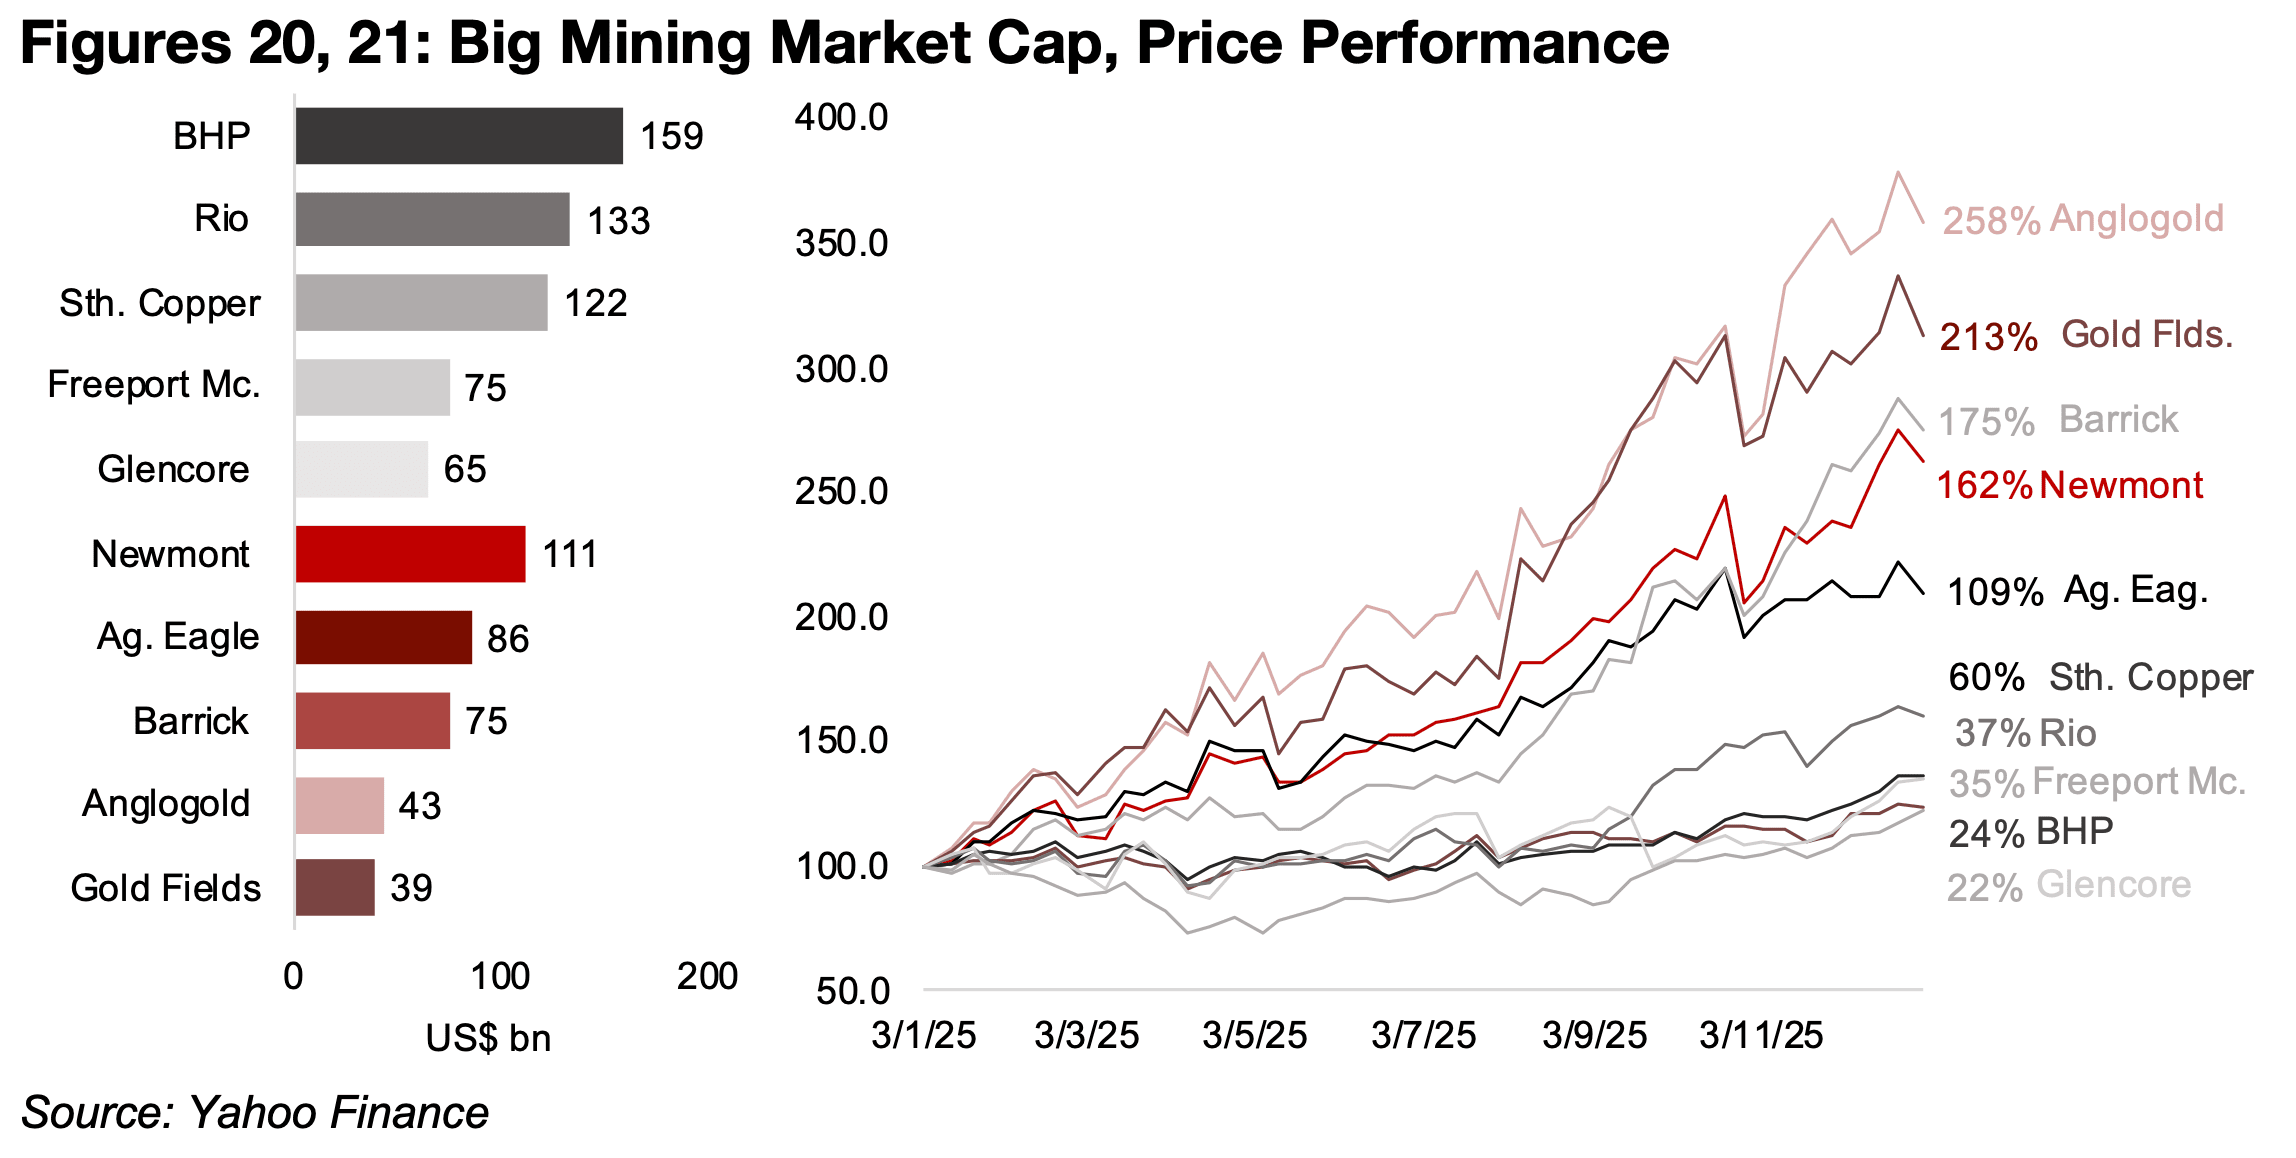
The base metals companies producing mainly copper outperformed, with Southern
Copper up 60% and Freeport McMoran gaining 35%. For the base metals companies
focussed on iron ore, Rio Tinto, which also has a large copper and aluminum
contribution, rose 37%, and BHP, with major copper and coal segments, rose 24%.
Glencore, which produces copper but could be considered more of an energy
company as coal, oil and gas production are over half of revenue, rose 22%.
The market expects the strongest upside to target prices of the base metals stocks
for Glencore, at 16.9%, but this could be based on an energy price rebound (Figure
22). There is downside to the targets of the other major base metals stocks, with Rio
and Freeport slightly above their targets, but a significant decline to the targets of
both BHP and Southern Copper. For Rio Tinto and BHP this is likely on expectations
of a weakening iron ore price, while for Freeport McMoran and Southern Copper, this
may be more based on valuations, with both having reasonably high multiples.
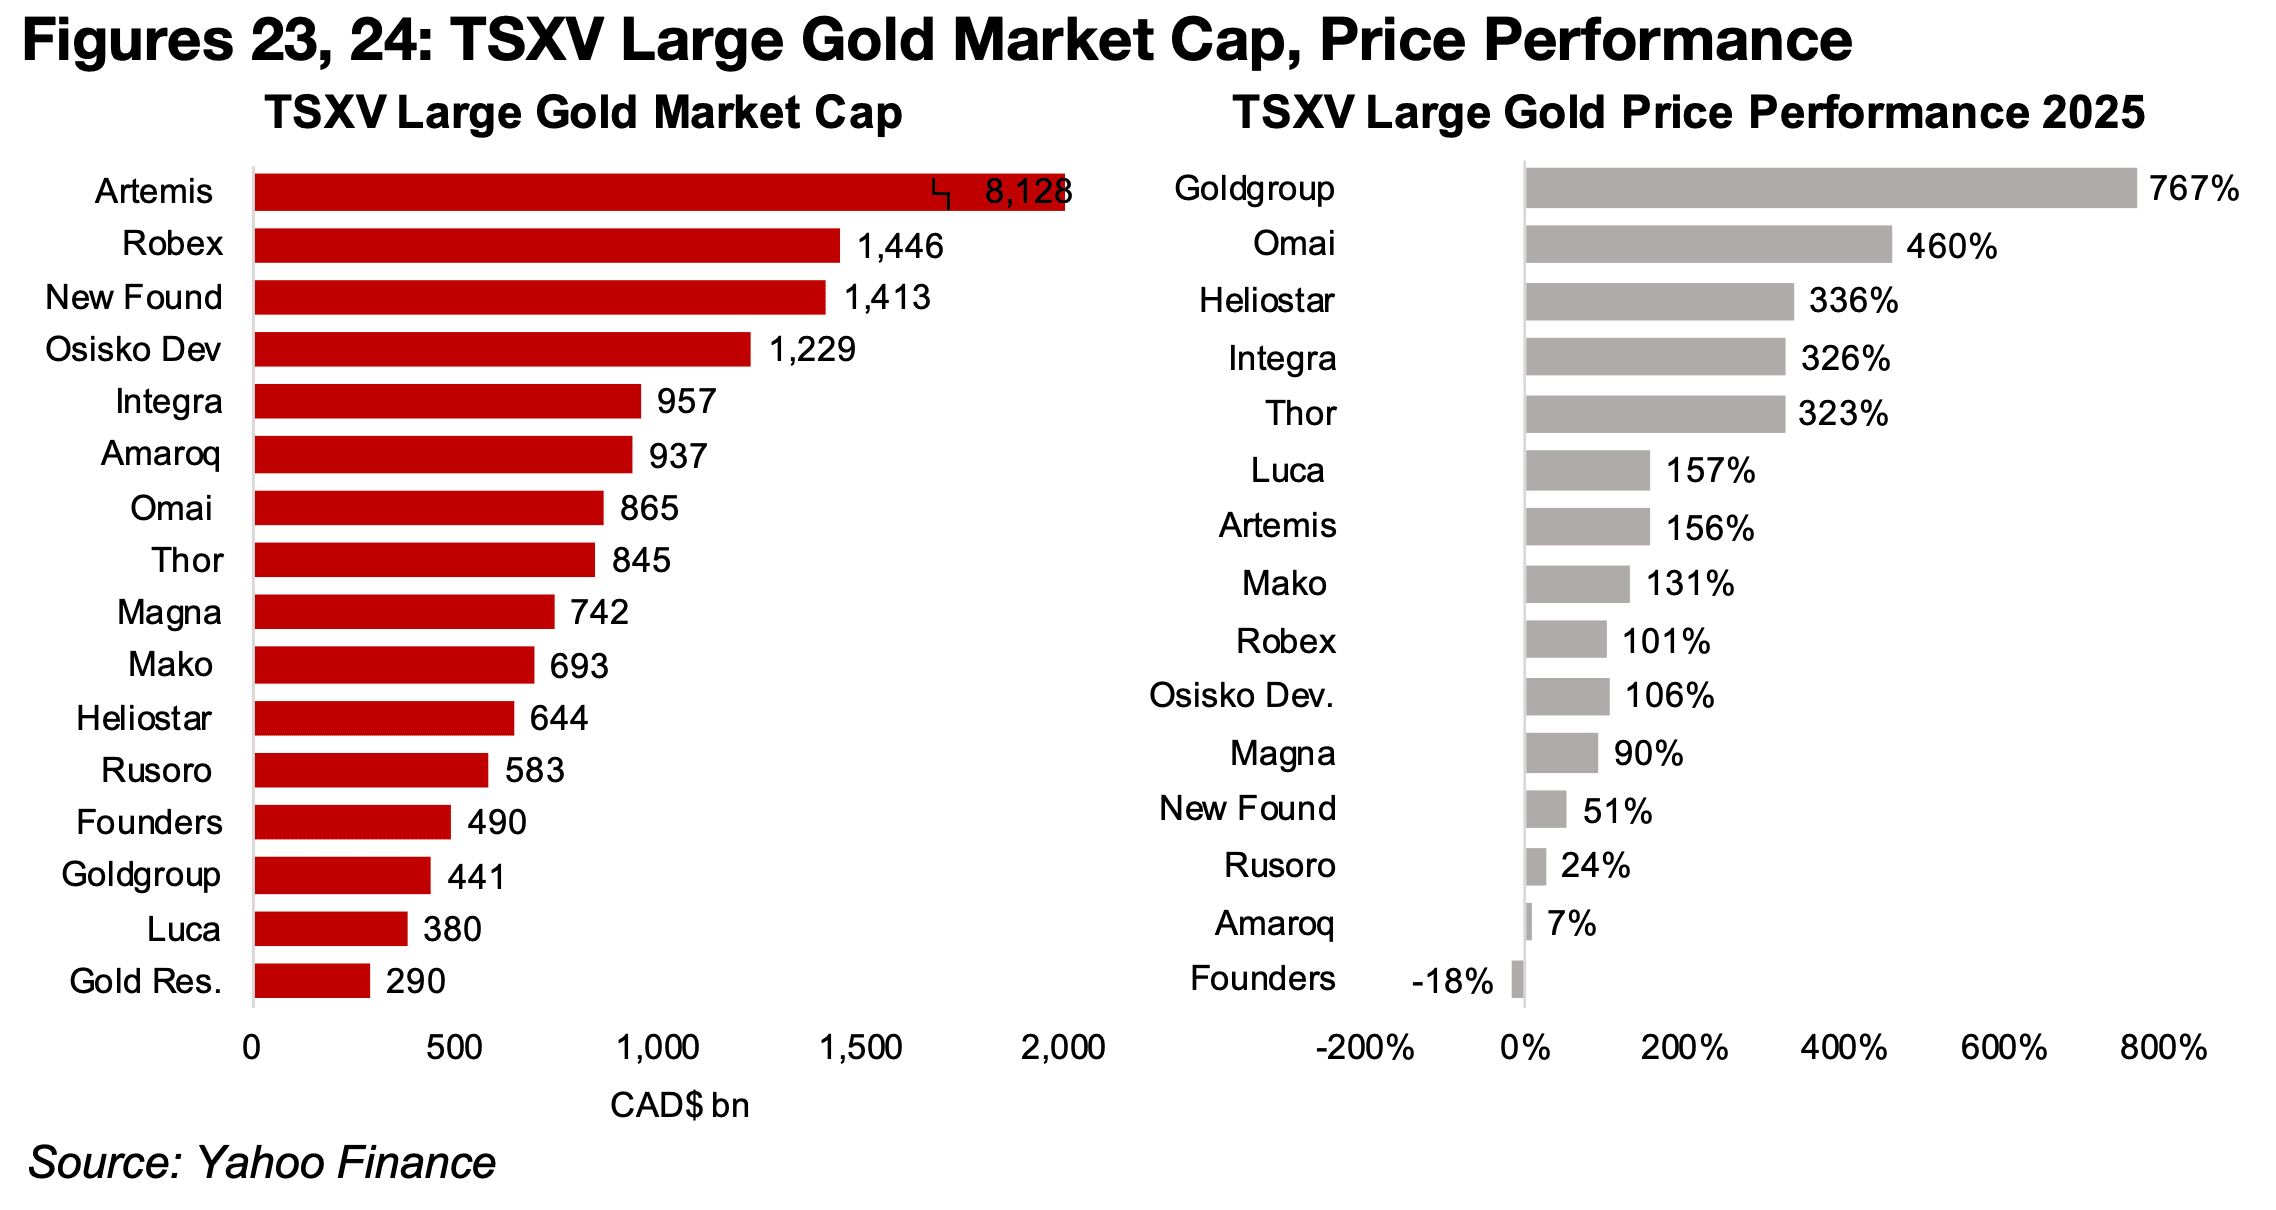
The TSXV had a huge year, with almost all the large gold and base metals stocks
seeing significant gains. The gold sector saw the strongest increases, with Goldgroup
up over seven times, Omai more than quadrupling, Heliostar, Integra and Thor up
over 300%, and Luca, Artemis, Mako, Robex and Osisko Development rising more
than 100% (Figures 23, 24). Even ‘underperformers’ Magna, New Found Gold and
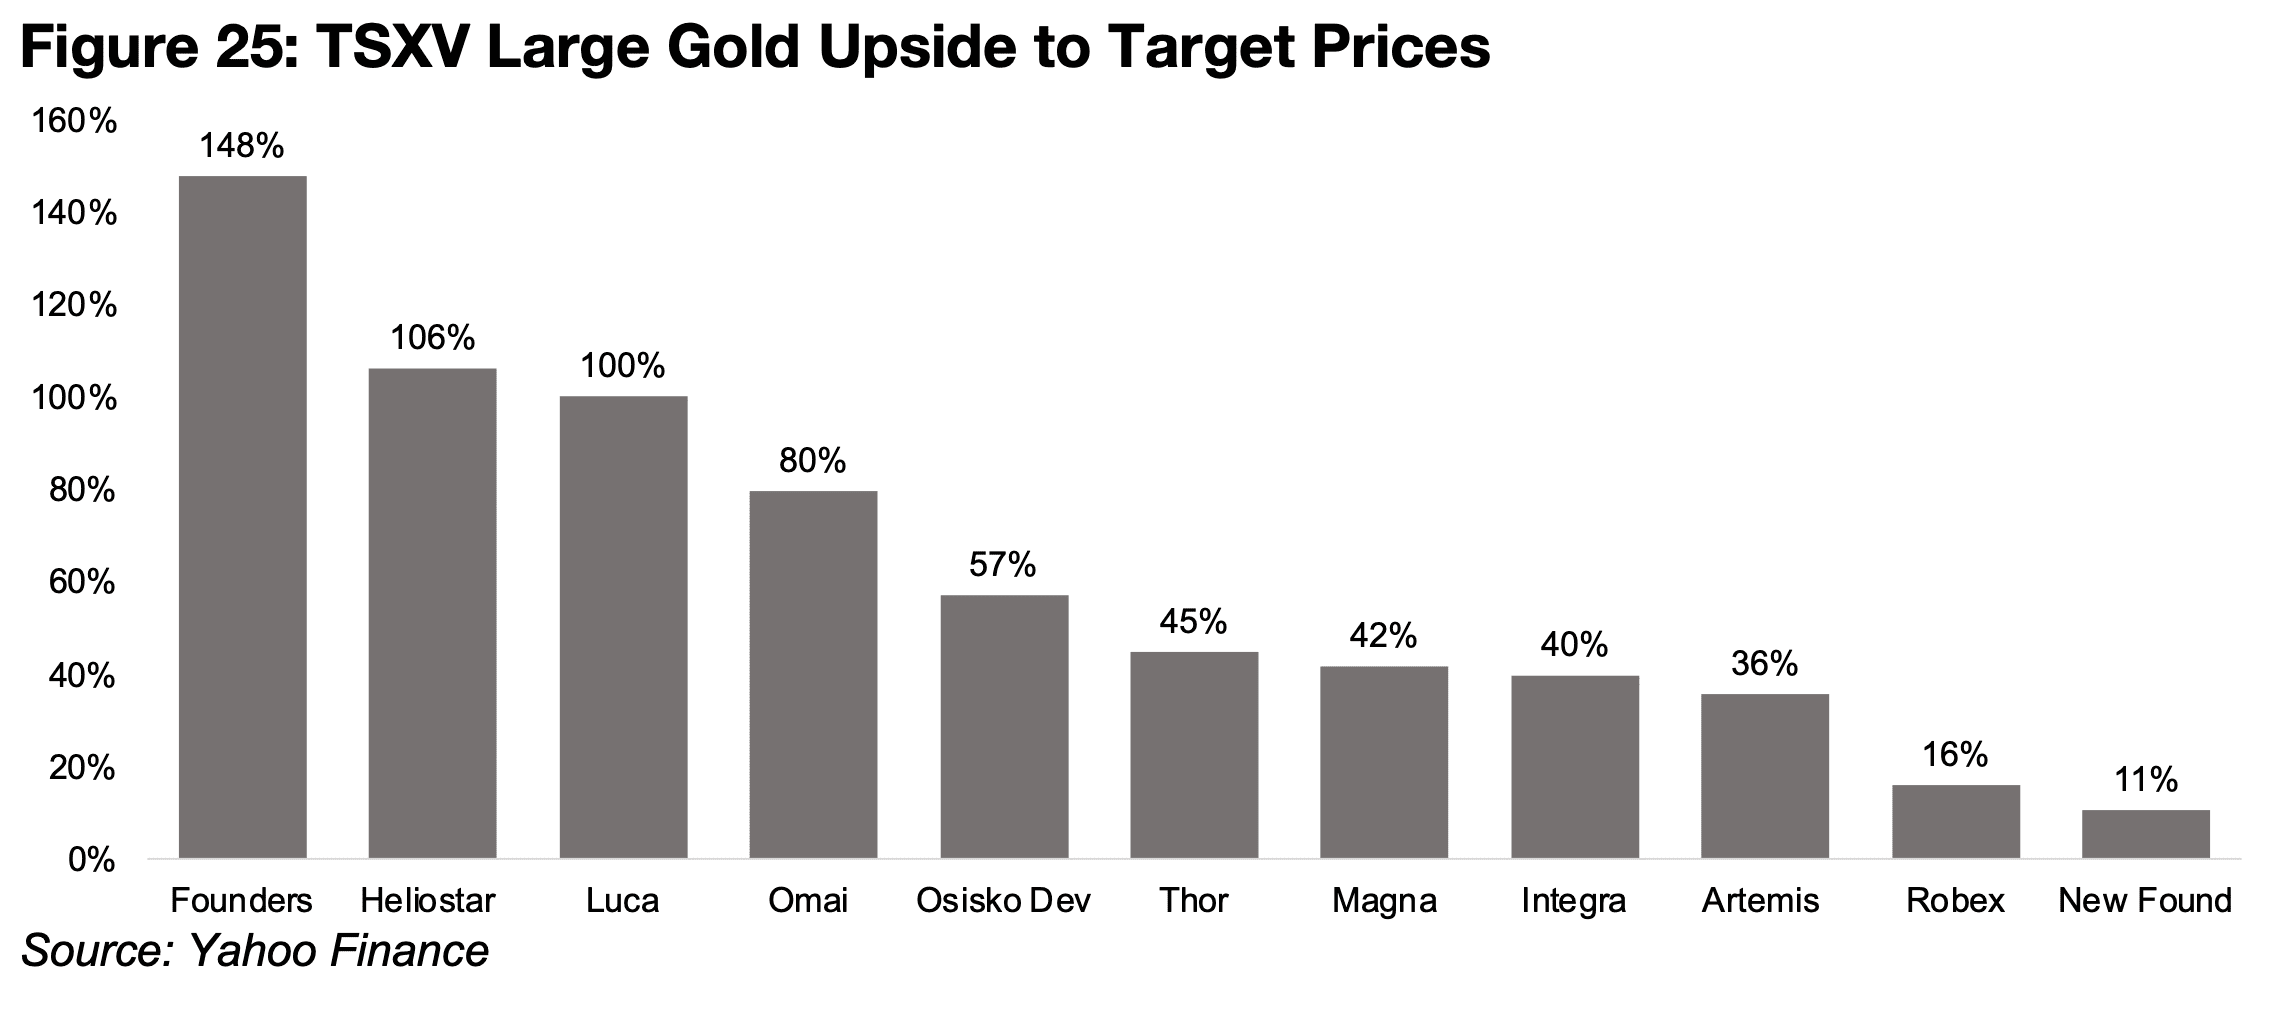
Rusoro jumped about 90% and 50%, while Amaroq gained 7%. Only Founders
declined, by 18%, although it actually has the upside to its target at 150%, and
market sees between 80% to over 100% upside for three stocks, around 40% to 60%
for five more and around 10%-15% for the rest, with no consensus targets for some
(Figure 25).
While this has been driven by the rise in gold price, it is also from a change in the
composition of large TSXV gold towards lower risk companies mostly in production
or later stage development projects. Most of the group has either started production,
had strong increases in output, or significantly advanced major development projects
this year. The rising metals prices have made it much more attractive for the markets
to continue to financing these projects, although there are still signs of risk aversion
regarding companies in much earlier stages exploration.
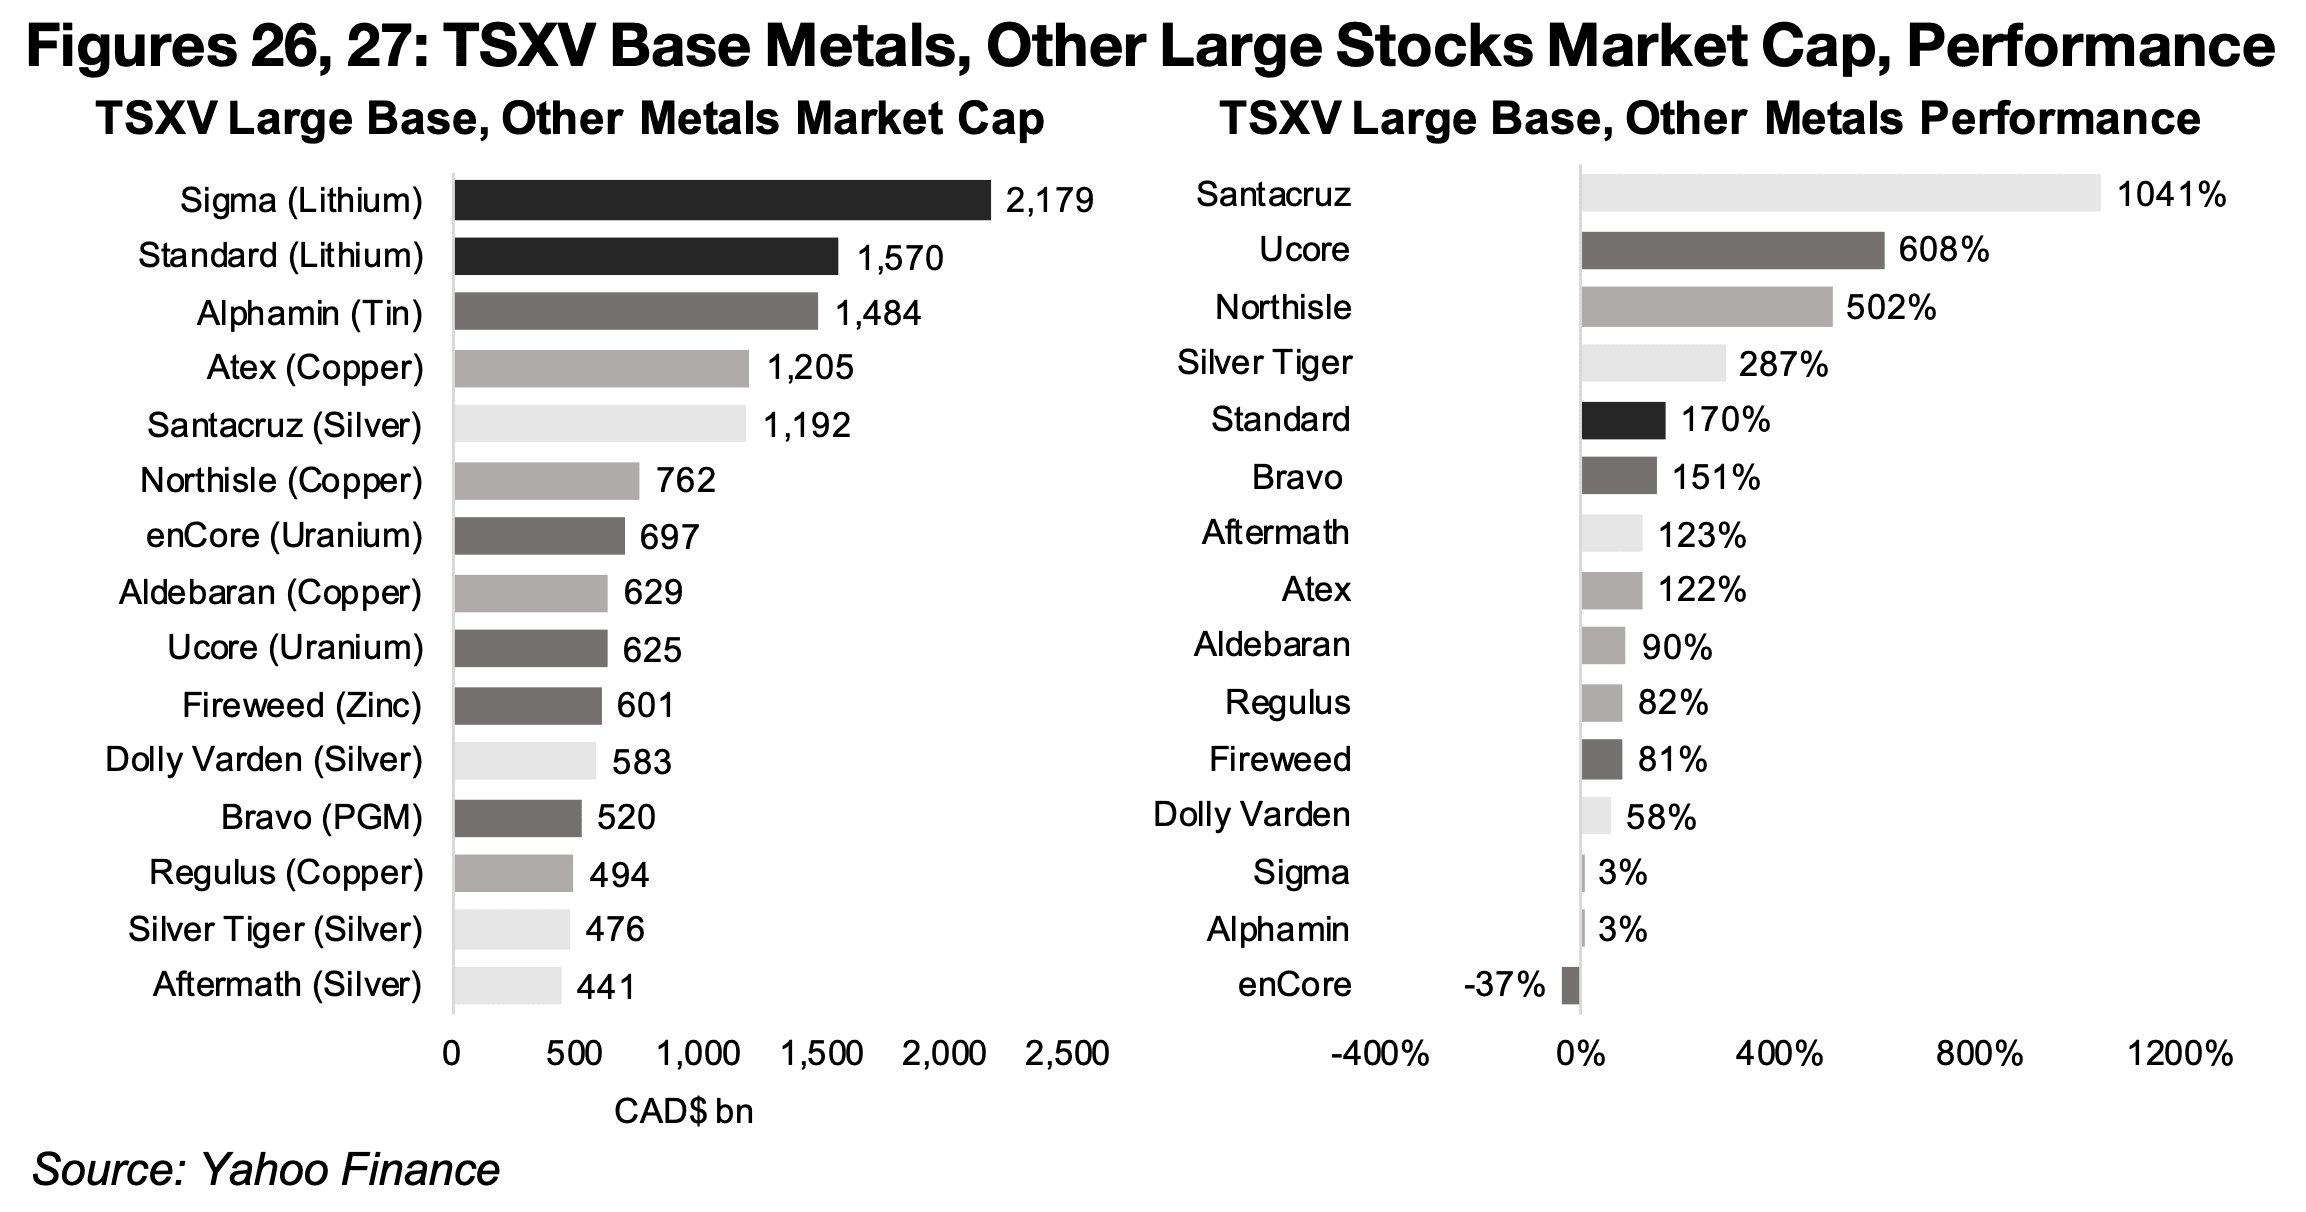
For the large TSXV base metals and other stocks, the silver and copper stocks saw
strong outperformances overall, but there were more significant splits for the lithium
and uranium sectors (Figures 26, 27). The surging silver price lifted all of the largest
silver stocks, including the largest gain of the group by Santacruz, up 1041%, with
Silver Tiger, Aftermath, Dolly Varden and Cerro de Pasco up 287%, 123%, 58%, and
56% respectively. The copper stocks were all strong, with Northisle, Atex, Aldebaran,
and Regulus up 502%, 122%, 90% and 82%. The performance was split for the two
largest stocks, both lithium companies, with Sigma up just 3% by Standard gaining
170%. There was also a major difference between the uranium stocks, with Ucore up
60% by enCore down -37%. The remaining three are Alphamin, Fireweed and Bravo,
producing tin, zinc and PGM, respectively, with gains of 81%, 151%, and 3%.
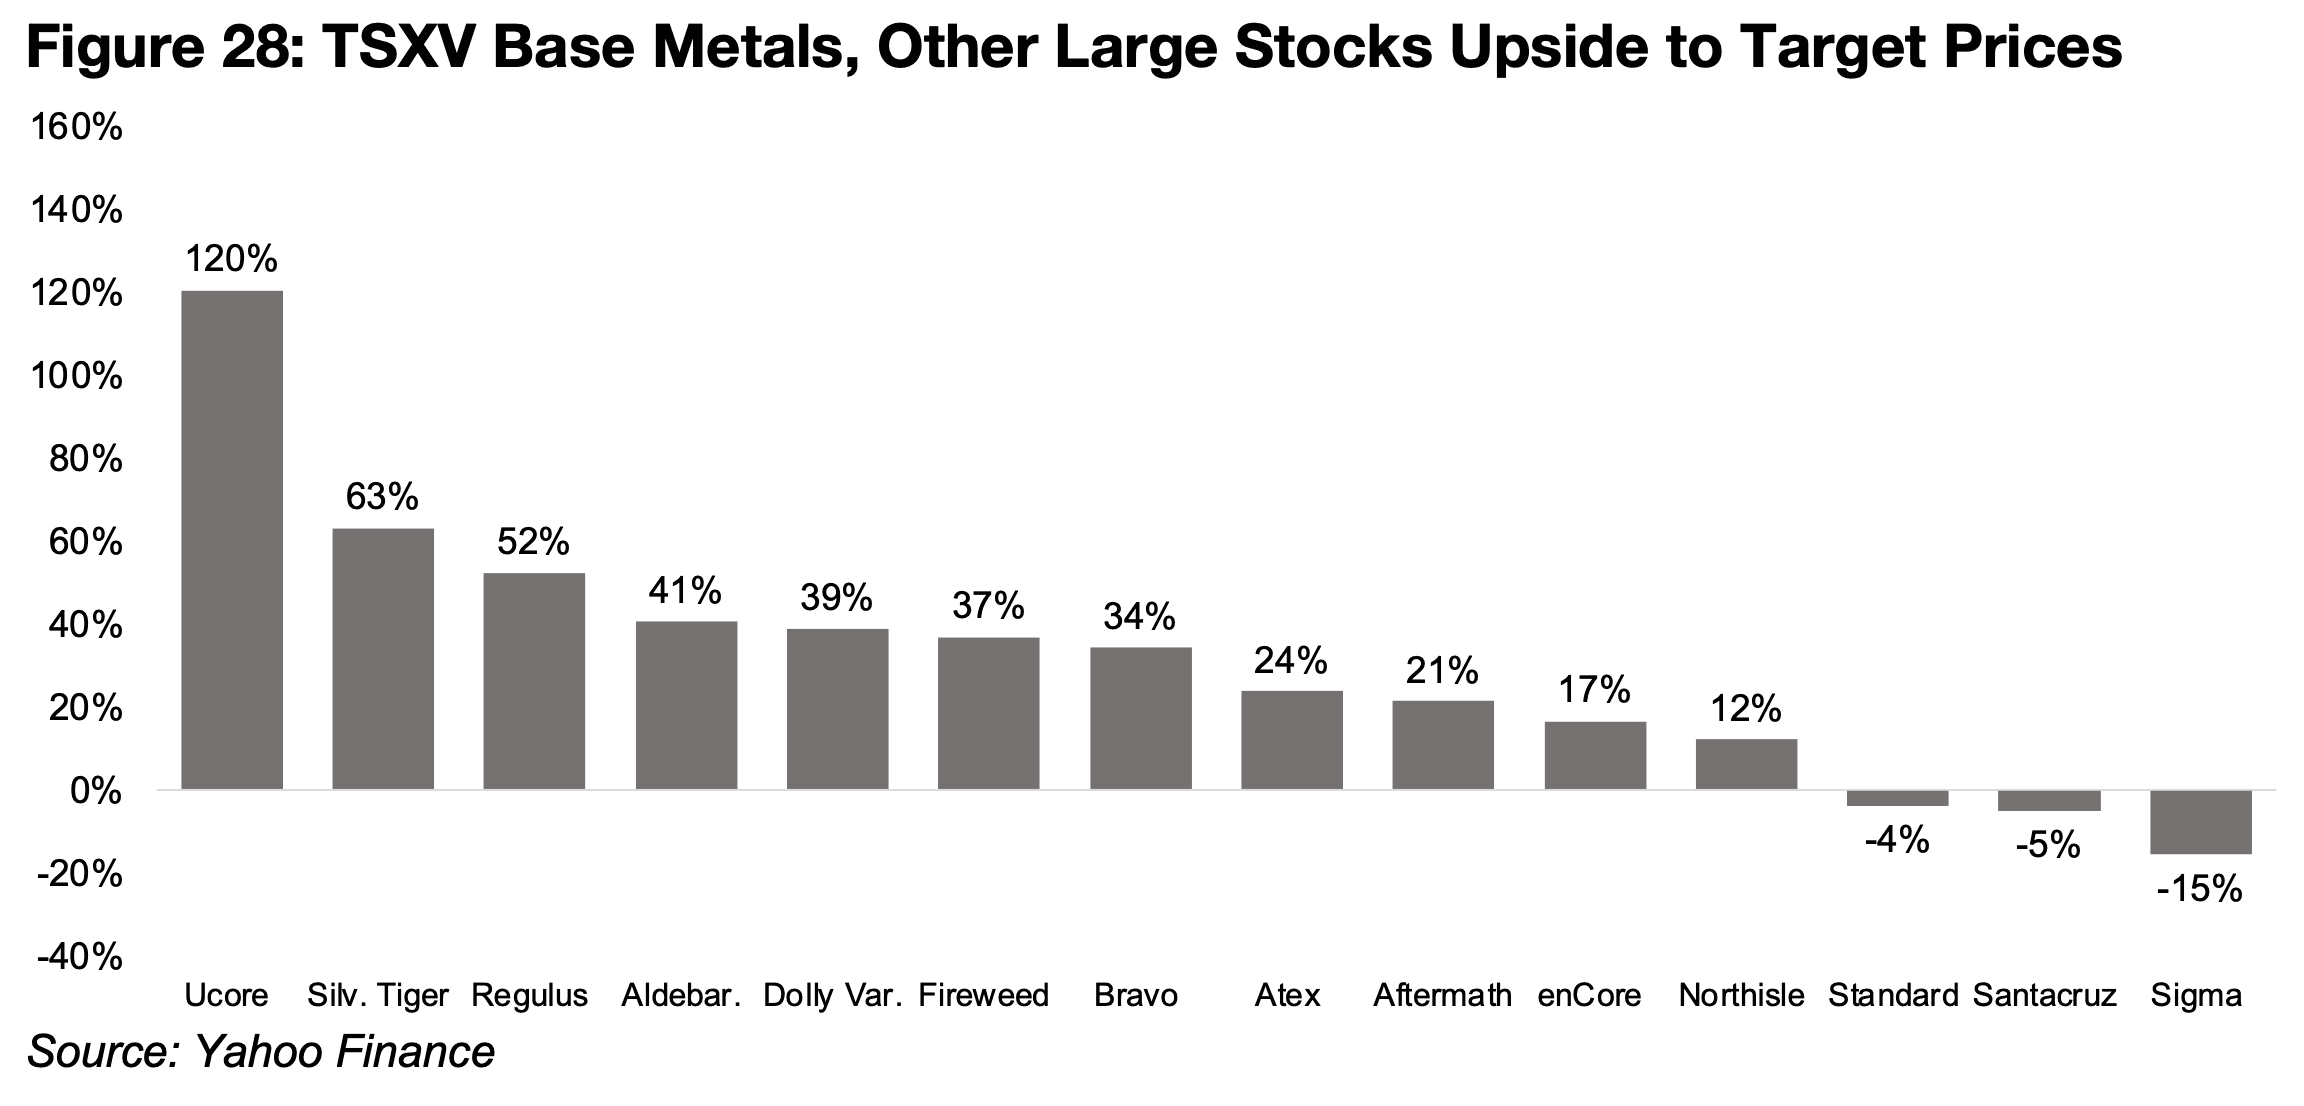
Most of the base metals and other stocks have substantial upside to their price
targets, with uranium company Ucore far ahead of the group at 120%, even after its
strong outperformance in 2025 (Figure 28). There is also relatively strong upside to
the targets of Silver Tiger and copper stock Regulus, at 63% and 52%, with four
companies with upsides ranging from around 30%-40% while another four have
upsides of between 12% to 24%. There is moderate downside only to the expected
targets of the two lithium companies, Standard and Sigma, even after more than a
tripling of the metal price this year, as it is still just at a quarter of its 2022 highs. While
there is also a -5% downside to target for Santacruz, this appears moderate in the
context of its huge rise over the past year.
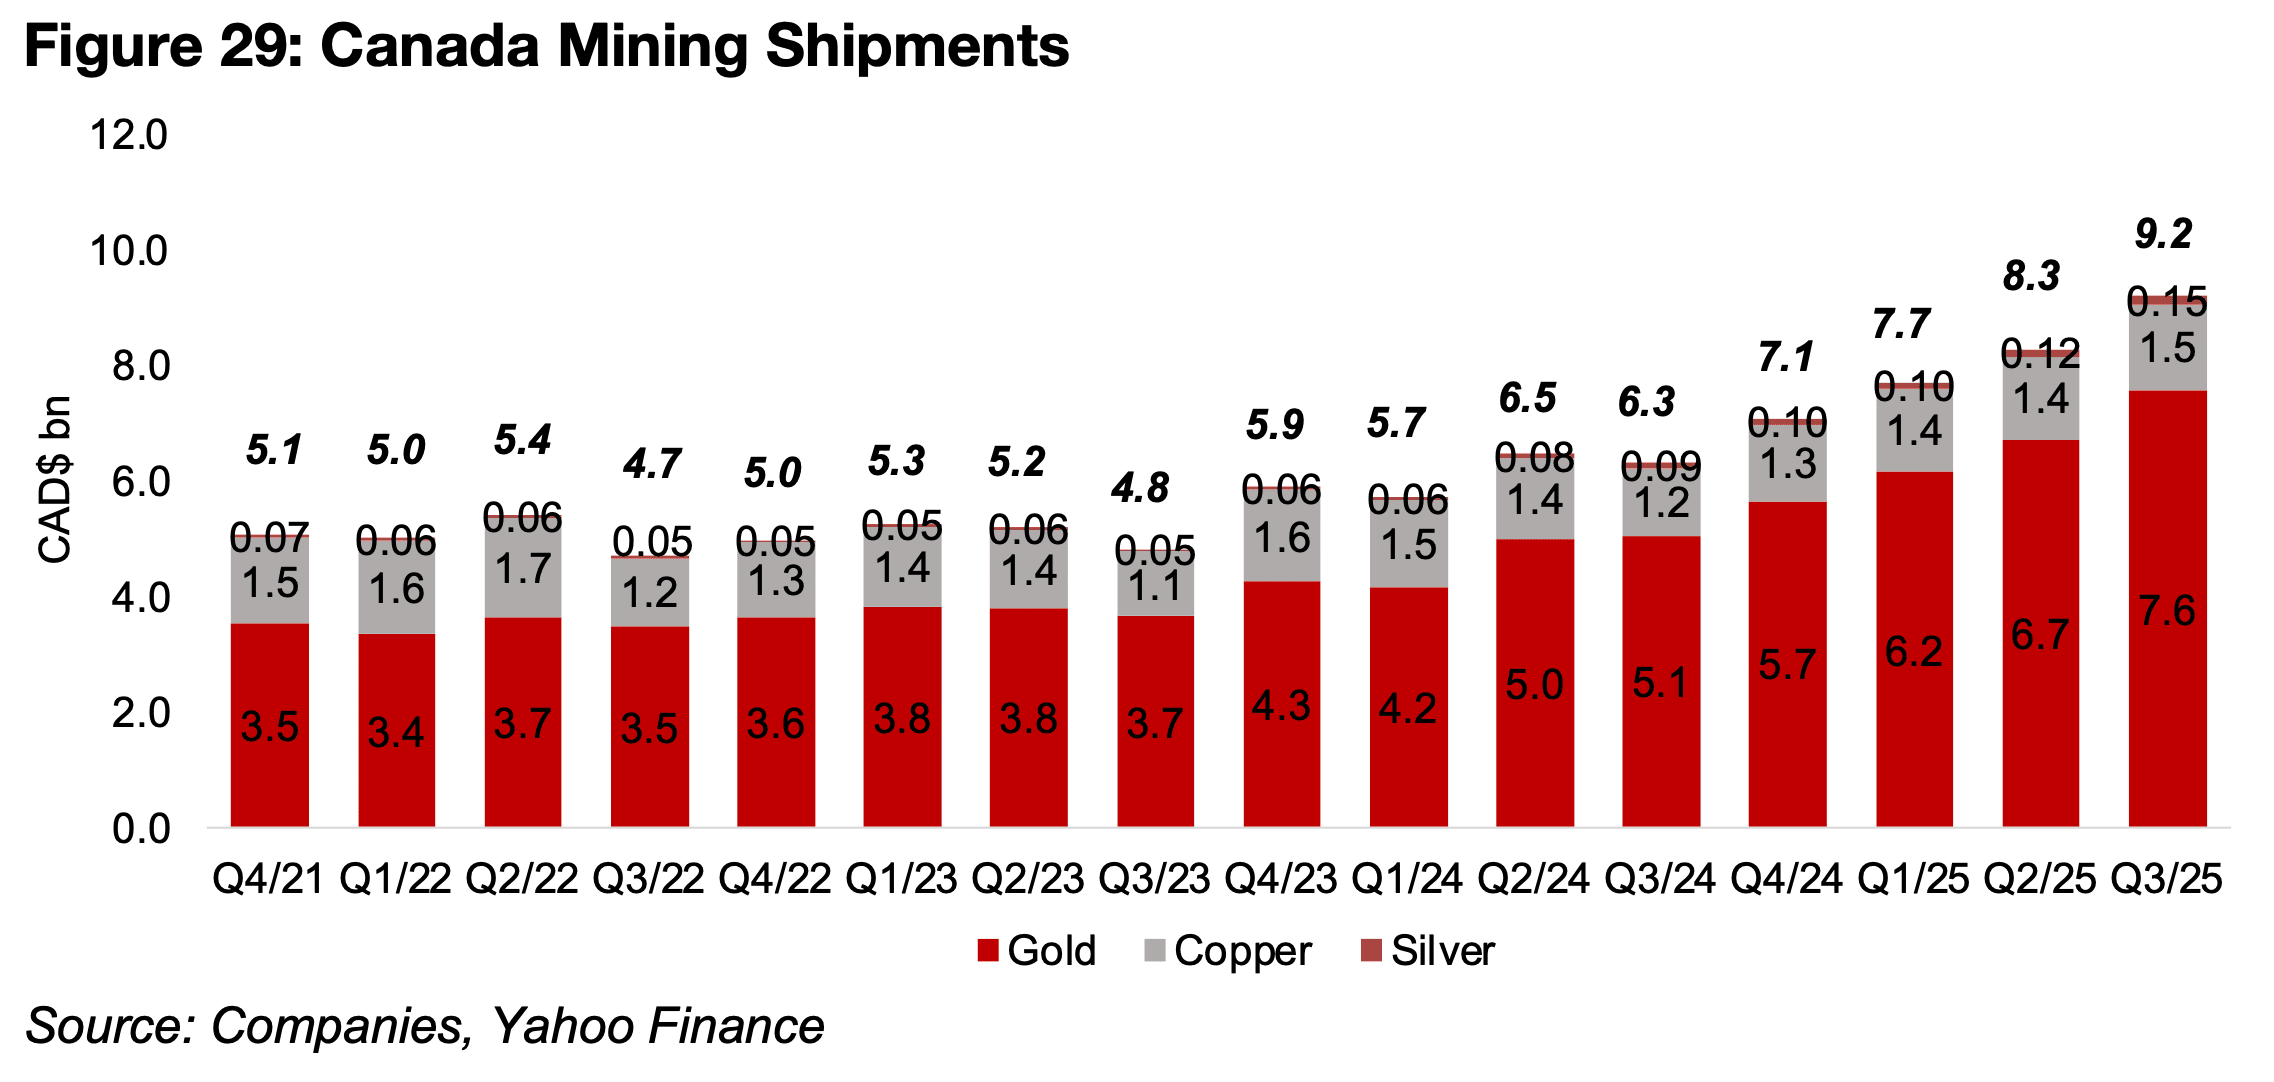
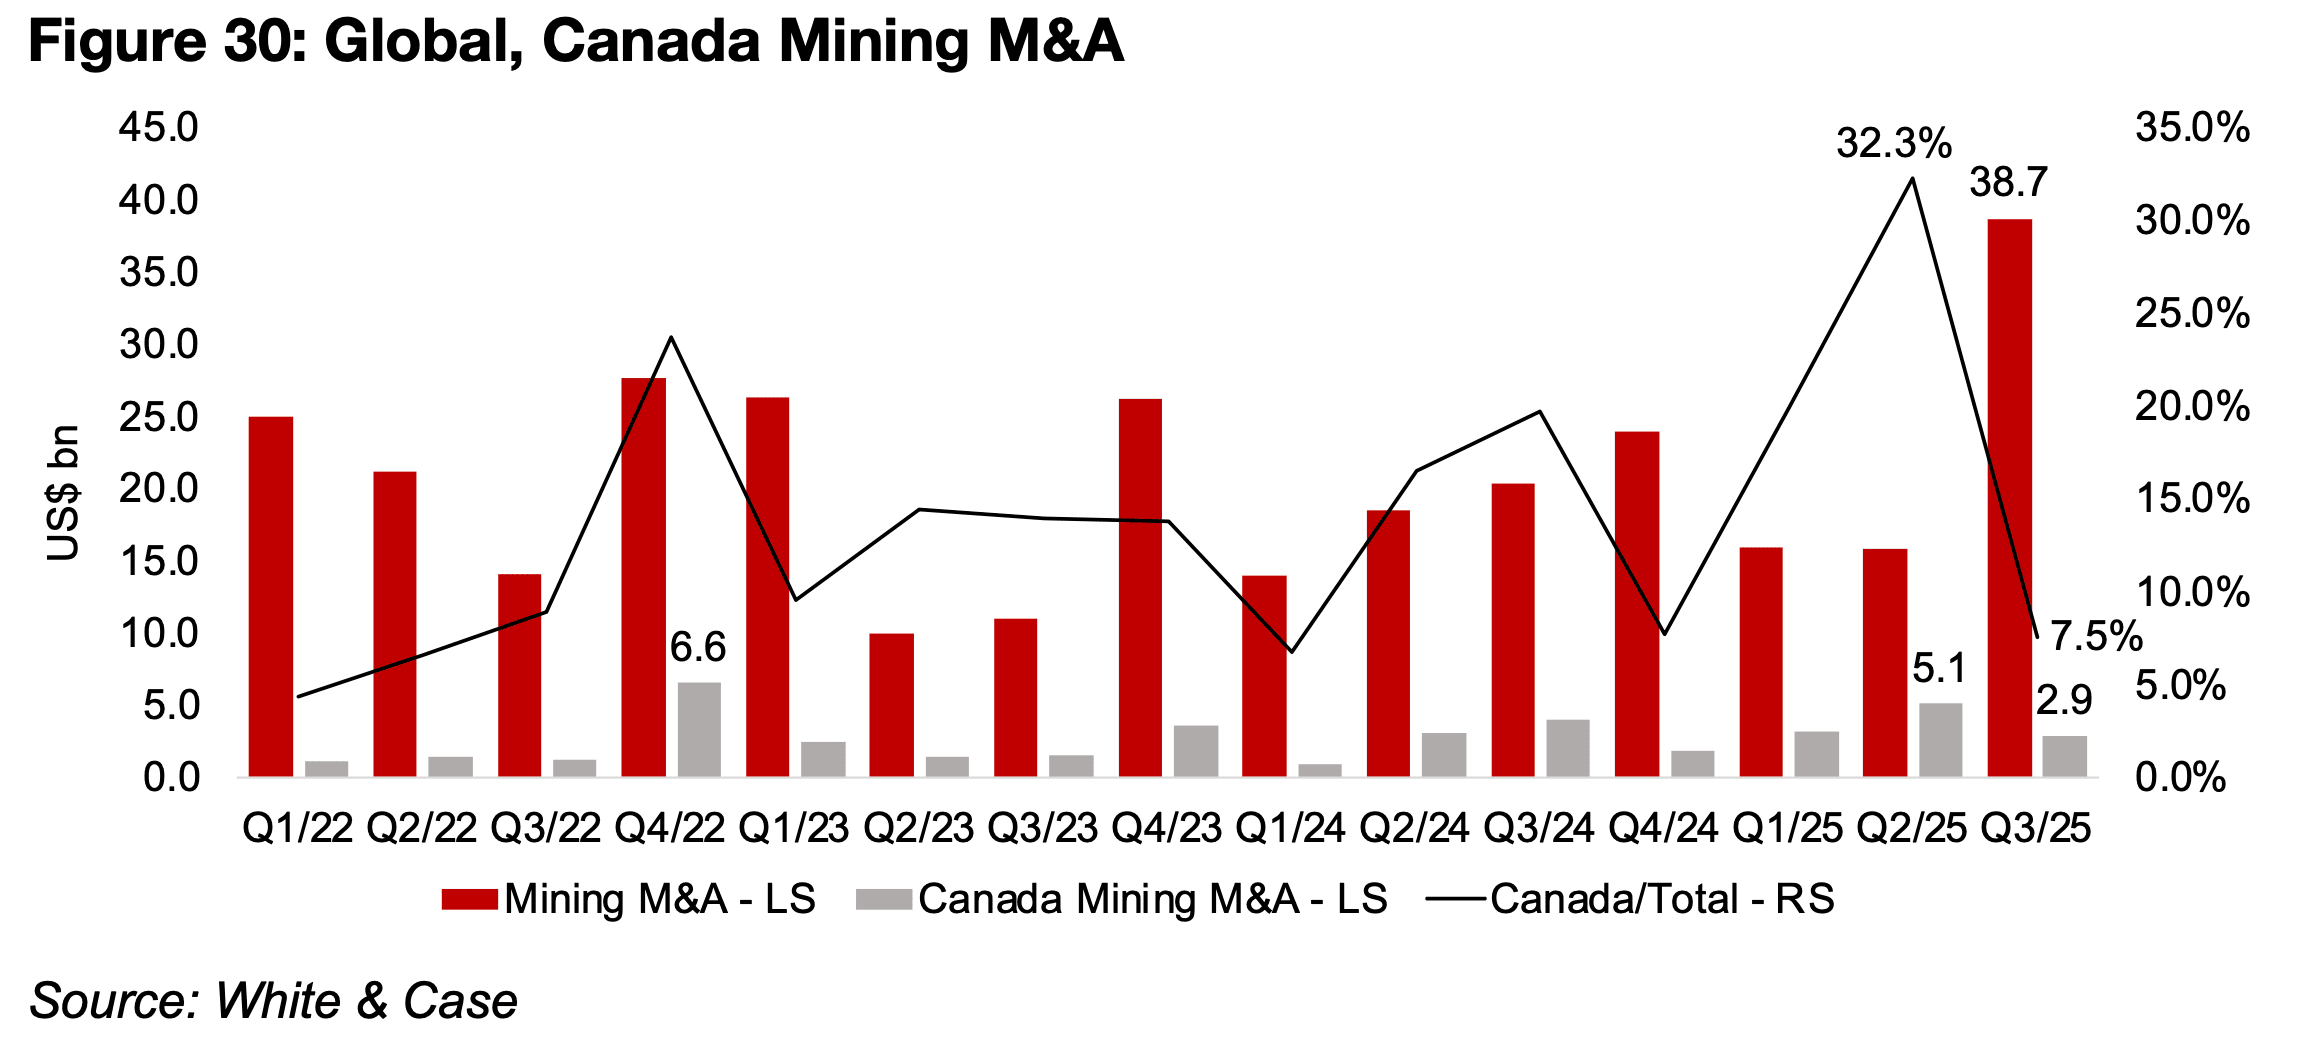
Last year saw reasonably strong Canadian mining investment, shipments and M&A. The combined equity capital raised on the TSX and TSXV averaged US$842mn monthly over 9M/25, a similar level to the US$868mn of 2024, and up substantially from US$636mn in 2022 and US$637mn in 2023 (Figure 28). The mining shipment value from the country also continued to rise, mainly from the increase in the gold price, which is over 80% of the value. The shipment value was CAD$9.2bn in Q3/25, up from CAD$7.1bn in Q4/24, nearly double the average of just above CAD$5.0bn in 2022 and 2023 (Figure 29). Canadian mining M&A was also strong this year, with bidding on deals at CAD$5.1bn in Q2/25, or 32.3% of global mining, by far the highest level of recent years (Figure 30). Global mining M&A overall hit a peak in Q3/25 at CAD$38.7bn, far above the peak in recent years of around US$25bn-US$30bn.
There appears to be sufficient drivers for gold price gains in 2026 on a major ongoing monetary expansion and still high geopolitical risk. While another 60% rise like that of 2025 may not recur, many investment banks now target US$5,000/oz or higher for 2026, indicating well over 10% gains. There could be higher risk for the precious metals, especially silver, but also platinum and palladium, if short-term extreme supply deficits and likely high current speculative positions subside.
The outlook for the base metals is still opaque as it is unclear whether there will be an inflationary economic expansion, which could drive up the metals prices, stagflation, where the performance will depend on whether the inflation effect dominates and drives up commodities, or low growth curbs demand for the metals, or even a deflationary decline in growth, with the overall risk likely higher than for gold.
While continued gains in the gold price could propel stocks in the sector, valuations are no longer clearly inexpensive and have become elevated for silver stocks. While the valuations for the base and other metals stocks are moderate, they face more risks from economic growth shocks than the monetary-driven metals, and there is a risk that inflation drives up costs for the mining sector. Market valuations overall are also high, and while this is mainly because of tech, a collapse in that sector could still drive fallout for other sectors, with it a key source of demand for many metals.
Disclaimer: This report is for informational use only and should not be used an alternative to the financial and legal advice of a qualified professional in business planning and investment. We do not represent that forecasts in this report will lead to a specific outcome or result, and are not liable in the event of any business action taken in whole or in part as a result of the contents of this report.
Author
Ben McGregor authors the Weekly Roundup at CanadianMiningReport.com, providing sharp analysis of the metals and mining sector. With a talent for spotting trends, Ben distills complex market shifts into clear, engaging insights on TSXV junior miners. His weekly updates cover gold, copper, uranium, and more, blending data-driven perspectives with a knack for identifying opportunities. A vital resource for investors, Ben’s work navigates the dynamic junior mining landscape with precision.