
June 26, 2023
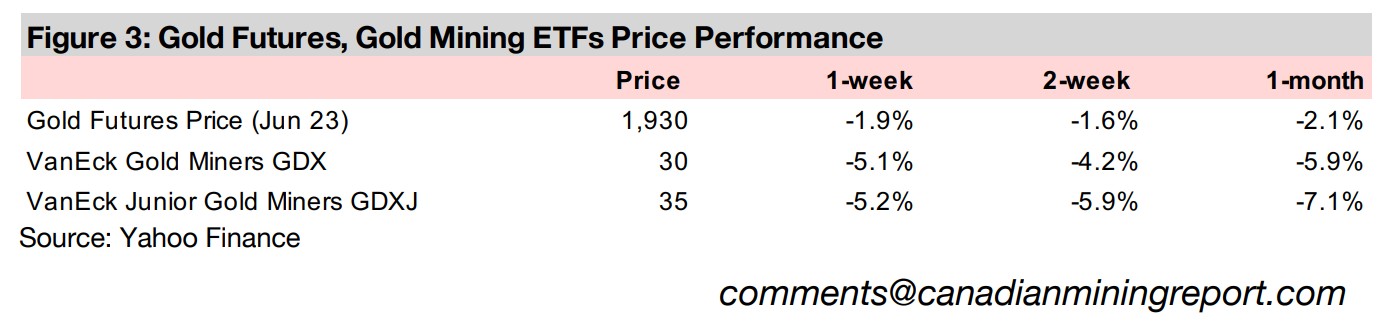
Gold declined -1.9% to US$1,930/oz, pulling back after three weeks of gains to its lowest level since March 2023, likely on drivers like less negative real yields as central banks continue to hike, and a rising dollar, even as Russia spiked geopolitical risk.
This week we look at data comparing the TSXV mining sector to the overall TSXV index, showing that it has increasingly gained share of the market cap and equity capital raised since 2021, with investors seeing safety there versus other sectors.
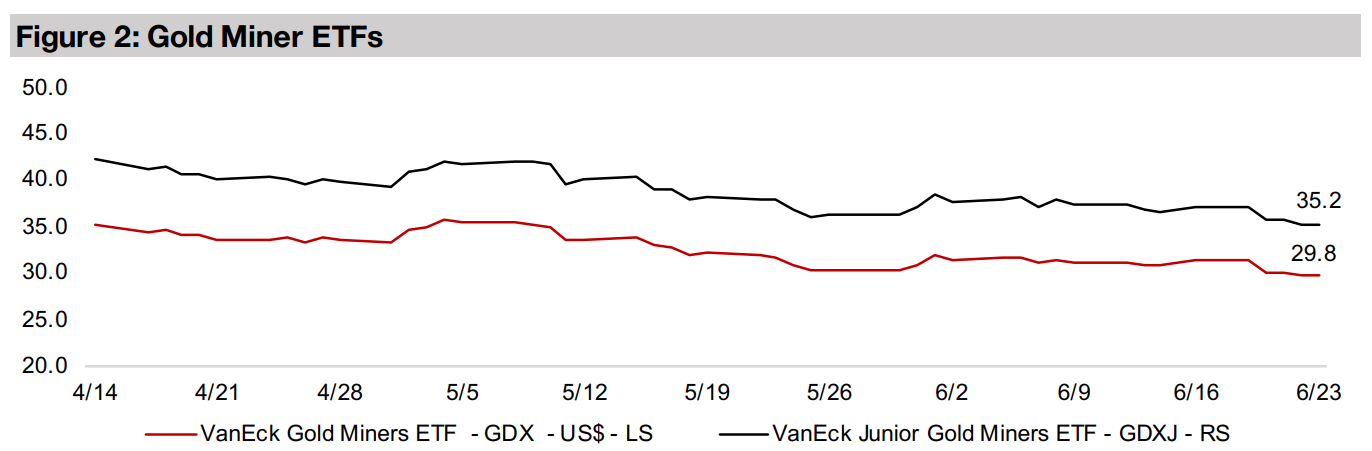
The gold producers and juniors were down as gold declined, with the GDX dropping -5.1% and the GDXJ off -5.2%, and the large TSXV gold juniors mainly fell as the market seemed to focus on the effects of a rising US$ and real rates on the gold price.


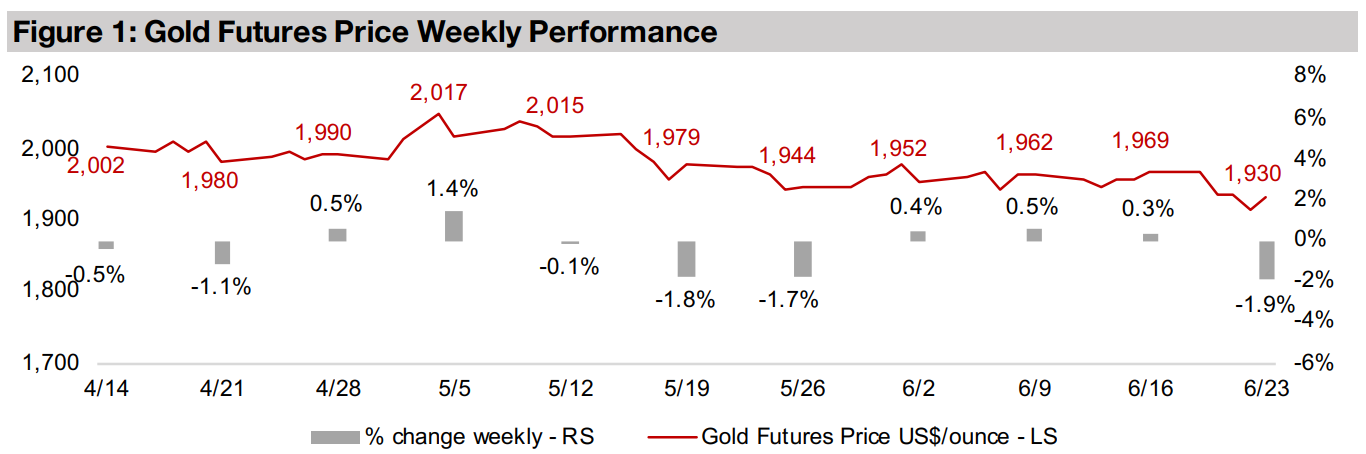
Gold dropped -1.9% to US$1,930/oz and the equity markets fell as the market
seemed to finally be starting to price in just how aggressive central banks have
become on rate hikes, especially after the 'hawkish pause' by the Fed and the rate
hike by the ECB in the previous week. Two major European central banks which are
not part of the European Union, England and Norway, also both shocked markets this
week with 50 bps rate hikes instead of 25 bps. This follows another unexpected 25
bps hike by the Bank of Canada after a pause in rates earlier this month. The central
banks remain aggressive because while headline inflation has declined especially
from falling energy costs, core inflation has generally remained stubborn.
We might have expected gold to actually rise on the news of these continued rate
hikes, with the market focusing on their probability to eventually drive a severe
economic slowdown. However, as nothing has really 'broken' economically for the
past three months since the banking crisis, the market seems more focussed on the
immediate fundamentals, including less negative real rates, and a rising US$, rather
than the potential for longer-term negative fallout. Continued rate hikes and subsiding
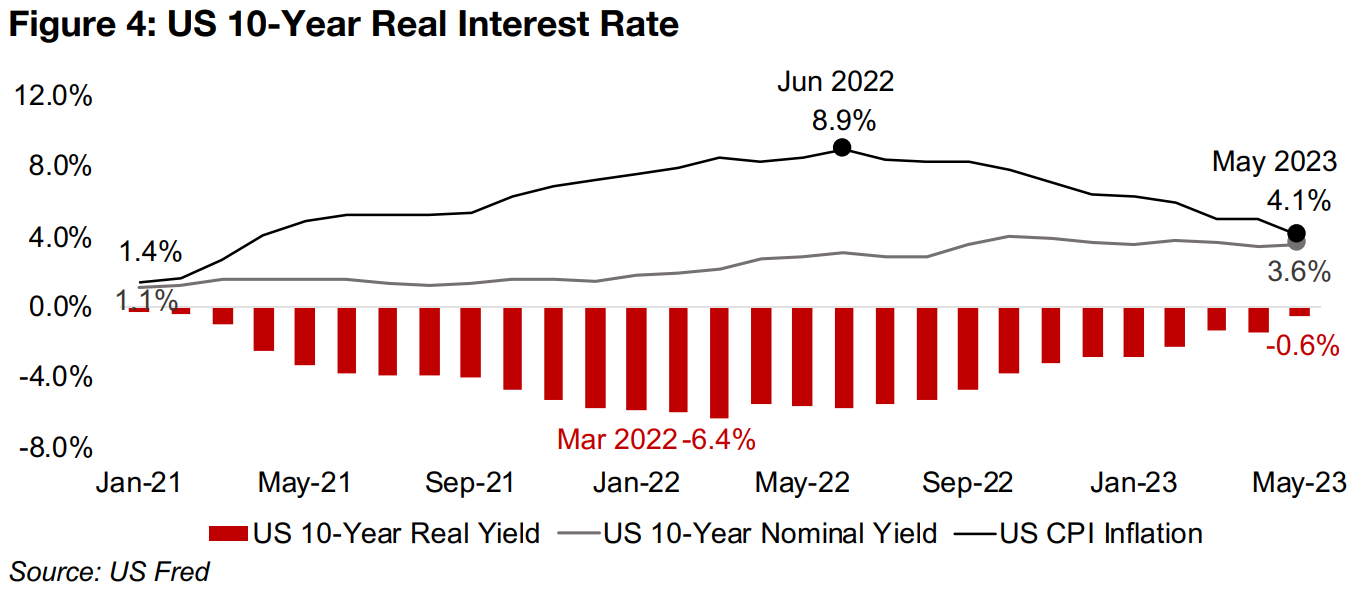
overall inflation have almost driven up US 10-year real yields out of negative territory,
to -0.6% in May 2023 up from lows of -6.4% in March 2022, with the nominal 10-
year yield at 3.6% and total inflation at 4.1% (Figure 4).
While obviously not overwhelming attractive in terms of absolute yield, the returns on
US bonds are certainly more compelling than they were a year ago. If the Fed
continues to hike and overall inflation continues to fall, US real yields could potentially
draw some investors away from gold, which is yieldless and incurs storage costs
around 1.0%-2.0%. A rebound in the US$ Index off April 2023 lows has also put
some pressure on the gold price, with the two tending to move inversely.
The focus on these fundamental issues may continue until something economically 'breaks' again and drives another flight to safety in gold. While there were some signs that high rates were starting to bite this week in weak economic data out of Europe, including lower than expected Purchasing Manager Index numbers, it was nothing catastrophic. There was also a spike in geopolitical risk this week with a key paramilitary group in Russia turning briefly against the government, although this seems to have been resolved for now. Gold rose only moderately on this, suggesting that the much of the Russia-Ukraine conflict has already been priced in, and that it might take a wider contagion to see geopolitical issues drive a spike in gold.
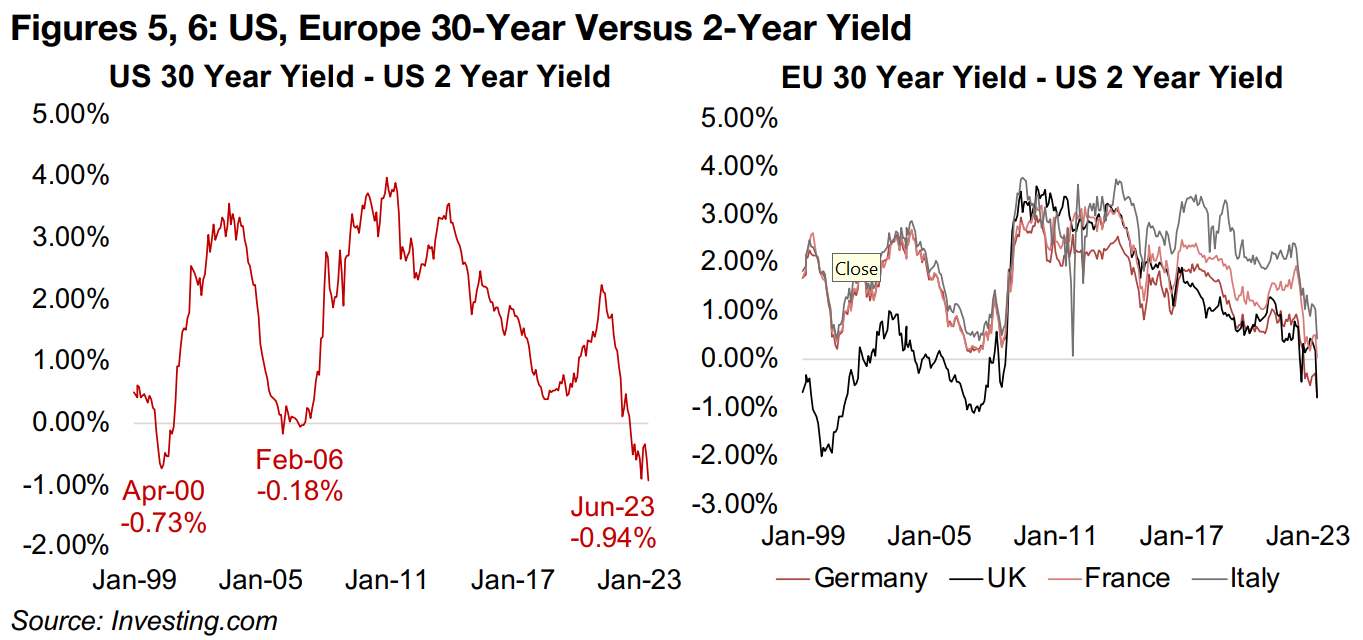
One major indicator for markets looking to estimate the probability of adverse
economic outcomes is slope of the yield curve, which plots bond yields of increasing
maturities. Usually the yield curve is upward sloping, with a risk premium built into
later maturity bonds given their increased risk over time of returning their expected
cash flows, with the 30-year yield, for example, well above the 2-year yield. A
downward sloping yield curve is relatively rare and often viewed as a sign of potential
recession, having 'inverted,' with the 30-year yield below the 2-year yield.
Currently, not only has the yield curve inverted, but it has become its most inverted
in twenty years, with the US 2-year minus 30-year bond at -0.94%, well below
previous lows of -0.18% in February 2006, prior to the global financial crisis of 2008-
2009, and -0.73% in April 2000 as the dot.com bust was unfolding (Figure 5). Yield
curves in the largest economies in Europe, Germany and the UK are both now
inverted, France is near flat and Italy is trending towards to zero. Overall, the US and
European yield curves seem to be signalling difficult economic times ahead.
Even with gold under some pressure recently, it is still the best performer of the largest four metals markets, with the other three all base metals, aluminum, copper and iron ore. Gold has risen 7% since January 2022, while the other three metals have faced major downtrends, with iron ore is declining -11%, copper -14% and aluminum -25% (Figure 7). This year has been better for the base metals, although gold still leads, up 5%, versus nearly flat iron ore and copper, with moves of 1% and 0%, respectively, while aluminum has continued to weaken, down -9%.
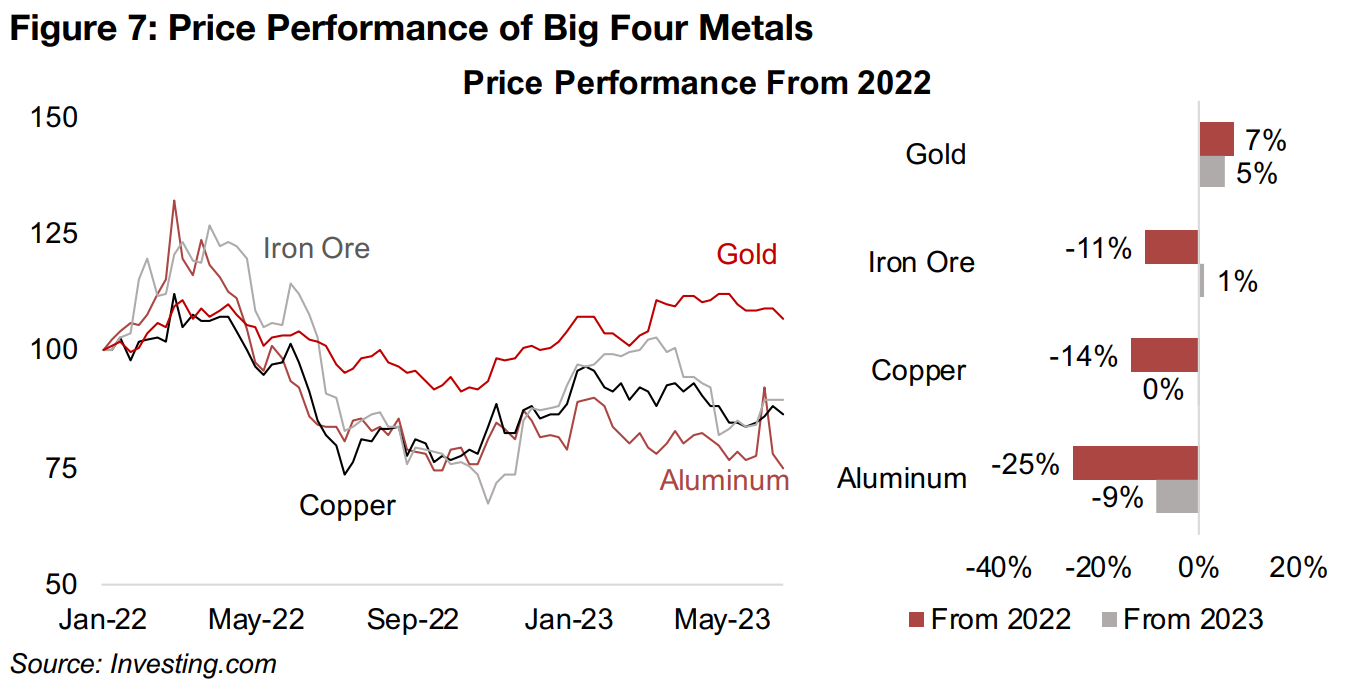
Copper is often considered reflective of especially the economic demand in
developed countries, given their advanced level of industrialization and the heavy use
of copper in these systems. The decline in copper in 2022 reflects the significant
economic cooldown in 2022 after the post-global-health-crisis surge in 2021, while
the flat performance in 2023 indicates that an inflection point has been reached,
where markets seem unclear on the direction. Iron ore is viewed as more a proxy for
economic growth in China, which comprises about half of global demand for the
metal. Iron ore is in a similar situation to copper, with a slowdown in 2022, but a nearly
flat performance in 2023, suggesting that in China also, the situation remains opaque.
Aluminum is seen as an even broader indicator for global economic growth, and its
plunge by -25% in 2022 showed an easing in the world economy overall after the
2021 boom. It is also down -9% in 2023, which makes it the only big four metal to
see a substantial decline this year, hinting at growing weakness in the global economy.
However, the price has been affected by a considerable oversupply of aluminum from
Russia at the London Metals Exchange, and it may have had a performance closer to
the other big four base metals this year were it not for this factor.
Gold has outperformed these three major base metals as a very low proportion of its
demand comes from industrial uses. It more reflects the growth in the money supply,
changes in real interest rates and the US$, and wider economic and political risks.
There has been a dramatic increase in money supply over the past four years, and
economic and political risks clearly remained heightened, which has propelled gold.
While there has been a pullback in monetary liquidity from the rates hikes, US money
supply growth has only recently begun to actually contract, and the absolute money
stock is still huge compared to its pre-global health crisis levels
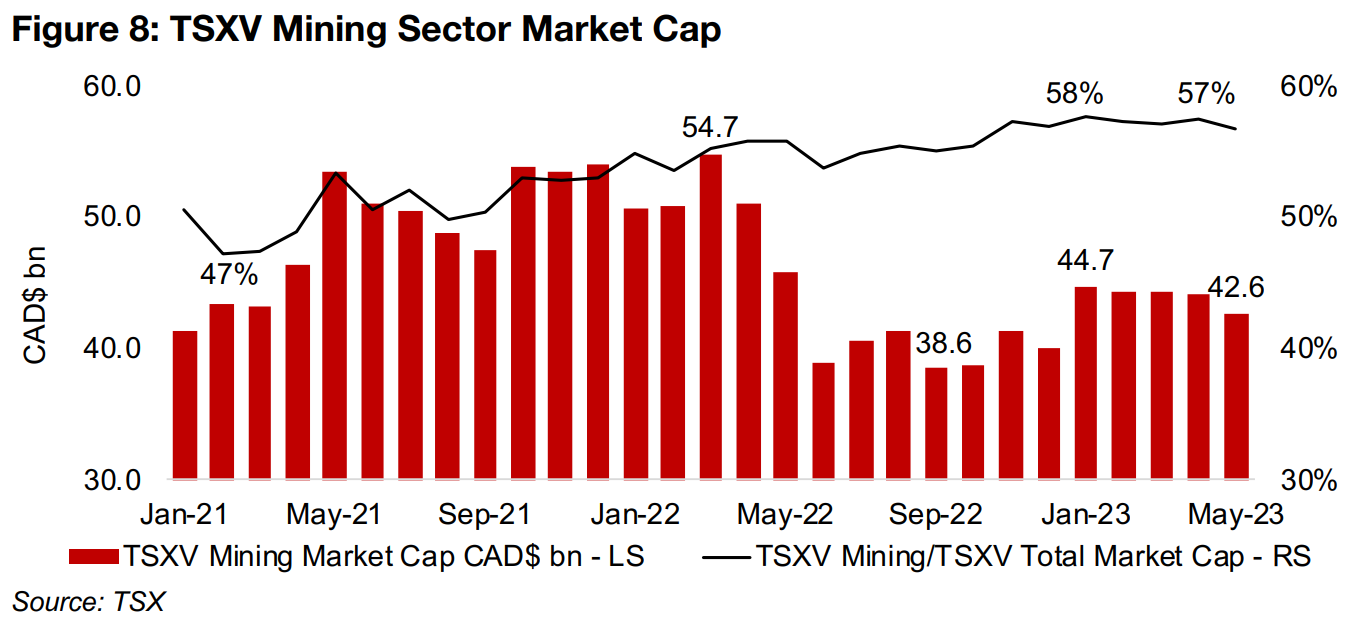
With a potential downshift from 'risk on' to 'risk off', and global small caps generally
under pressure since 20222, this week we look at the TSXV mining sector in the
context of the total TSXV Index to gauge investor sentiment on the sector. TSVX
statistics show that while the mining sector market cap and equity capital raised
declined considerably since 2021, the decline from 2022 has been moderate, and the
sector's share of both have risen considerably. This suggests that while TSXV mining
has not been immune from the global shift away from small caps, other small cap
sectors have been hit harder, and investors see relative safety in junior miners.
The TSXV mining sector's market cap has weakened substantially, down 22.1% from
a peak at CAD$54.7bn in March 2022 to CAD$42.6bn in May 2023, although it is up
from lows of CAD$38.6bn in September 2022 (Figure 8). However, the sector has had
a steadily increasing share of the total TSXV market cap, up from 47% in February
2021 to 57% as of May 2023. This shows that while the market may have sold off
some TSXV junior miners in 2022 relative to 2021, they have moved back into the
sector this year, and have been allocating a higher share to the sector since 2021.
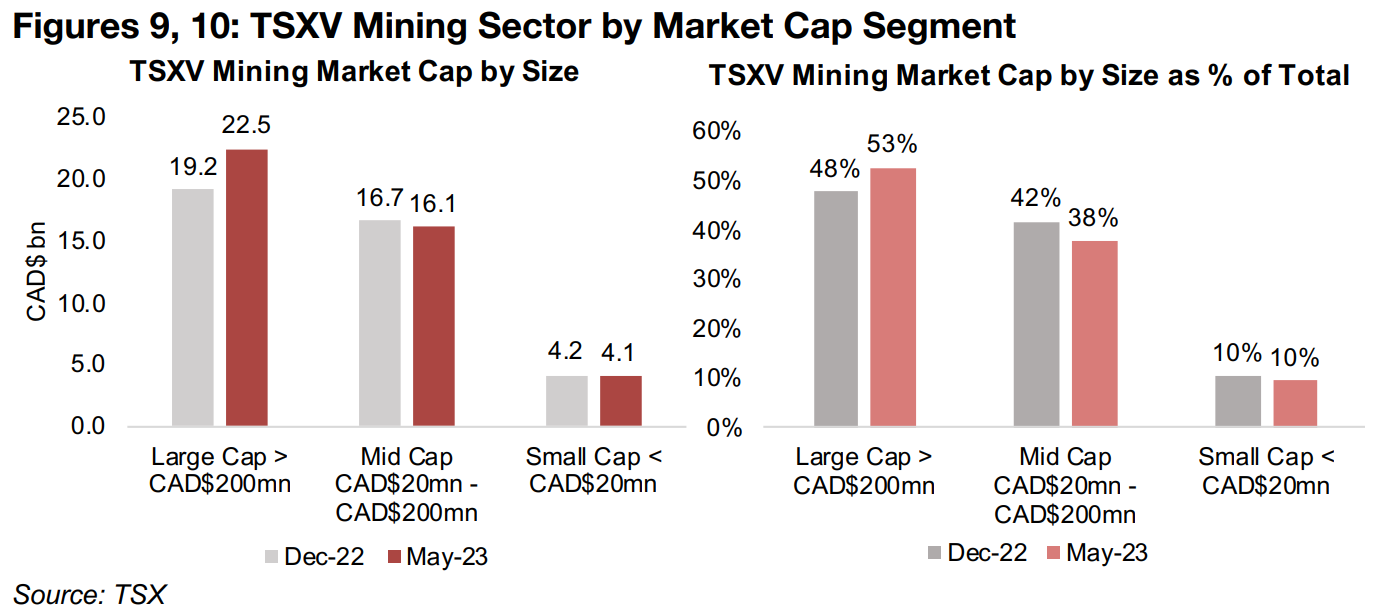
Within this broader shift has been a move towards larger market cap TSXV mining names in 2023. The aggregate market cap of TSXV mining stocks with a market cap of over CAD$200mn has risen 17.2% to CAD$22.5bn this year as of May 2023 (Figure 9), to a 53% share of the total up from 48% at the start of 2023 (Figure 10). This has been at the expense of mid-caps, ranging from CAD$20mn-CAD$200mn, down to 38% of the total from 42% at the start of 2023, with small and microcaps maintaining their share at 10%. This probably indicates a shift towards companies seen as safer, with larger cap names tending to have more advanced projects, or even having reached production, therefore reducing risk considerably.
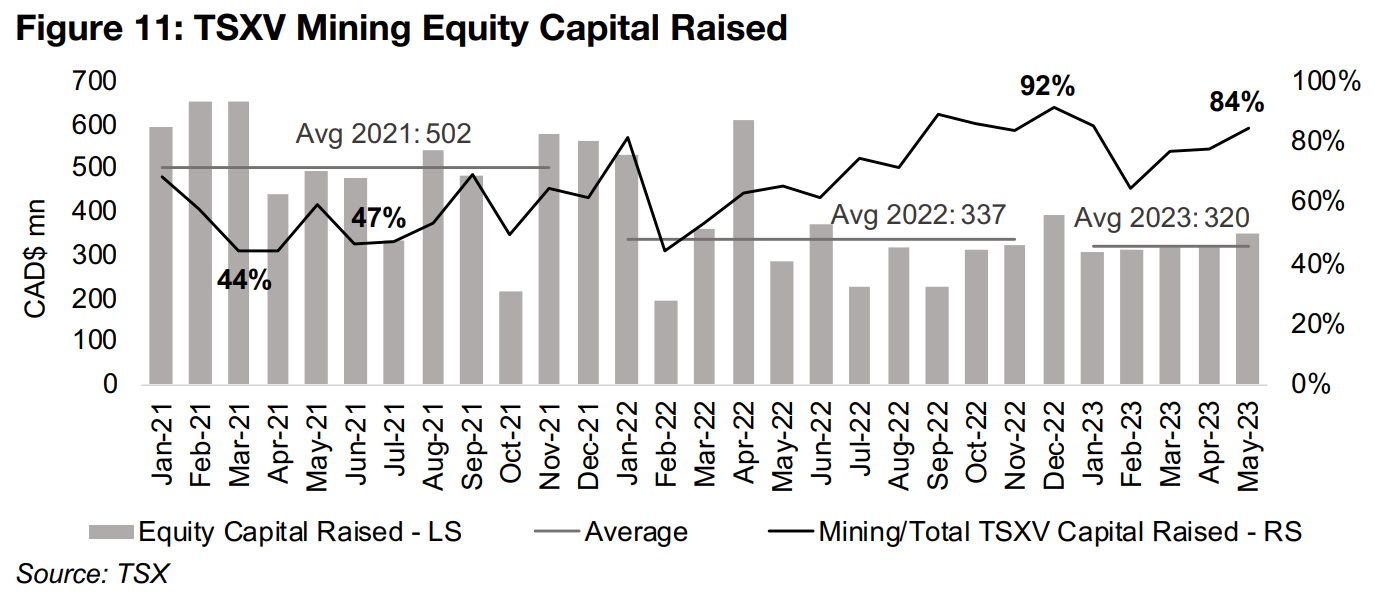
The broader trend towards risk off that started in 2022 has seen a decline in equity
capital raised by the TSXV mining sector, to an average CAD$337mn per month,
down from CAD$502mn per month in 2021 (Figure 11). The market has likely become
even more risk averse overall this year, especially since the banking crisis, apart from
some flows into a few mega-cap tech stocks. However, the small cap, high risk TSXV
junior miners have seen only a small decline in capital raised, at an average
CAD$320m per month so far in 2023.
Also, there has been a huge rise in the TSXV mining sector's contribution to overall
equity capital raised on the TSVX, from an average 55% in 2021 to 72% in 2022 and
77.8% so far in 2023, with peaks as high as 92% in December 2022 and 84% in May
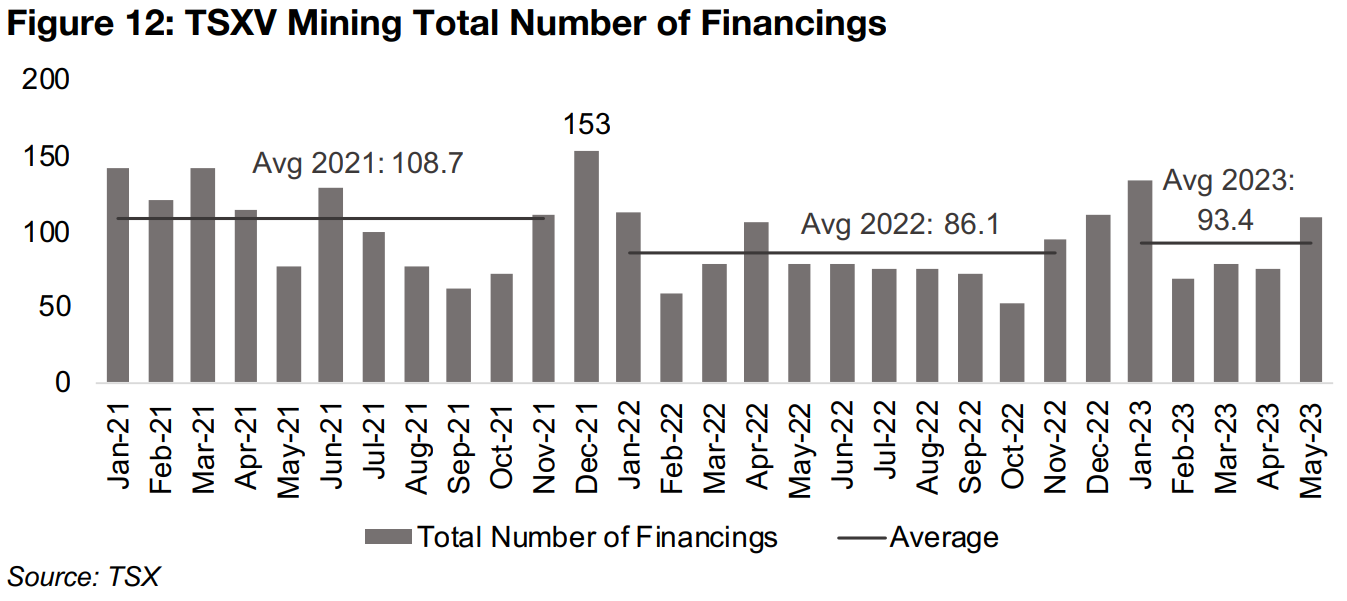
2023. While the total number of equity financings declined from 108.7 on average per
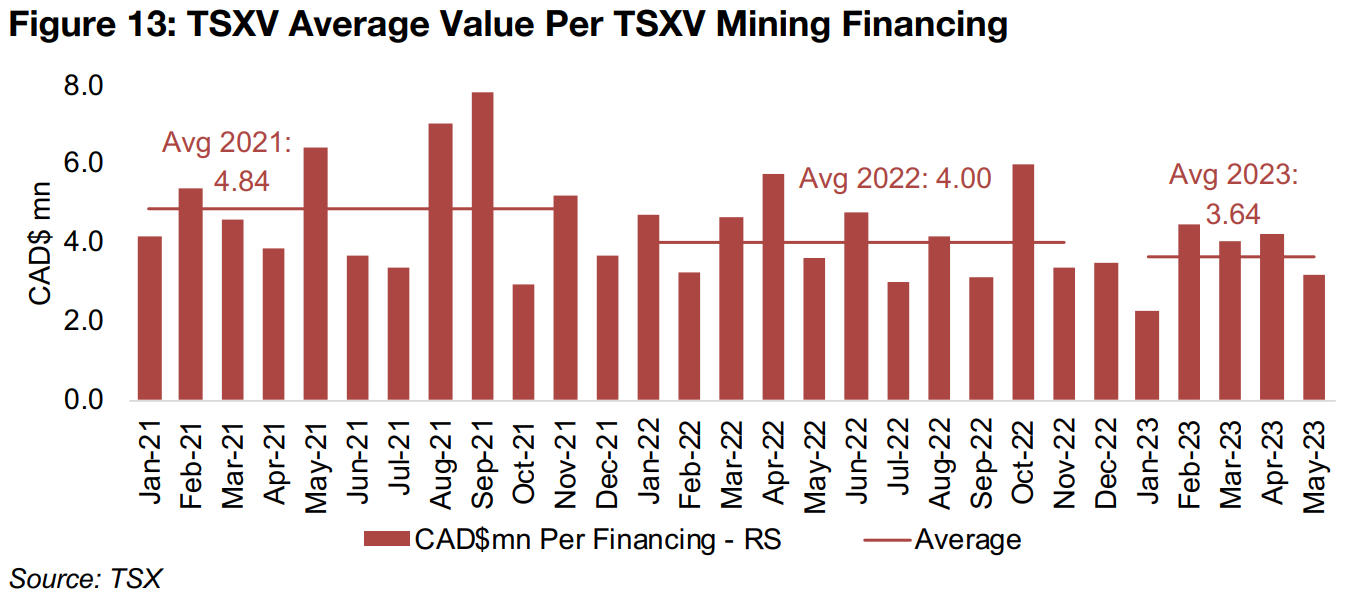
month in 2021 to 86.1 in 2022, they actually rose to 93.4 in 2023 (Figure 12), although
the average value per financing has declined from CAD$4.84mn in 2021 to
CAD$4.00mn in 2022 and CAD$3.64mn (Figure 13).
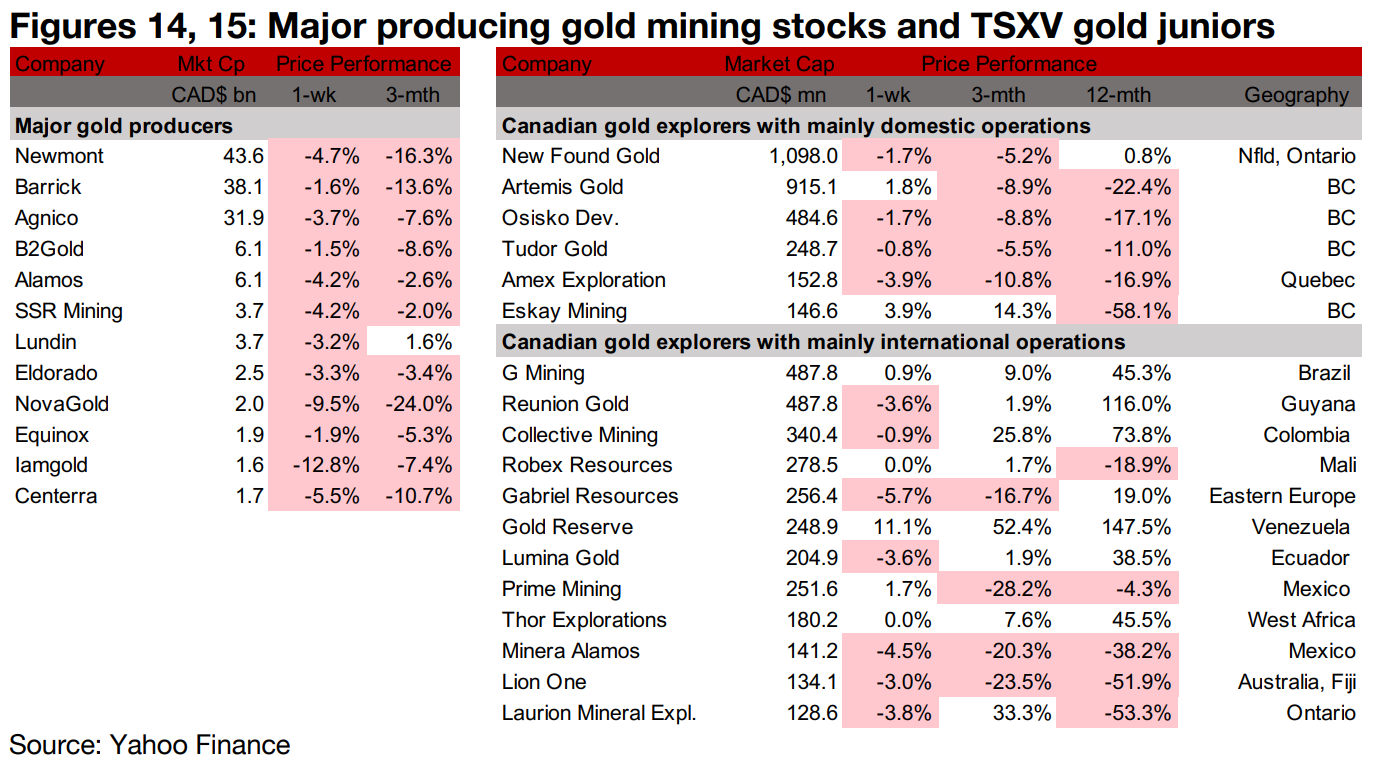
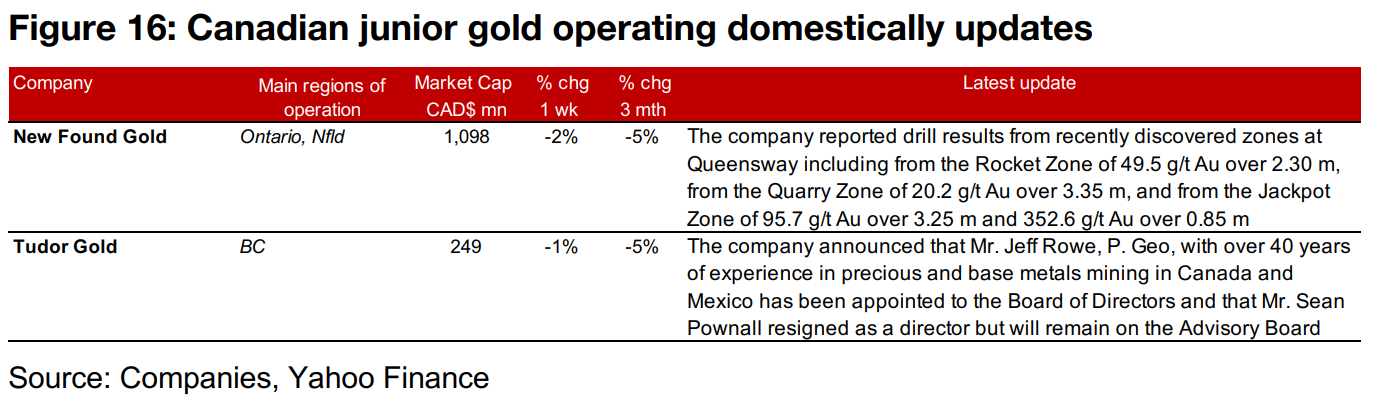
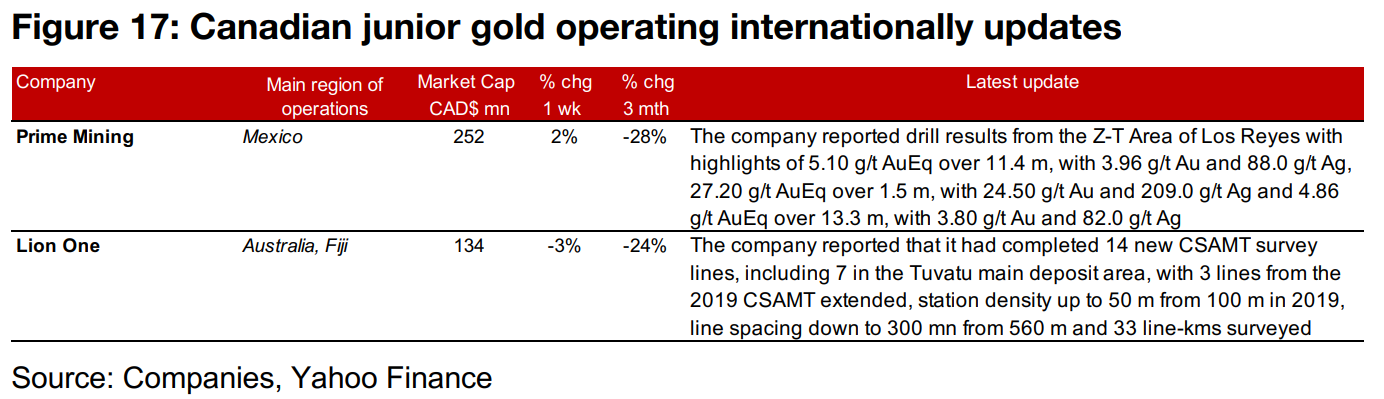
The gold producers all dropped and most of the larger TSXV gold stocks declined (Figures 14, 15). For the TSXV gold companies operating domestically, New Found Gold reported drill results from recently discovered zones at Queensway and Tudor Gold announced that Mr. Jeff Rowe was appointed to its Board of Directors (Figure 16). For the TSXV gold companies operating internationally, Prime Mining reported drill results from the Z-T Area of Los Reyes and Lion One announced the results of its CSAMT survey (Figure 17).
Disclaimer: This report is for informational use only and should not be used an alternative to the financial and legal advice of a qualified professional in business planning and investment. We do not represent that forecasts in this report will lead to a specific outcome or result, and are not liable in the event of any business action taken in whole or in part as a result of the contents of this report.
Author
Ben McGregor authors the Weekly Roundup at CanadianMiningReport.com, providing sharp analysis of the metals and mining sector. With a talent for spotting trends, Ben distills complex market shifts into clear, engaging insights on TSXV junior miners. His weekly updates cover gold, copper, uranium, and more, blending data-driven perspectives with a knack for identifying opportunities. A vital resource for investors, Ben’s work navigates the dynamic junior mining landscape with precision.