
August 06, 2021
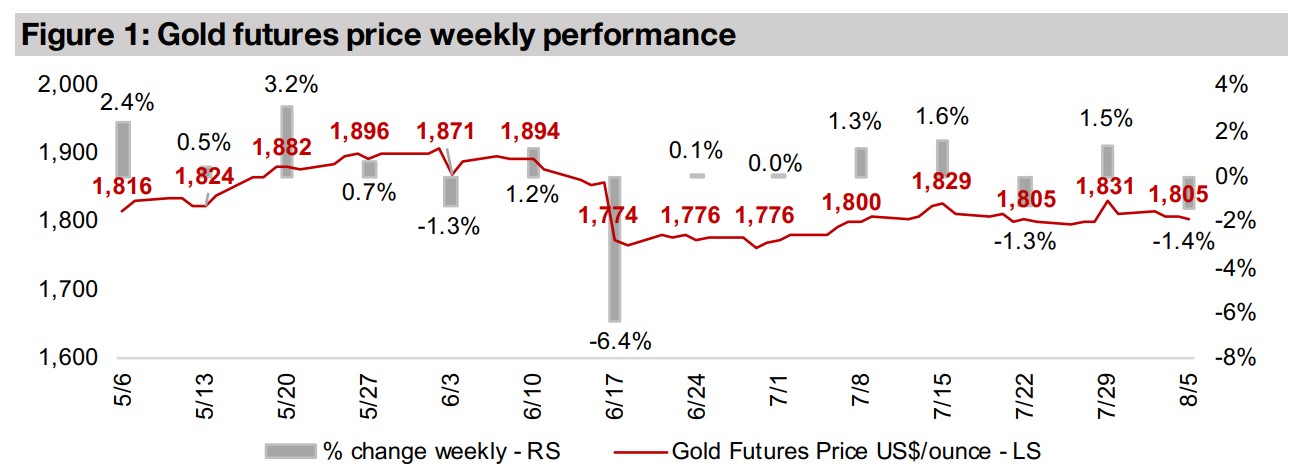
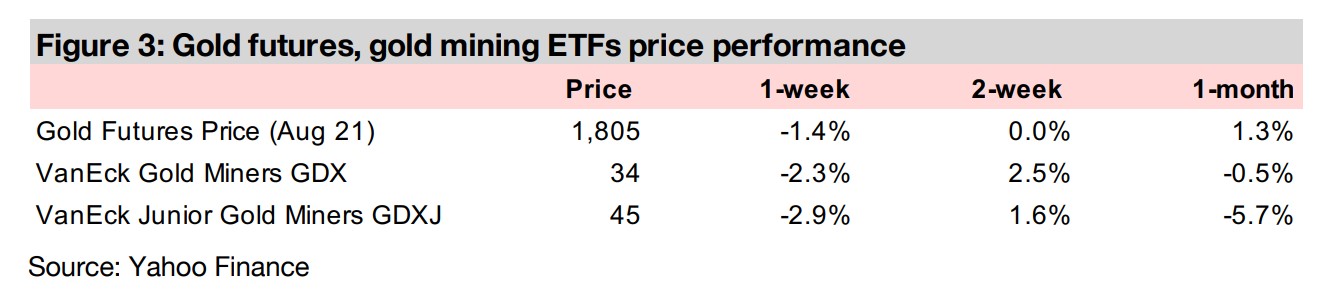
The gold price declined -1.4% this week to US$1,805/oz, as both the US dollar and bond yields picked up, even as there were some mixed messages compared to the last relatively 'dovish' Fed meeting from a more 'hawkish' board member.
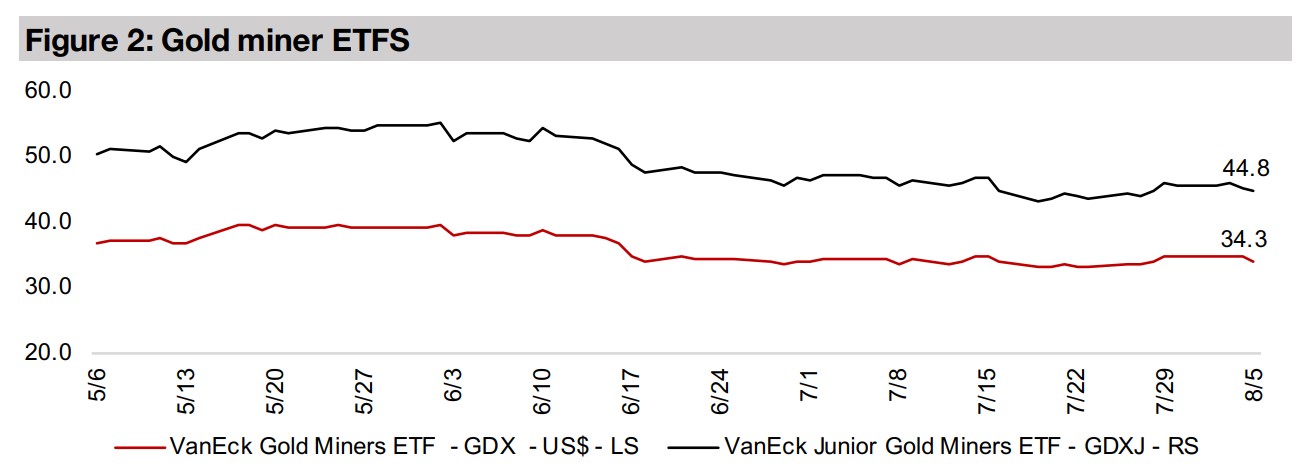
The producers and juniors fell this week on the gold decline, with a -2.3% drop in GDX and GDXJ down -2.9% and the Canadian juniors mostly down, even with the Q2/21 results season in full swing and sector operations looking strong overall.
In Focus this week are Tudor Gold, which recently released its first drilling results in seven months, from the Goldstorm Deposit at Treaty Creek and Pure Gold Mining, which announced the start of commercial production as of August 1, 2021.


Gold down on dollar and bond yield rise
Gold declined -1.4% this week to US$1,805/oz, as the US dollar and bond yields
both rose, with the dollar inversely related to the gold price, and the market tending
to sell off gold as bond yields rise so far this year (although, as we have shown in
previously weeklies, actually, there is no relationship between bond yields and gold
that holds over long periods historically). There were also some comments from
Waller, one of the seven Fed board members, that the Fed's bond purchases could
be reduced as early as October 2021, but that this would depend on especially on
employment data for the next few months.
This appears to be mixed messaging from the Fed, with Waller's more hawkish tone
in contrast to the more dovish tone of the most recent Fed meeting last month, where
Chairman Powell seemed to be backing away from an early taper and rate hikes.
However, this is actually typical of the Fed, as there is not a consensus view
presented, and individual members can have quite differing views, with decisions
made by a majority vote. Therefore, we can see more hawkish or dovish Fed board
members express sentiments that do not seem to be in line with the actual decisions
of the Fed. However, such comments can be a driver for gold and other markets
short-term, as the views of a single Fed member could prove critical in a voted
decision given that there are only seven of them.
For gold, the more hawkish the Fed, the more the market will anticipate rate hikes,
and therefore rising yields, which could drive the markets into bonds and away from
yield-less gold (while, as noted above, this is not always the case historically, it seems
like it will remain a theme for the time being). In contrast, a more dovish Fed means
the chance for higher inflation, which will generally be an upward driver for gold.
Similar to last week, we are seeing more mixed signals on the potential for inflation
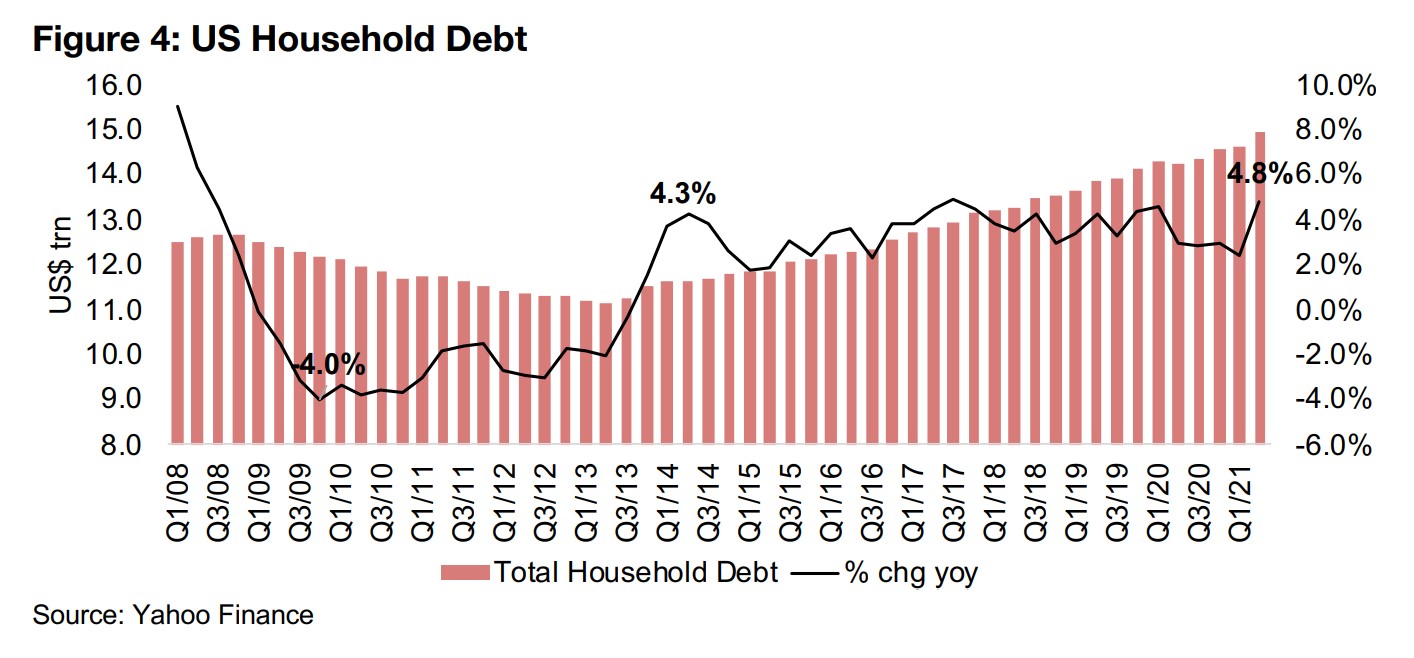
this week. US Household Debt data was released, showing a continued rise to
US$15.0 trn in Q2/21, up 4.8% yoy, the highest rate of growth since 2008 (Figure 4).
Households have been leveraging up consistently since 2013, after a period of
deleveraging from 2008 to 2012 during the global financial crisis. Increases in debt
tend to be drive inflation, assuming that there is no corresponding rise in demand.
However, in the current situation, clearly economic demand has been surging, so it
is unclear how much the recent increase in debt is just driven by pent-up demand
from the global health crisis. However, with some economic indicators pointing to an
easing of demand, if debt continues to rise at these high rates, it could eventually
become inflationary.
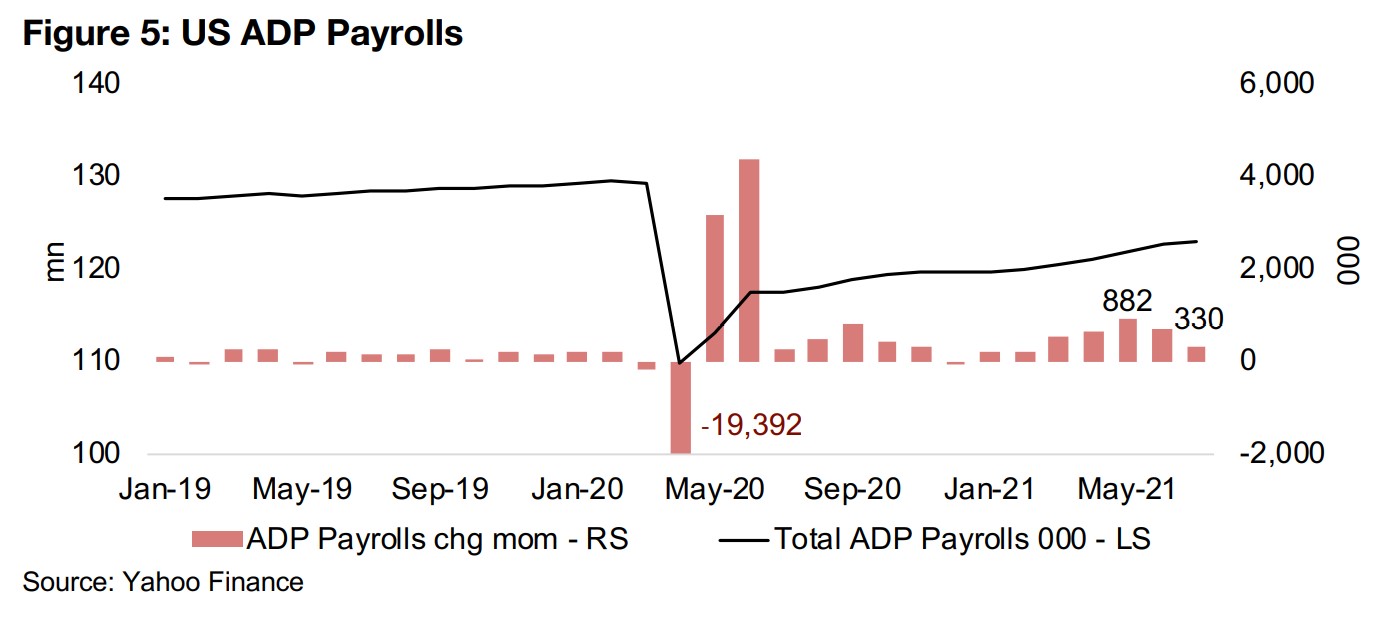
However, another key indicator is looking less inflationary, the US ADP Payrolls,
which are a key measure of US employment. The change in payrolls had been
generally picking up month on month through 2021 as the economy recovered, to a
high of 882k in May 2021, the strongest number since May and June 2020 during the
rebound from the crisis. However, the gain in payrolls have decreased significantly
since, to 680k in June 2021 and then to just 330k in July 2021, around half of the
number expected by the market. If this weakening trend were to continue, it would
be likely to ease off some of the inflationary pressures that are being seen in the
economy. However, this could also push the Fed to pull back further on its planned
tightening measures. Given the current huge amount of money printed over the past
year, further loose Fed monetary policy could drive further inflation even if the
employment and overall demand situations are weak. This is called 'stagflation',
defined as a period of low growth but high inflation, and last occurred in the 1970s.
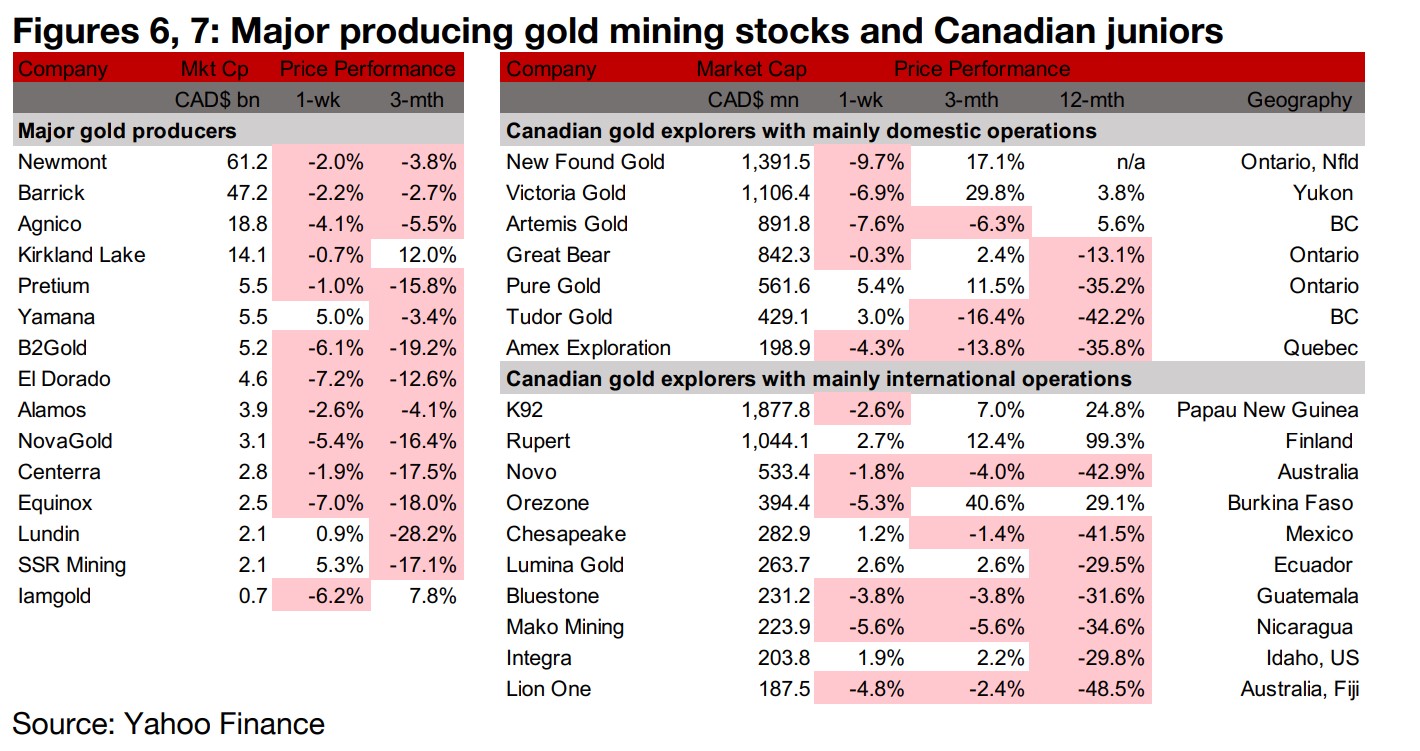
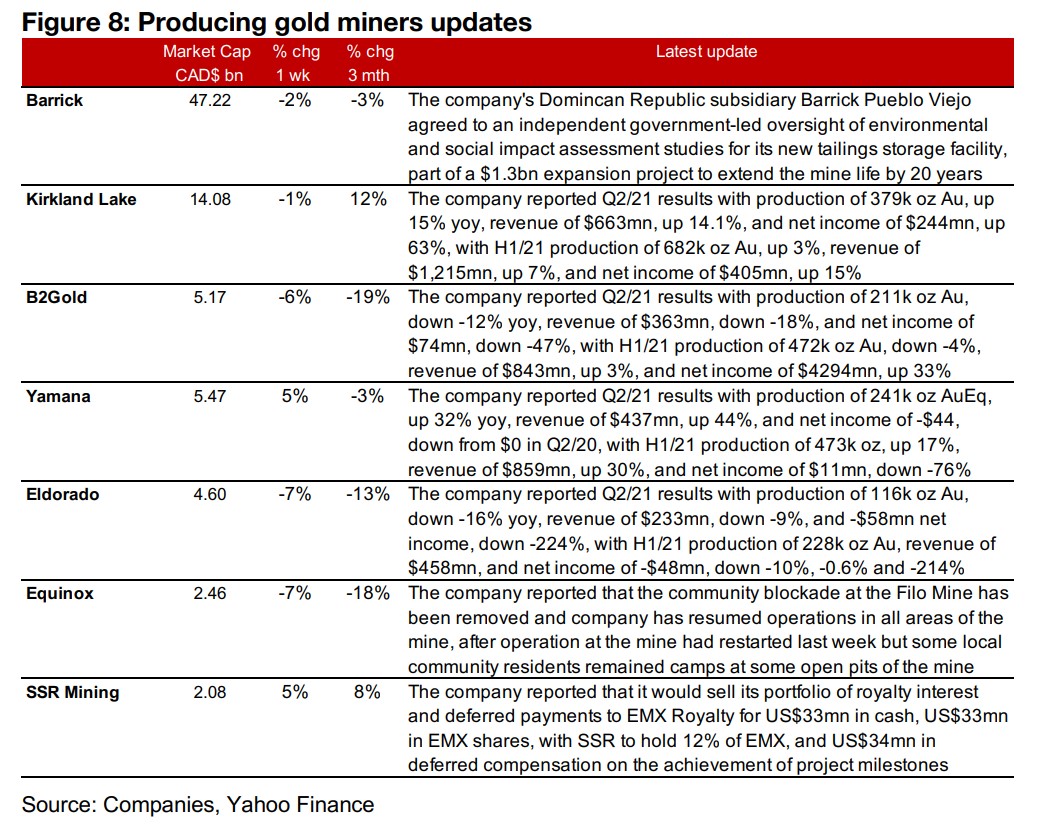
The major gold producers were mostly down this week as gold declined, even with the Q2/21 results season in full swing and looking decent overall for the sector (Figure 6). Barrick announced an independent government-led environmental assessment for its Dominican Republic subsidiary Pueblo Viejo, and Kirkland Lake, B2Gold, Yamana and El Dorado all reported Q2/21 results. Equinox reported that the blockade at the Los Filos Mine has been removed and operations completely resumed, and SSR Mining reported that it would sell its portfolio of royalty interest and deferred payments to EMX Royalty (Figure 8).
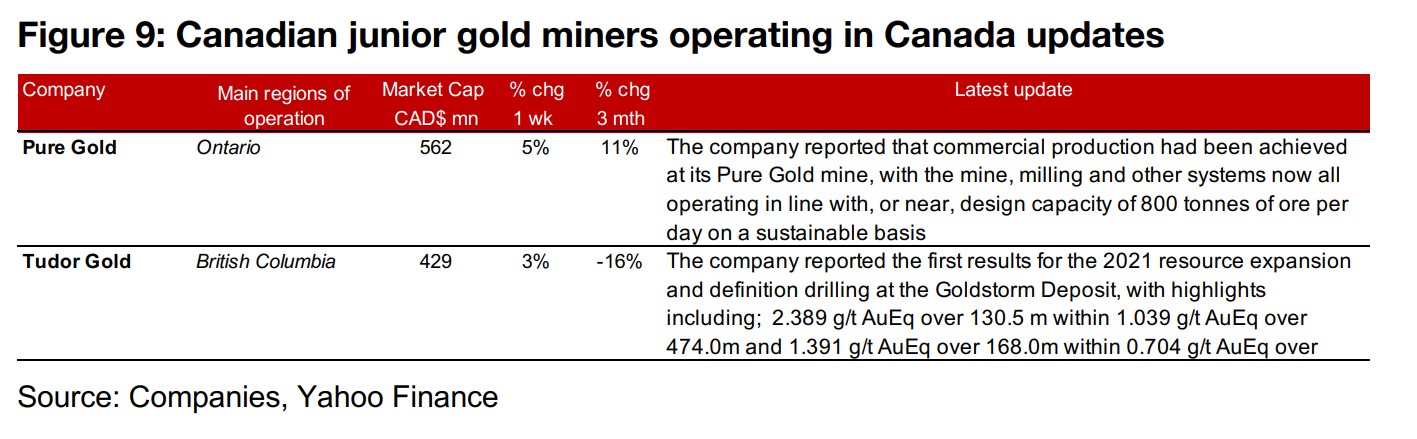
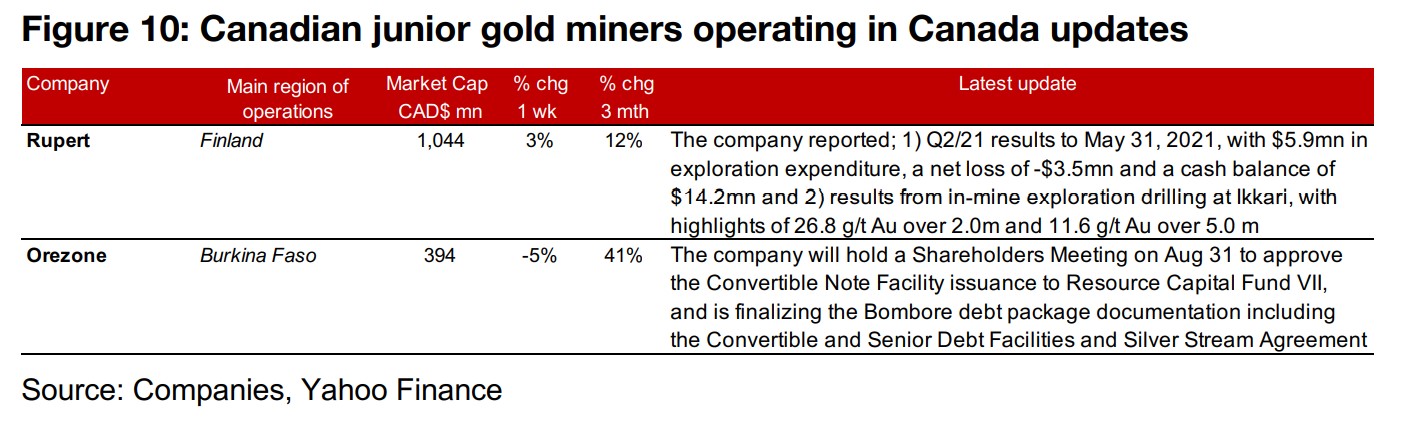
The Canadian juniors were mostly down on the decline in gold (Figure 7). For the Canadian juniors operating domestically, Pure Gold reported that it had started commercial production as of August 1, 2021 and Tudor Gold reported drilling results from Goldstorm at Treaty Creek (Figure 9). For the Canadian juniors operating mainly internationally, Rupert Resources reported Q2/21 results and drilling results from Ikkari, and Orezone announced a special Shareholders Meeting on Aug 31, 2021 to approve its Convertible Note Facility issuance to Resource Capital Fund VII and is finalizing the Bombore debt package documentation (Figure 10).
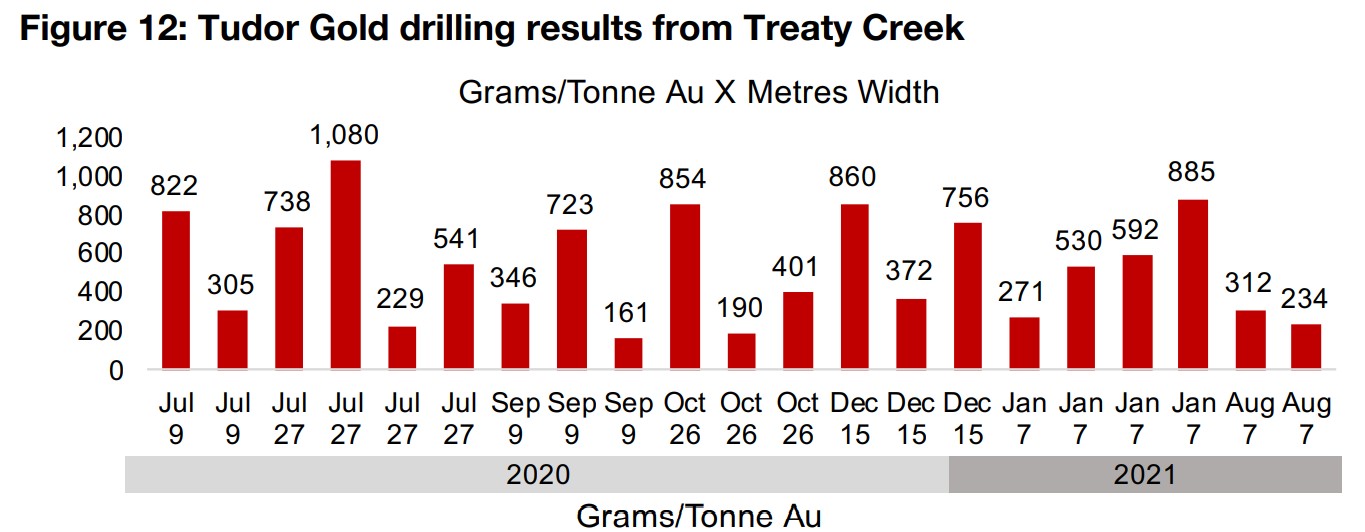
Tudor holds 35,518 h.a. over four properties in the Golden Triangle, Treaty Creek, a 17,913 h.a. 60%-owned joint venture with Teuton (holding 20%) and American Creek (20%), Crown, a 100%-owned 15,657 h.a. project (which is to be spun-off), Electrum, a 650 h.a. 100%-owned project, and Eskay North, a 100%-owned 1,298 h.a. project (Figure 12). The properties are close to two major discoveries, Seabridge's KSM project and Pretium's Valley of the Kings projects, which contain resources totalling over 72mn ounces Au and 13bn lbs Cu. They are close to strong road, air and port infrastructure and the company has also signed engagement, communication and opportunity sharing agreements with the local Tahltan First Nation.
The company has focused on exploration of the Goldstorm Zone at Treaty Creek over
the past year, with the drilling result highlights from July 2020 shown in Figure 12.
The drilling season this year began in May 2021 with two rigs, given the northern
climate limiting winter operations, and in June 2021 an additional two rigs were added.
The company reported the first drill results from the current season in August 2021,
and the company had seen limited drivers from exploration news for over six months
with the previous set of results reported in January 2021.
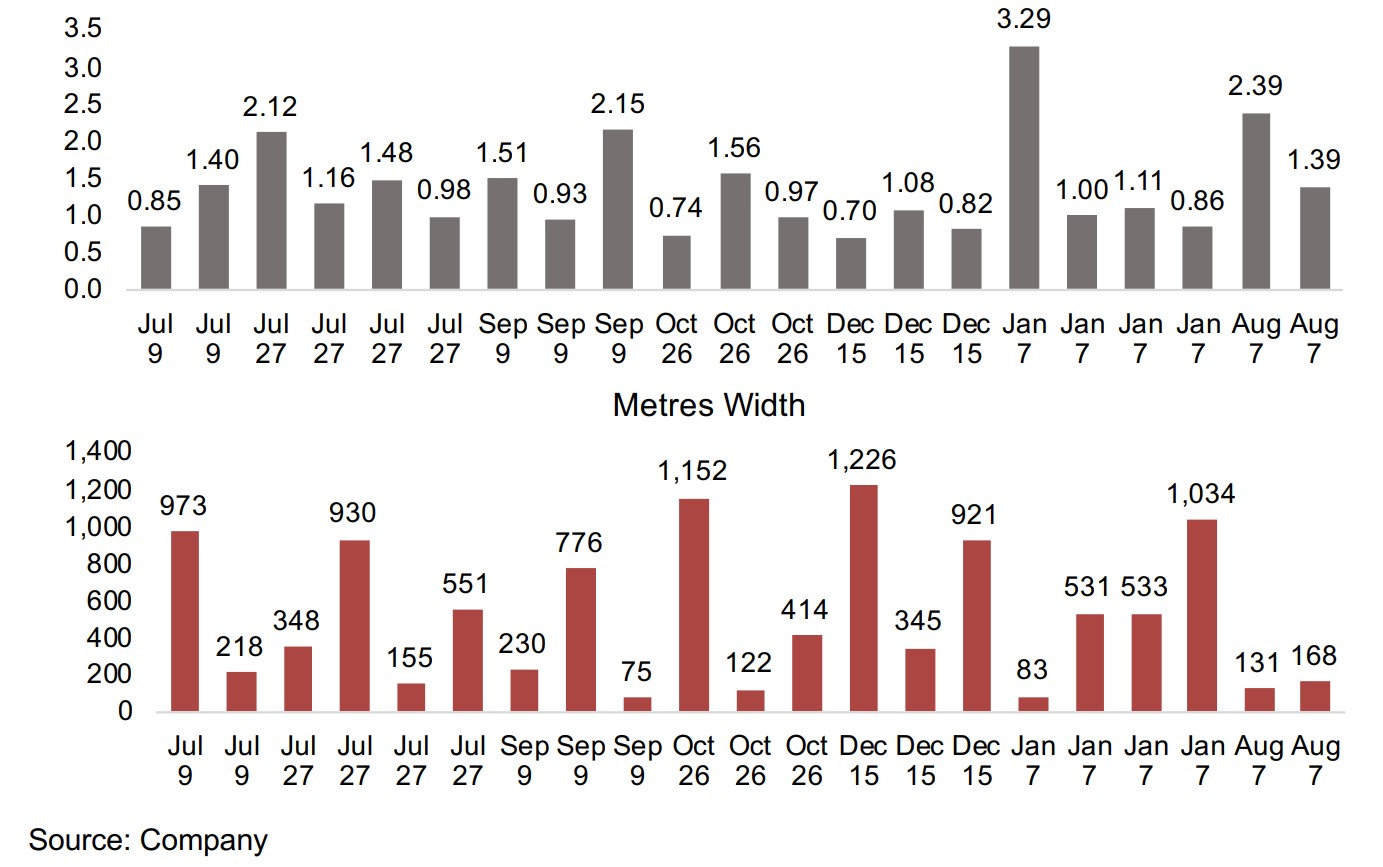
The August 2021 results saw the company’s second highest grade results of the past
year, at 2.39 g/t AuEq over 131 m, with the highest grade result from January 2021,
at 3.29 g/t AuEq, However, these results were over a limited width compared to many
of the company's other drill results, at 131 m and 83 m, respectively, and therefore
not the strongest results in terms of a grams x thickness measure, at just 312 and
271. On grams x thickness, the strongest results over the past year were from July
2021, with 1.16 g/t AuEq over 930m, for a grams x thickness of 1,080, and from
December 2021, with 0.70 g/t AuEq over 1,226 m for a grams x thickness of 860.
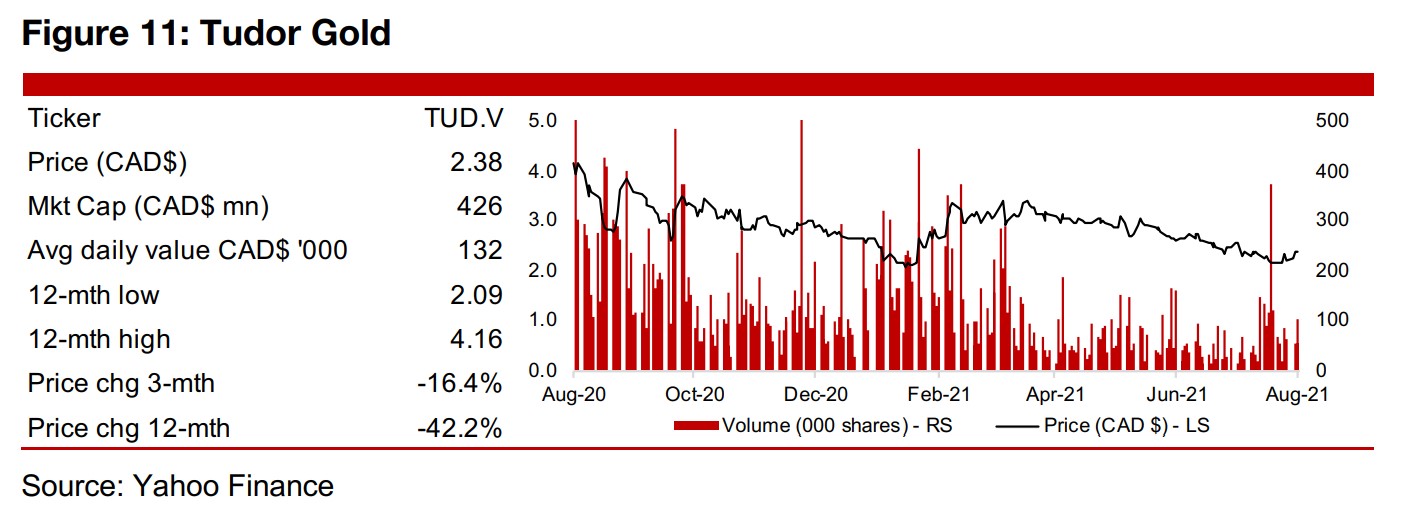
Exploration at Treaty Creek continues at three zones, Goldstorm, Perfect Storm and Eureka, with six rigs now drilling there. The company is well funded to continue exploration, with a $6.0mn private placement completed and an announcement made for the proposed the spin-off of Crown Property, both in July 2021. The main driver of the share price for 2021 will continue to be the release of drilling results from the current program. The share price has declined -42.2% over the past twelve months and -16.4% over the past three months, a combination of the slide in gold off its mid-2020 peak, but also because of a lack of operating results over the first half of the 2020 as the company awaited the end of winter to begin the current drilling season.
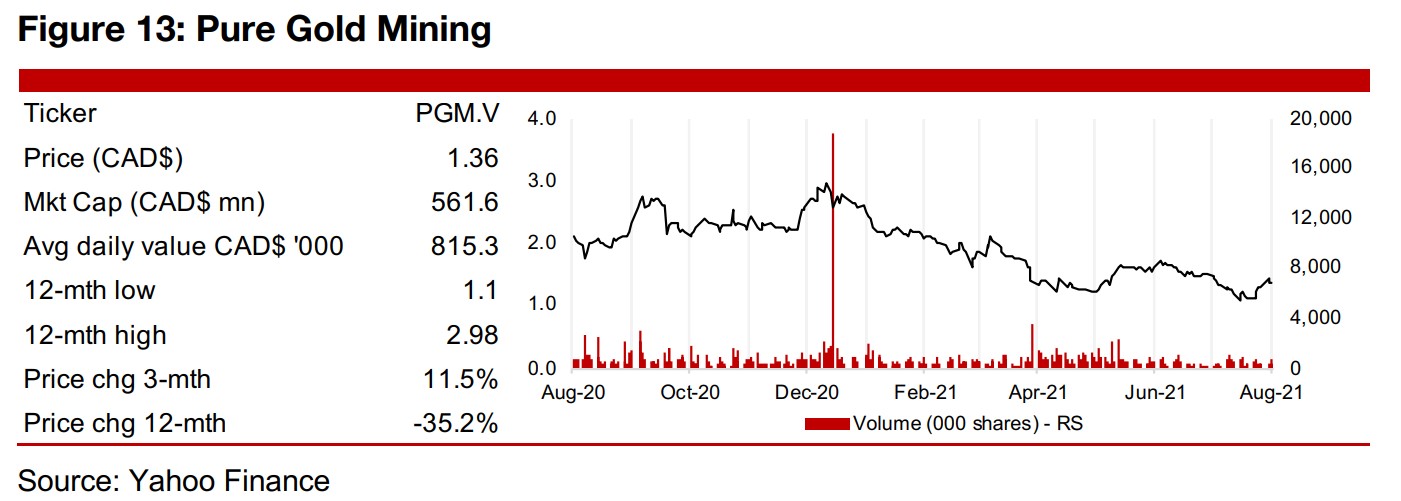
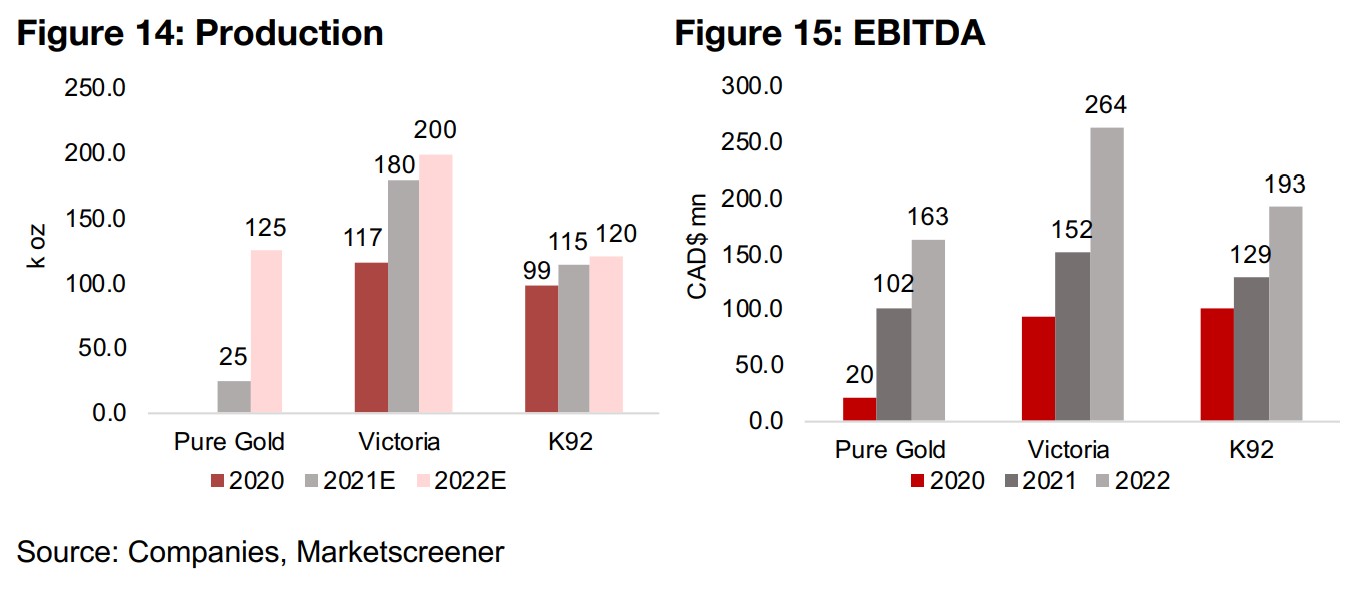
Pure Gold Mining began commercial production on August 1, 2021, and based on current consensus estimates, could see around 25k in gold production in 2021, with the company expecting production to reach 125k oz in 2022 (Figure 14). Consensus estimates target $20mn in earnings before interest, tax and depreciation (EBITDA) in 2020, rising to $102mn in 2021 and $163mn in 2022 (Figure 15). This would see Pure Gold at a comparable size to both Victoria Gold and K92 Mining, which began commercial production in 2020, and 2018, respectively, and both moved from a TSXV to TSX listing in 2020. However, in terms of resources, Pure Gold is the smallest of the three, with 2.60mn in Au oz, compared to 5.20 mn for K92 and 8.56 mn for Victoria, although the company continues active exploration and still targets a substantial expansion of the current resource (Figure 16).
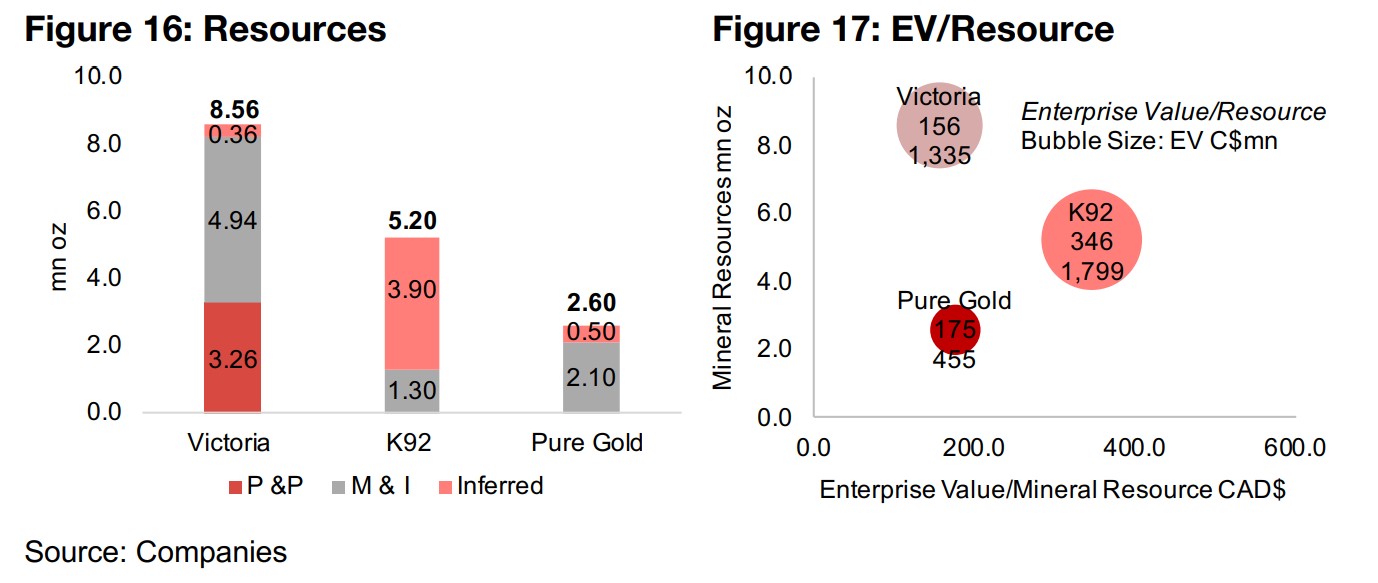
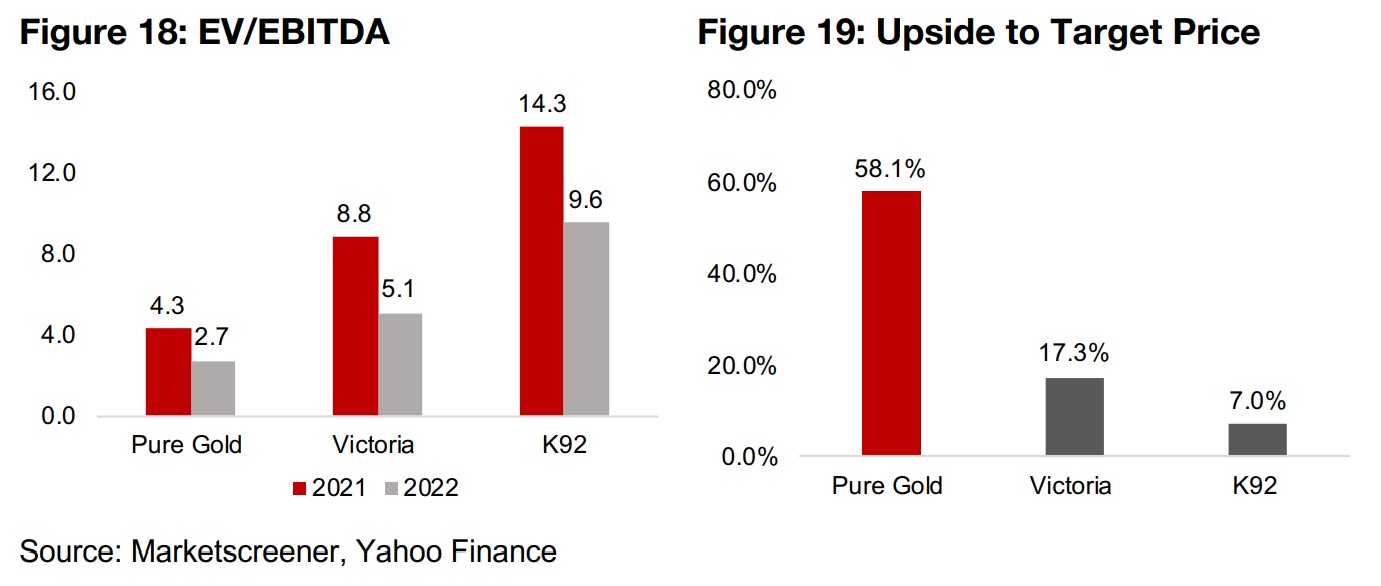
The market is valuing Pure Gold at an Enterprise Value (EV)/Resource of $175/oz, ahead of Victoria Gold at $156/oz, but significantly below K92 Mining at $346/oz, in part because of K92's relatively low AISC/oz. The company's EV/EBITDA valuation is not looking excessive versus these two comparables, at 4.3x for 2021, compared to 8.8x for Victoria at 14.3x for K92, and the market expects it to continue to trade at discount in 2022 (Figure 18). That the market appears to view Pure Gold as trading at a considerable discount to its fair value and the peer group is also shown in its much higher upside to its target price, at 58.1%, compared to just 17.3% for Victoria, and 7.3% for K92 (Figure 19).
Disclaimer: This report is for informational use only and should not be used an alternative to the financial and legal advice of a qualified professional in business planning and investment. We do not represent that forecasts in this report will lead to a specific outcome or result, and are not liable in the event of any business action taken in whole or in part as a result of the contents of this report.
Author
Ben McGregor authors the Weekly Roundup at CanadianMiningReport.com, providing sharp analysis of the metals and mining sector. With a talent for spotting trends, Ben distills complex market shifts into clear, engaging insights on TSXV junior miners. His weekly updates cover gold, copper, uranium, and more, blending data-driven perspectives with a knack for identifying opportunities. A vital resource for investors, Ben’s work navigates the dynamic junior mining landscape with precision.