
March 16, 2026
While the rise in oil could drive up mining sector costs, Canada could still see a net gain as one of the largest global producers and exporters of the fossil fuel, with the industry generating nearly three times the revenue of the mineral sector in the country.
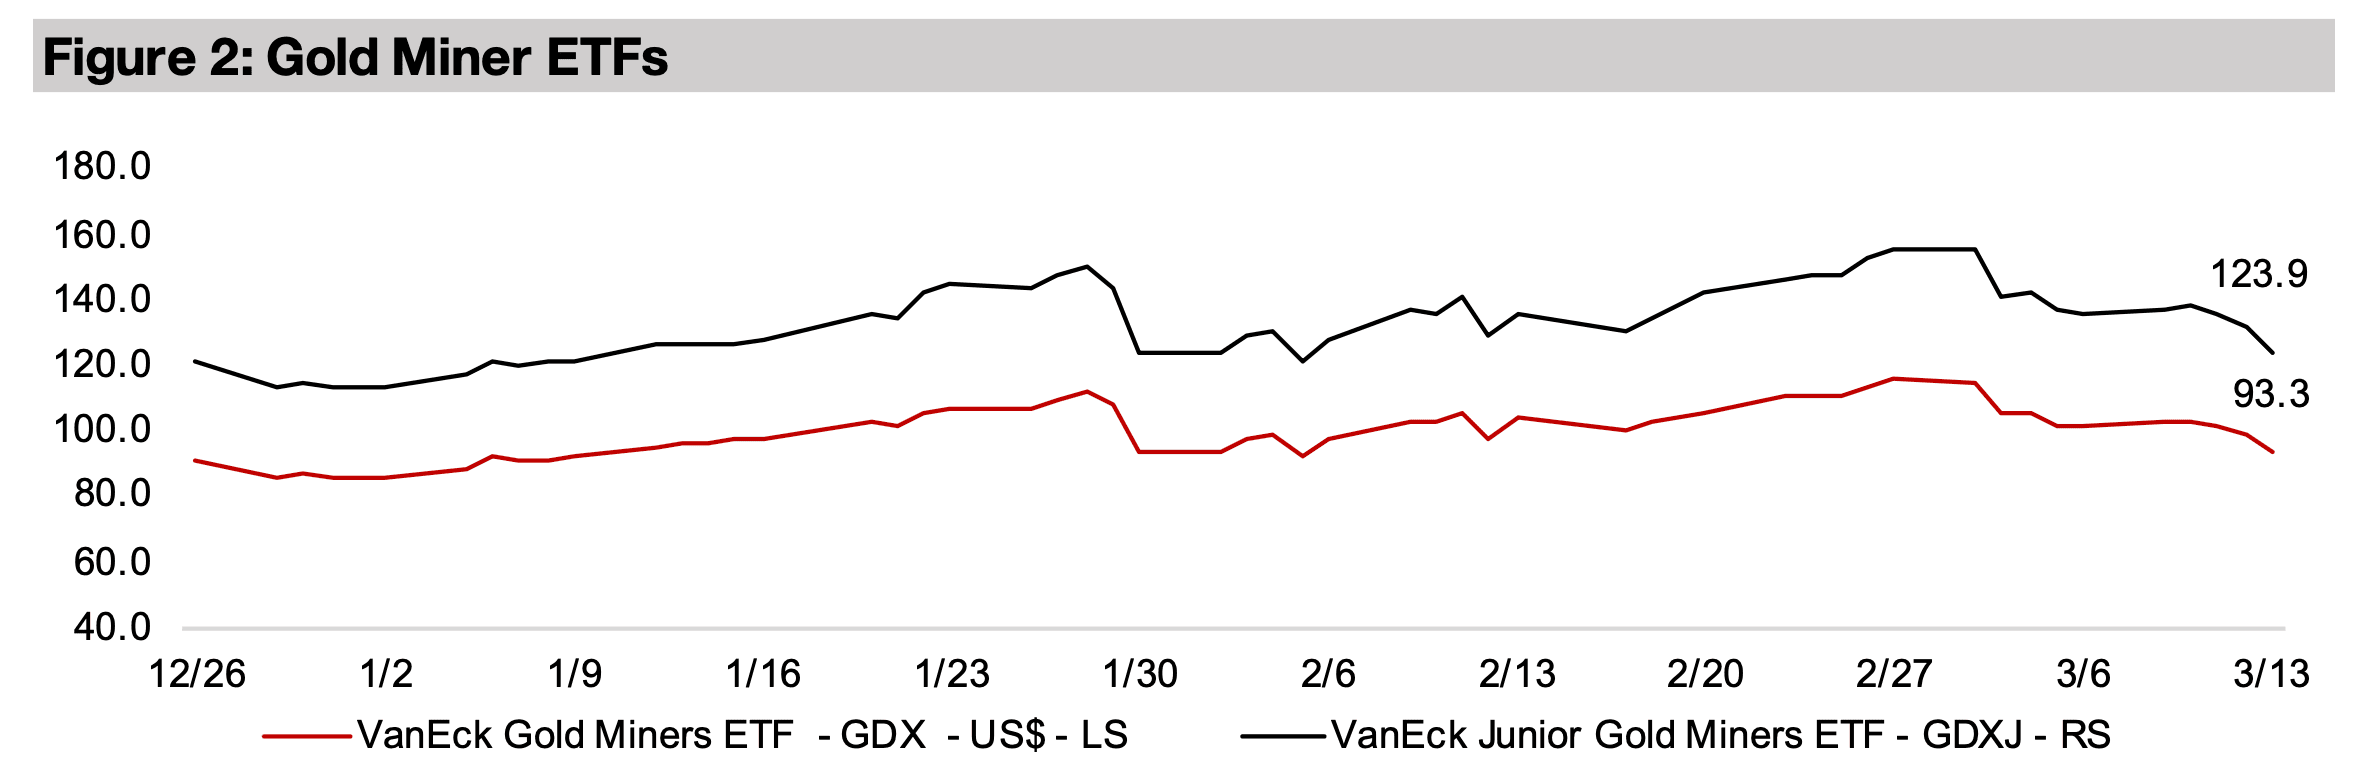
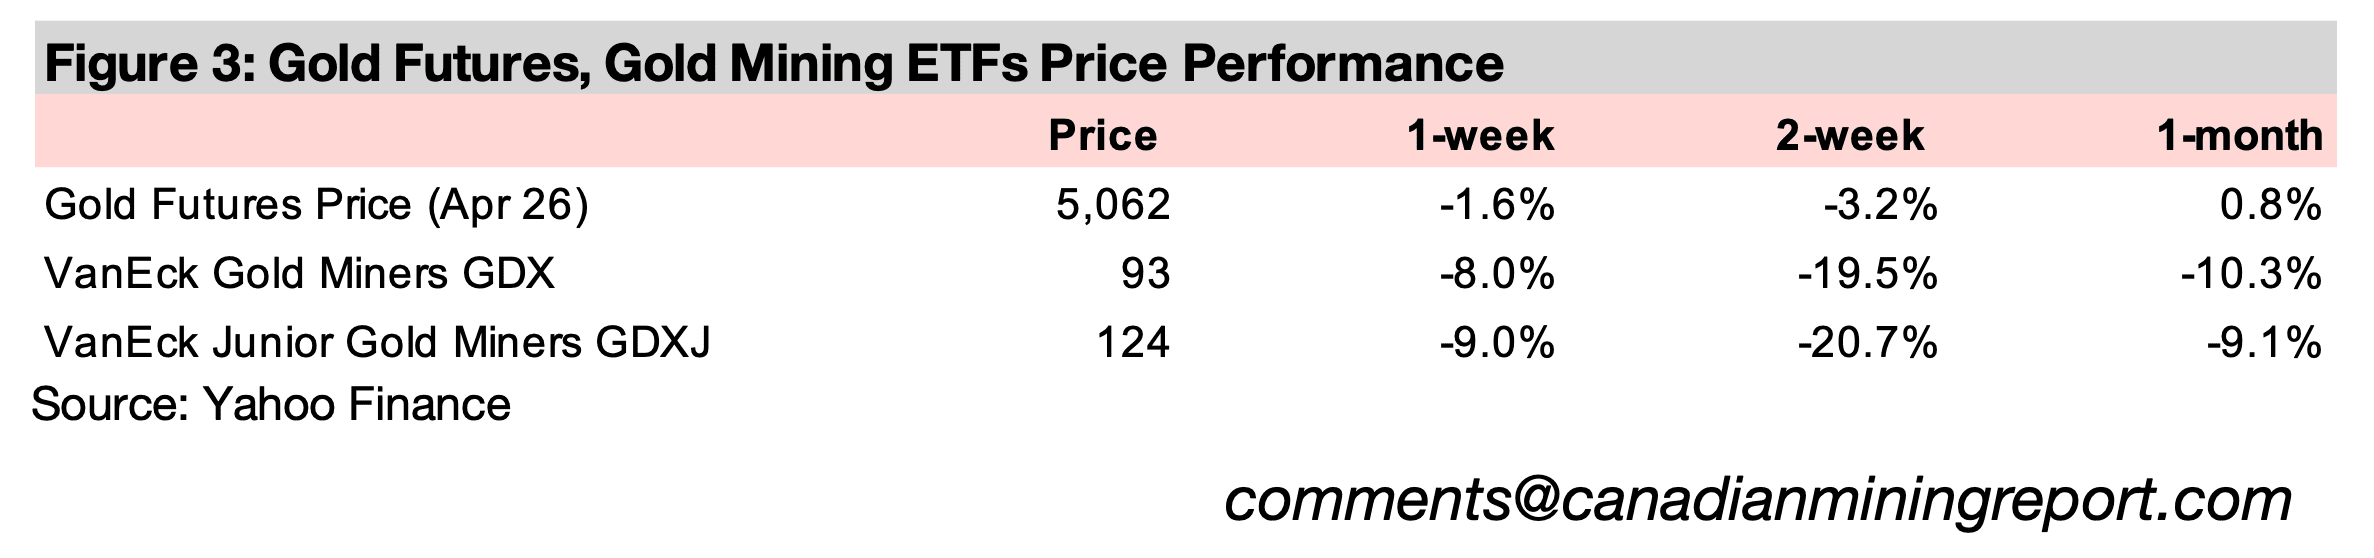
The gold stocks were down heavily for the second week, with the GDX and GDXJ plunging around 20% since the start of March 2026 on the declining metal price, risks of rising costs and valuations that have surged above most major sectors.


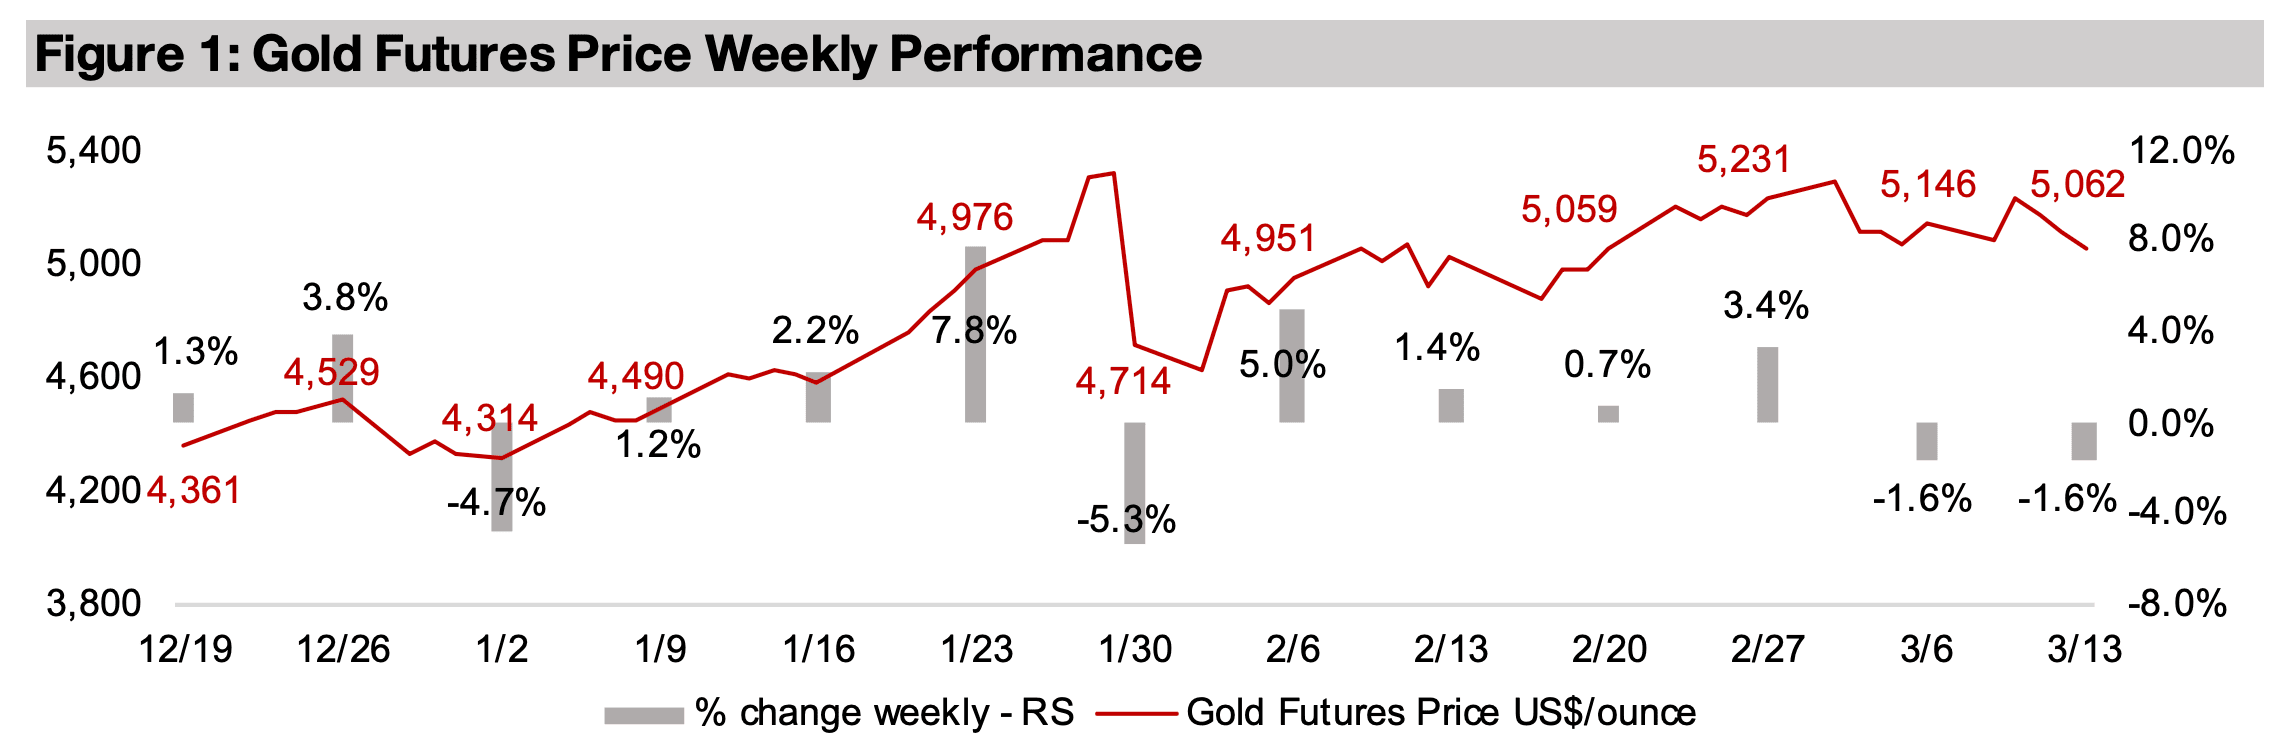
The gold price dropped -1.6% to US$5,062/oz, exactly at the average of the past two
months, with the market having settled into a trading range of around US$4,900/ozUS$5,300/oz over the period. The key economic data released included US CPI inflation which came in below expectations and a major downward revision of US
Q4/25 GDP, although the war in the Middle East was by far the main driver of the
macro outlook, sending energy prices soaring. The gold price has actually eased
since the start of the conflict, with some fund flows likely now heading instead to the
booming energy sector, and the market taking some profits with the metal already up
16.1% this year after the huge 62.7% gain in 2025 (Figure 4).
The slump in other precious metals continued, with silver down -4.9%, platinum
losing -5.6% and palladium off -6.7%, while copper dropped -2.2%, aluminum was
near flat, up 0.2% and only iron ore rose, up 3.2%. Equities dropped, likely partly on
expectations that a rising oil price could lead to higher costs for most industries, with
the S&P 500 declining 1.0%, the Nasdaq losing -0.4% and Russell 2000 down -0.9%.
A potential jump in production costs were likely also a main cause behind the
continued slump in gold stocks, with the GDX and GDXJ down -8.0% and -9.0%.
There have also been concerns over a possible collapse in private credit markets,
with some major funds apparently halting investor withdrawals of funds, although the
situation is opaque given the lack of public information. While private credit markets
have expanded extremely rapidly in recent years to US$3trn, they are still only a small
fraction of the public debt and equity markets, at over US$340trn and US$130trn,
respectively. However, there are fears they could have a contagion effect, similarly to
the way the relatively small sub-prime market started the 2008-2009 financial crisis.
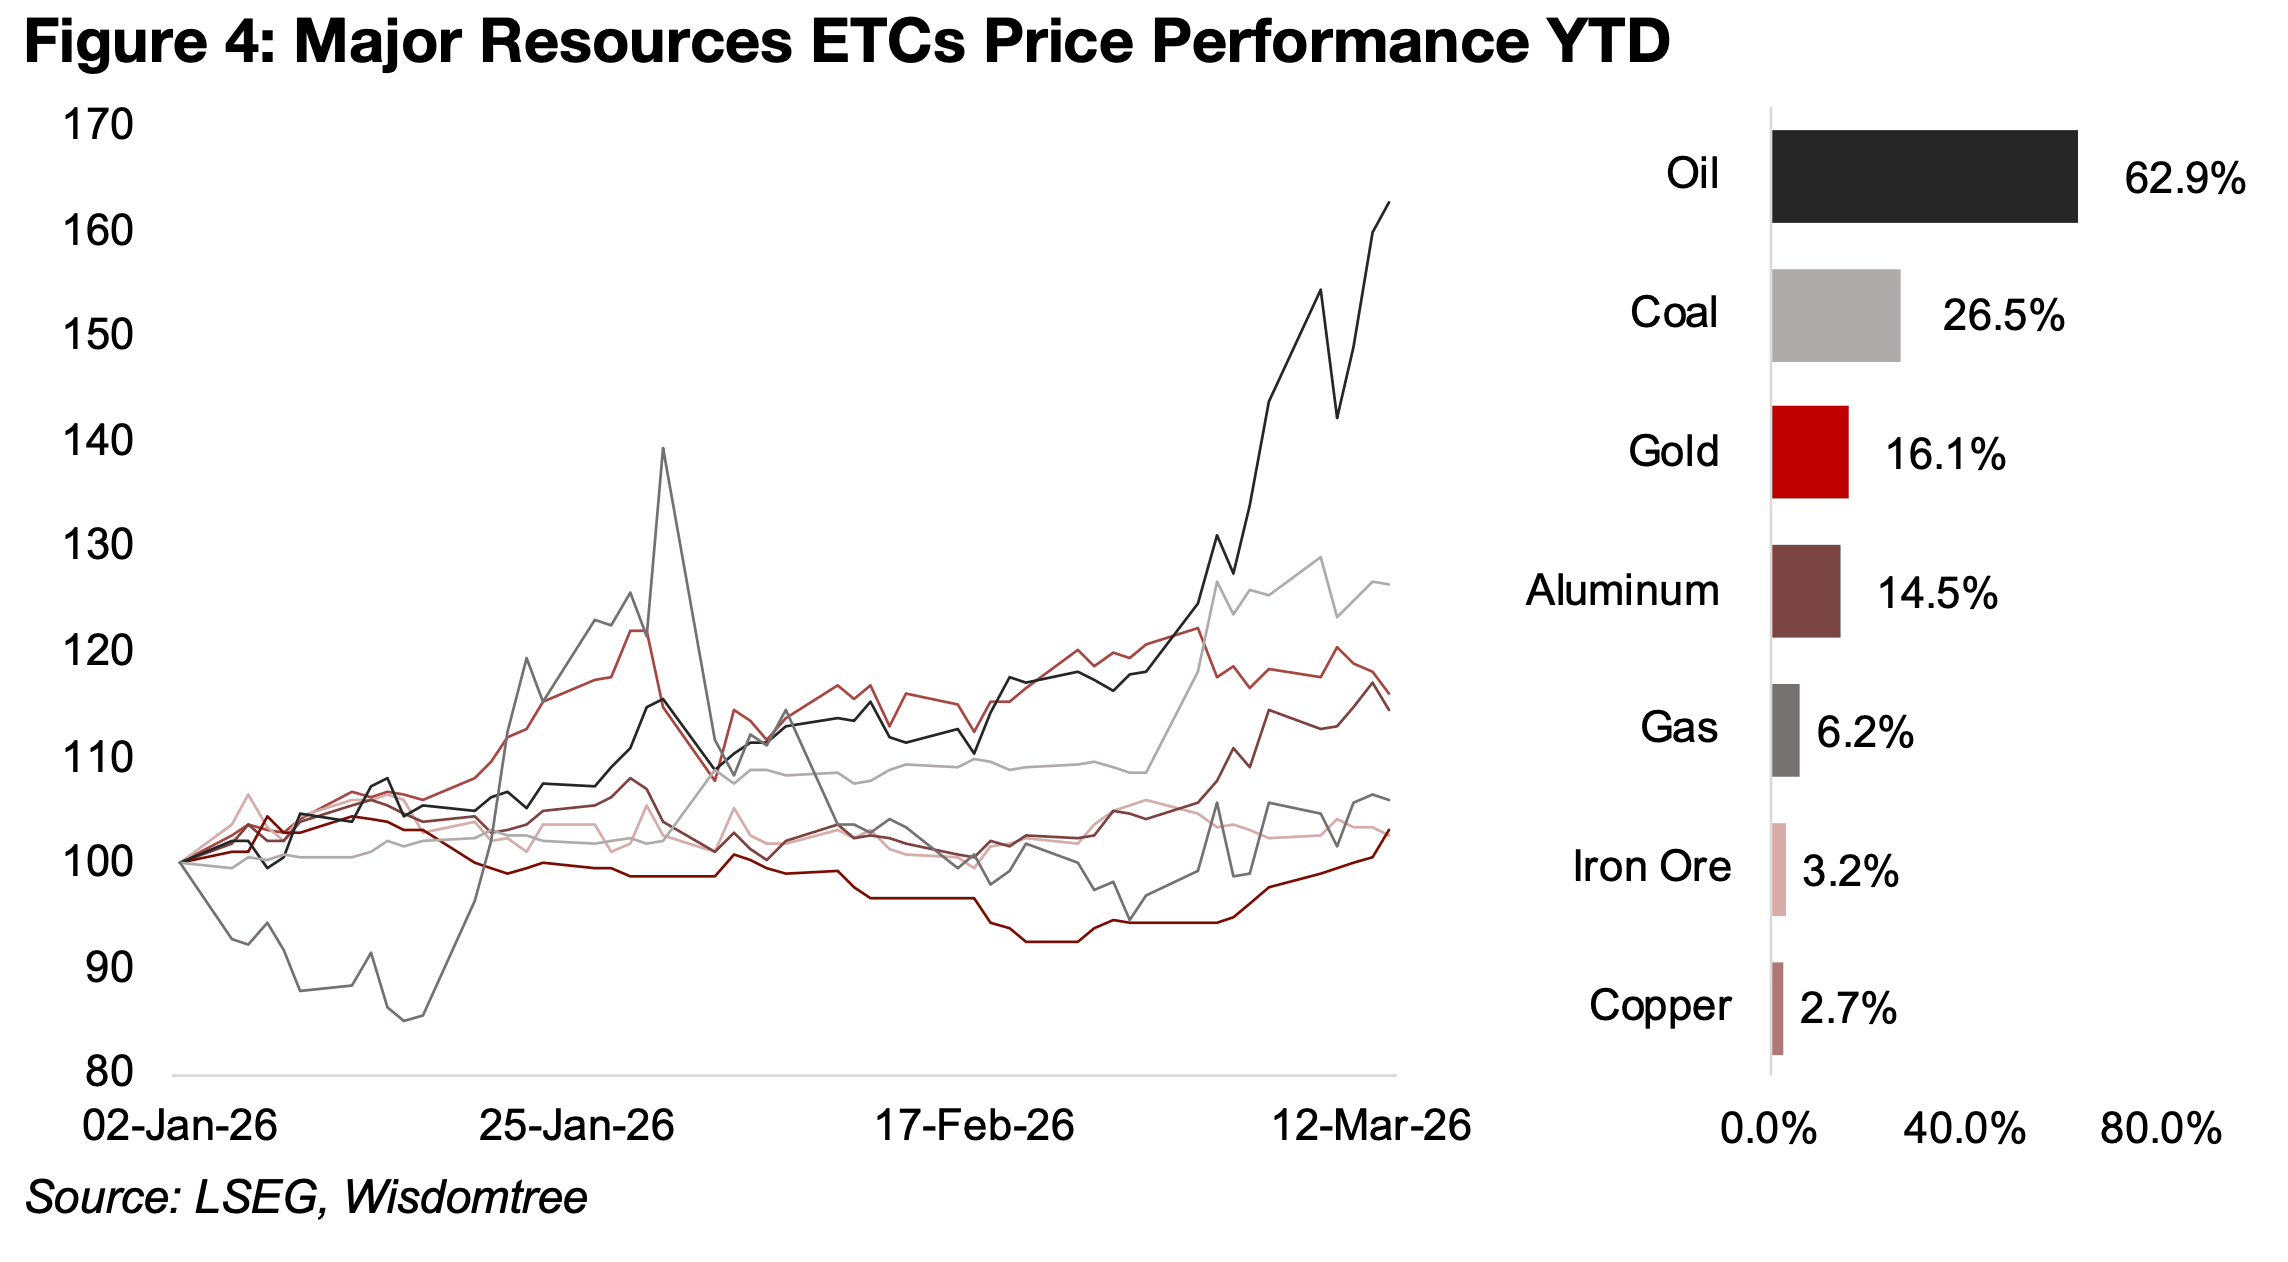
The oil price has rocketed up 62.9% this year, with most of this occurring just in the
two weeks since the start of the Middle East conflict, with global supply severely
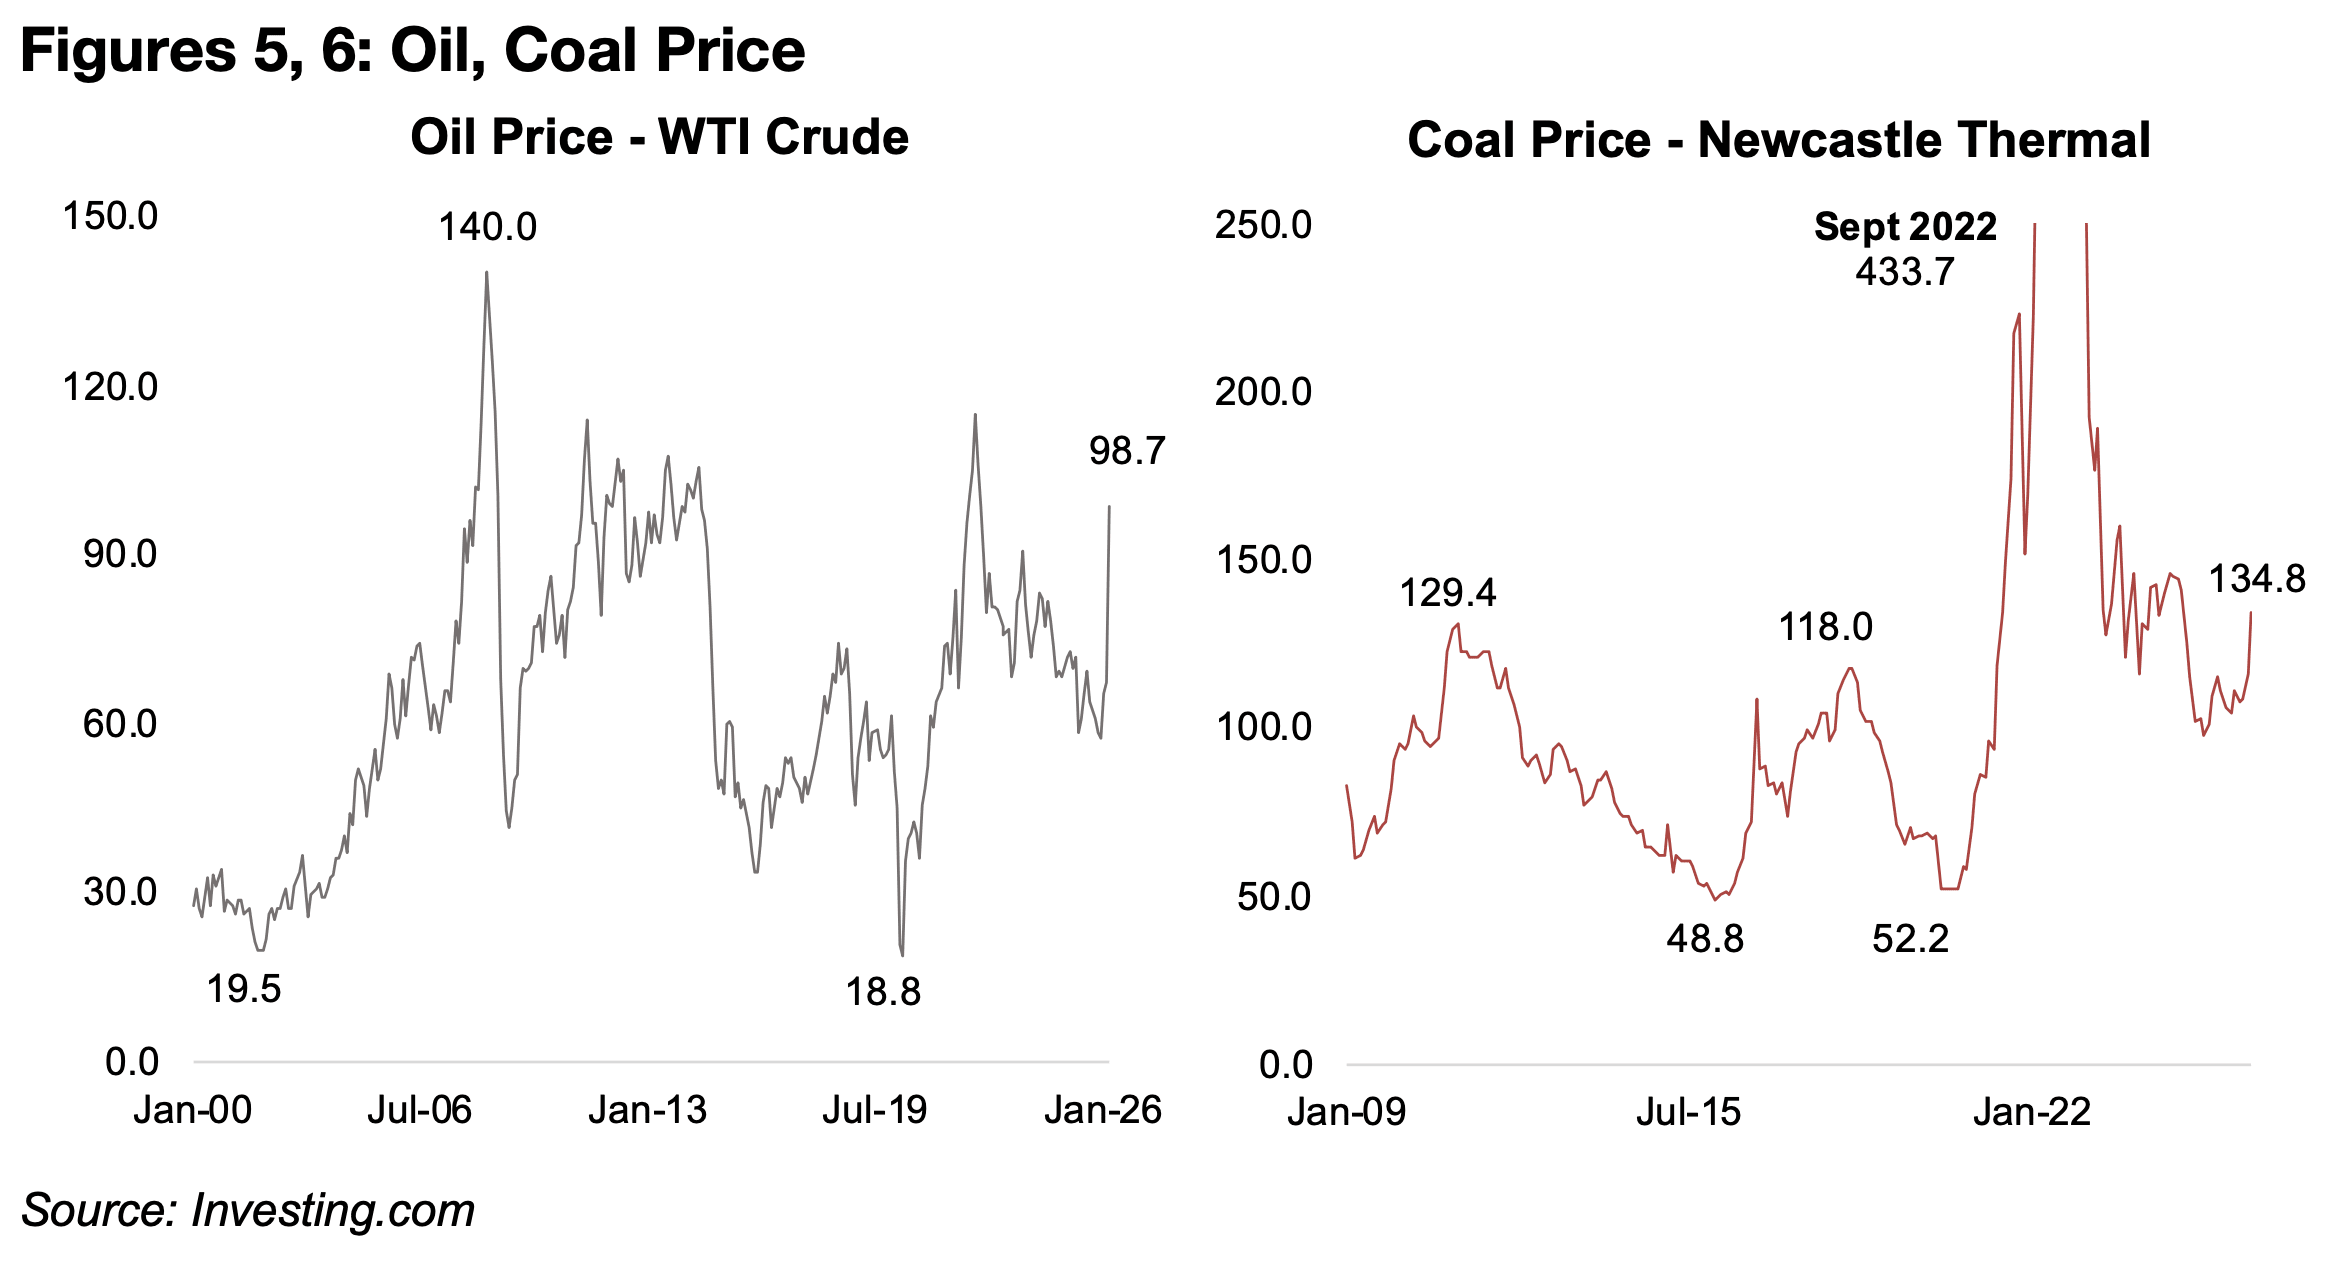
disrupted (Figure 4). The fossil fuel is now near the top of the price range for the past
twenty five years, having only been higher during the global health crisis in 2022 and
during a speculative spike in 2008 (Figure 5). There has been a major fall in the gold
to oil ratio to 48.4.x after the latter’s recent surge, with it looking excessive at its peak
of 88.9x in January 2026, three times the average of 2021-2025 of 29.9x (Figure 7).
The thermal coal price has also jumped by 26.5%, even though there is very little
production in the Middle East, on expected substitute demand, as power providers
may need to shift towards sources other than oil and gas. Coal is at its second highest
since 2009, with it only above the current level in 2022 (Figure 6). While the natural
gas price also rose, it is up only 6.2% this year, as over half of the market is regional,
shipping through pipelines, and less affected by international supply and demand.
The market is becoming more global, however, with over 40% from liquified natural
gas, which can be shipped internationally, but is considerably more expensive.
Aluminum prices have gained the most of the major metals over the past two weeks,
and are up 14.5% year to date, nearly even with gold. This has been driven by the
large proportion of the metal’s processing capacity in the Middle East, especially the
United Arab Emirates and Bahrain, which have both been hit in attacks. While the iron
ore price has rebounded since the conflict on some recovery in China demand, it is
up just 3.2% this year. Copper has declined over the past two weeks and is up just
2.7% this year, likely on lowered global demand expectations on rising costs.
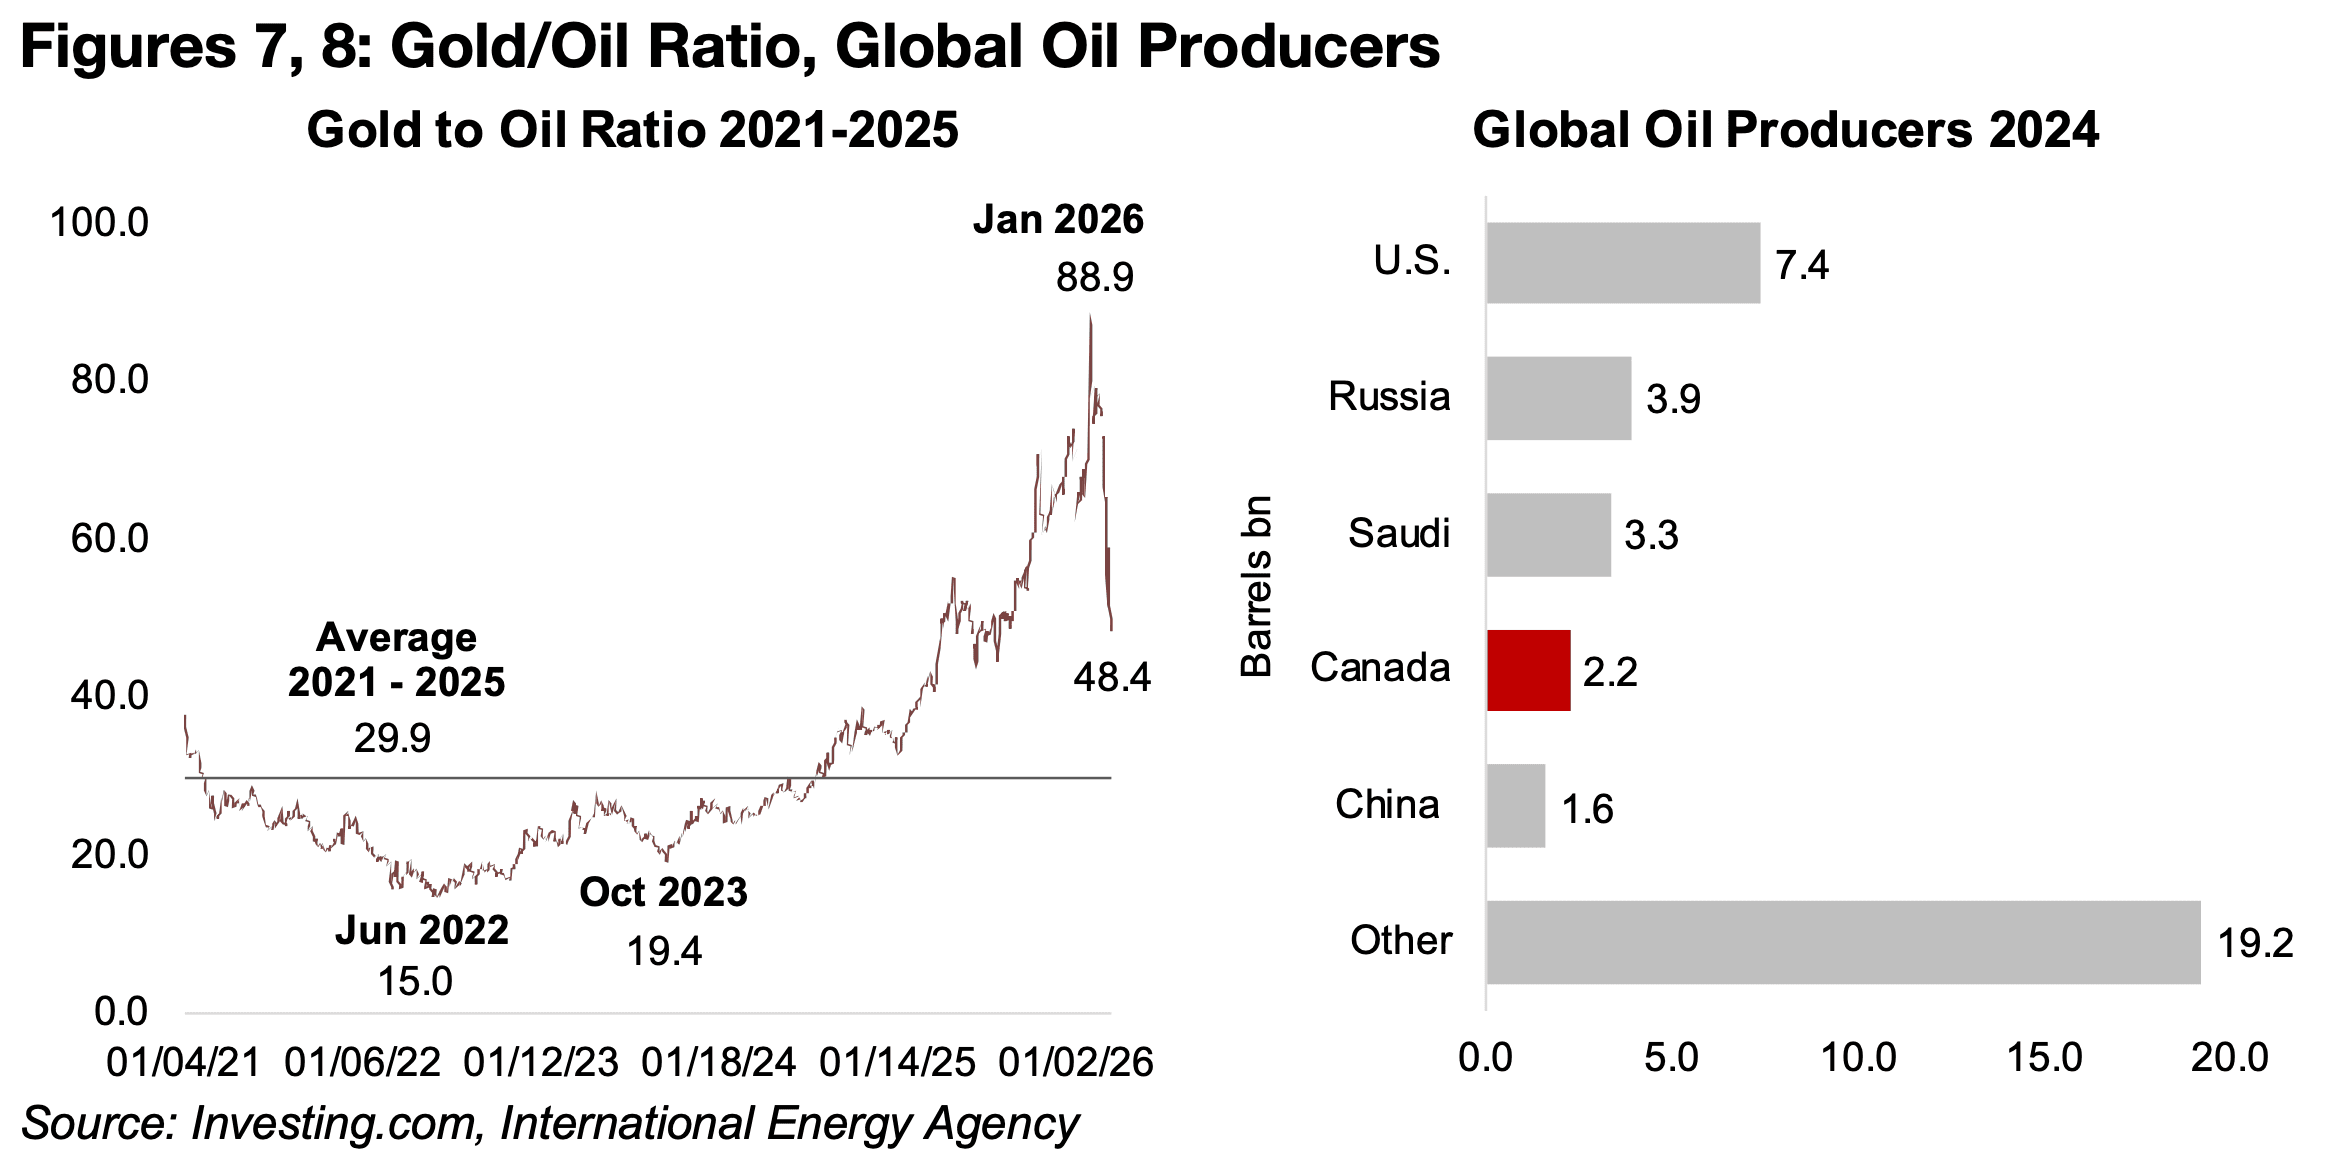
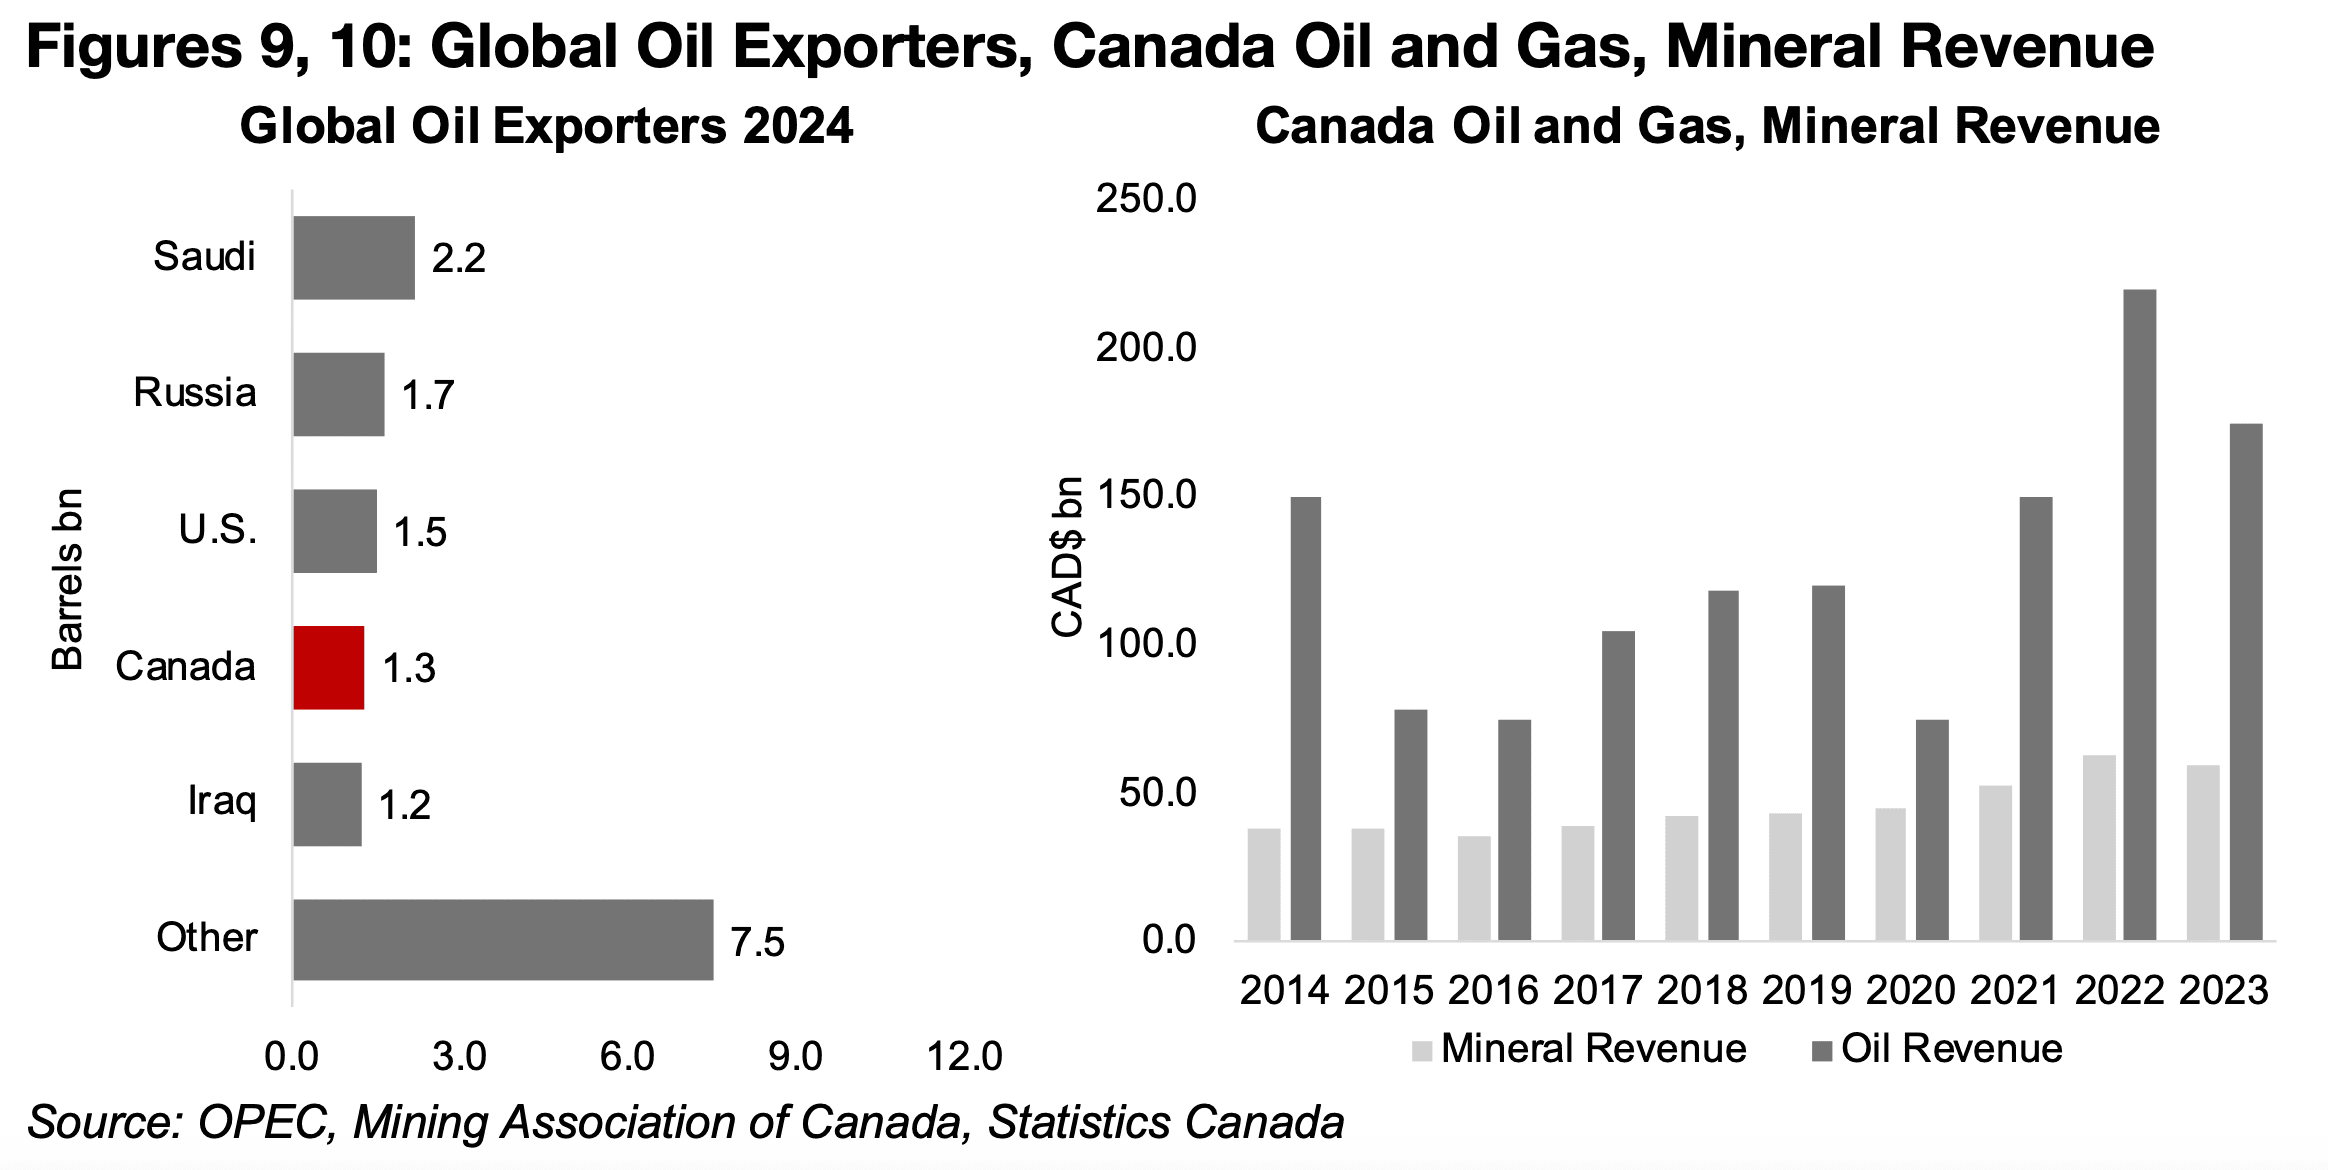
The higher oil price could actually be a significant benefit for Canada, which was the fourth largest global oil producer and exporter in 2024 (Figures 8, 9). The country could become an increasingly important source of oil supply especially for the U.S. and its allies as Iran is specifically blocking ships from these countries from the Straits of Hormuz. Revenue from the oil and gas business in the country averaged nearly three times the level of revenue from mineral production from 2014-2023. This suggests that rise in the former would provide a significantly larger economic boost which could far offset even a significant slowdown in the latter, although both industries are key drivers for the country.
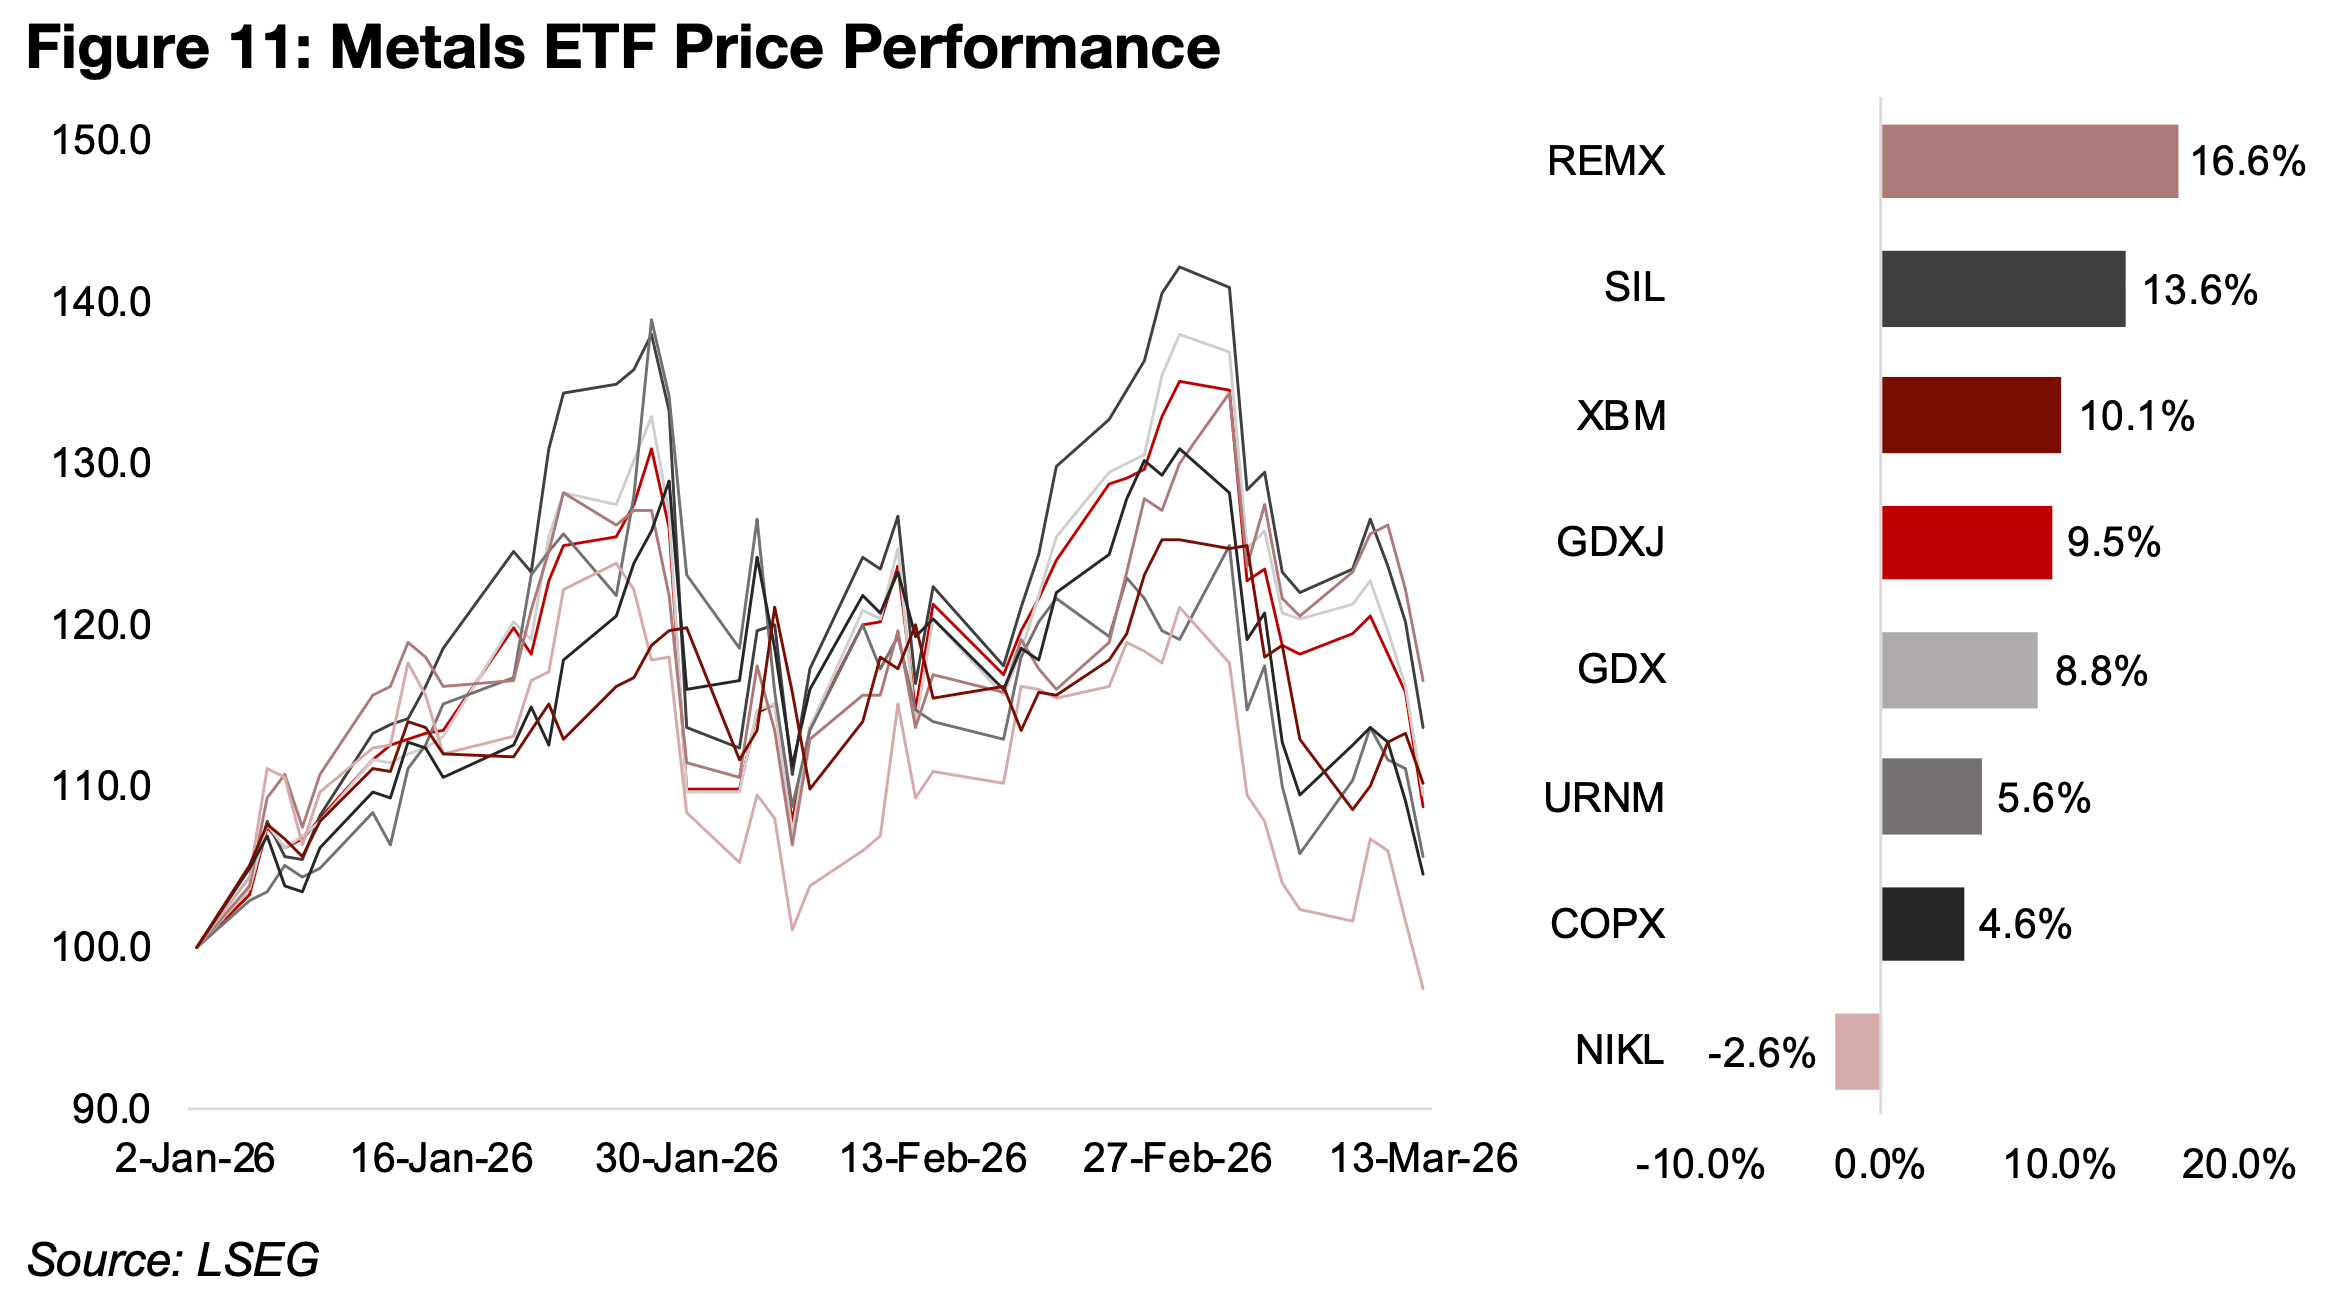
The mining sector globally could certainly be hit by rising energy costs, which are a substantial proportion of costs for the industry. The market has started to price this in to some degree already, with mining stock ETFs pulling back substantially from recent highs. The REMX ETF of rare earth stocks and SIL ETF of silver stocks have the highest gains for the year, up 16.6% and 13.6% (Figure 11). The XBM ETF of base metals stocks, and GDXJ and GDX ETFs of producing and junior gold stocks, are up by similar levels of 10.1%, 9.5% and 8.8%. The URNM ETF of uranium stocks and COPX ETF of copper stocks have lagged, up just 5.6% and 4.6%, while the NKCL ETF of nickel stocks has seen the only decline YTD, by -2.6%.
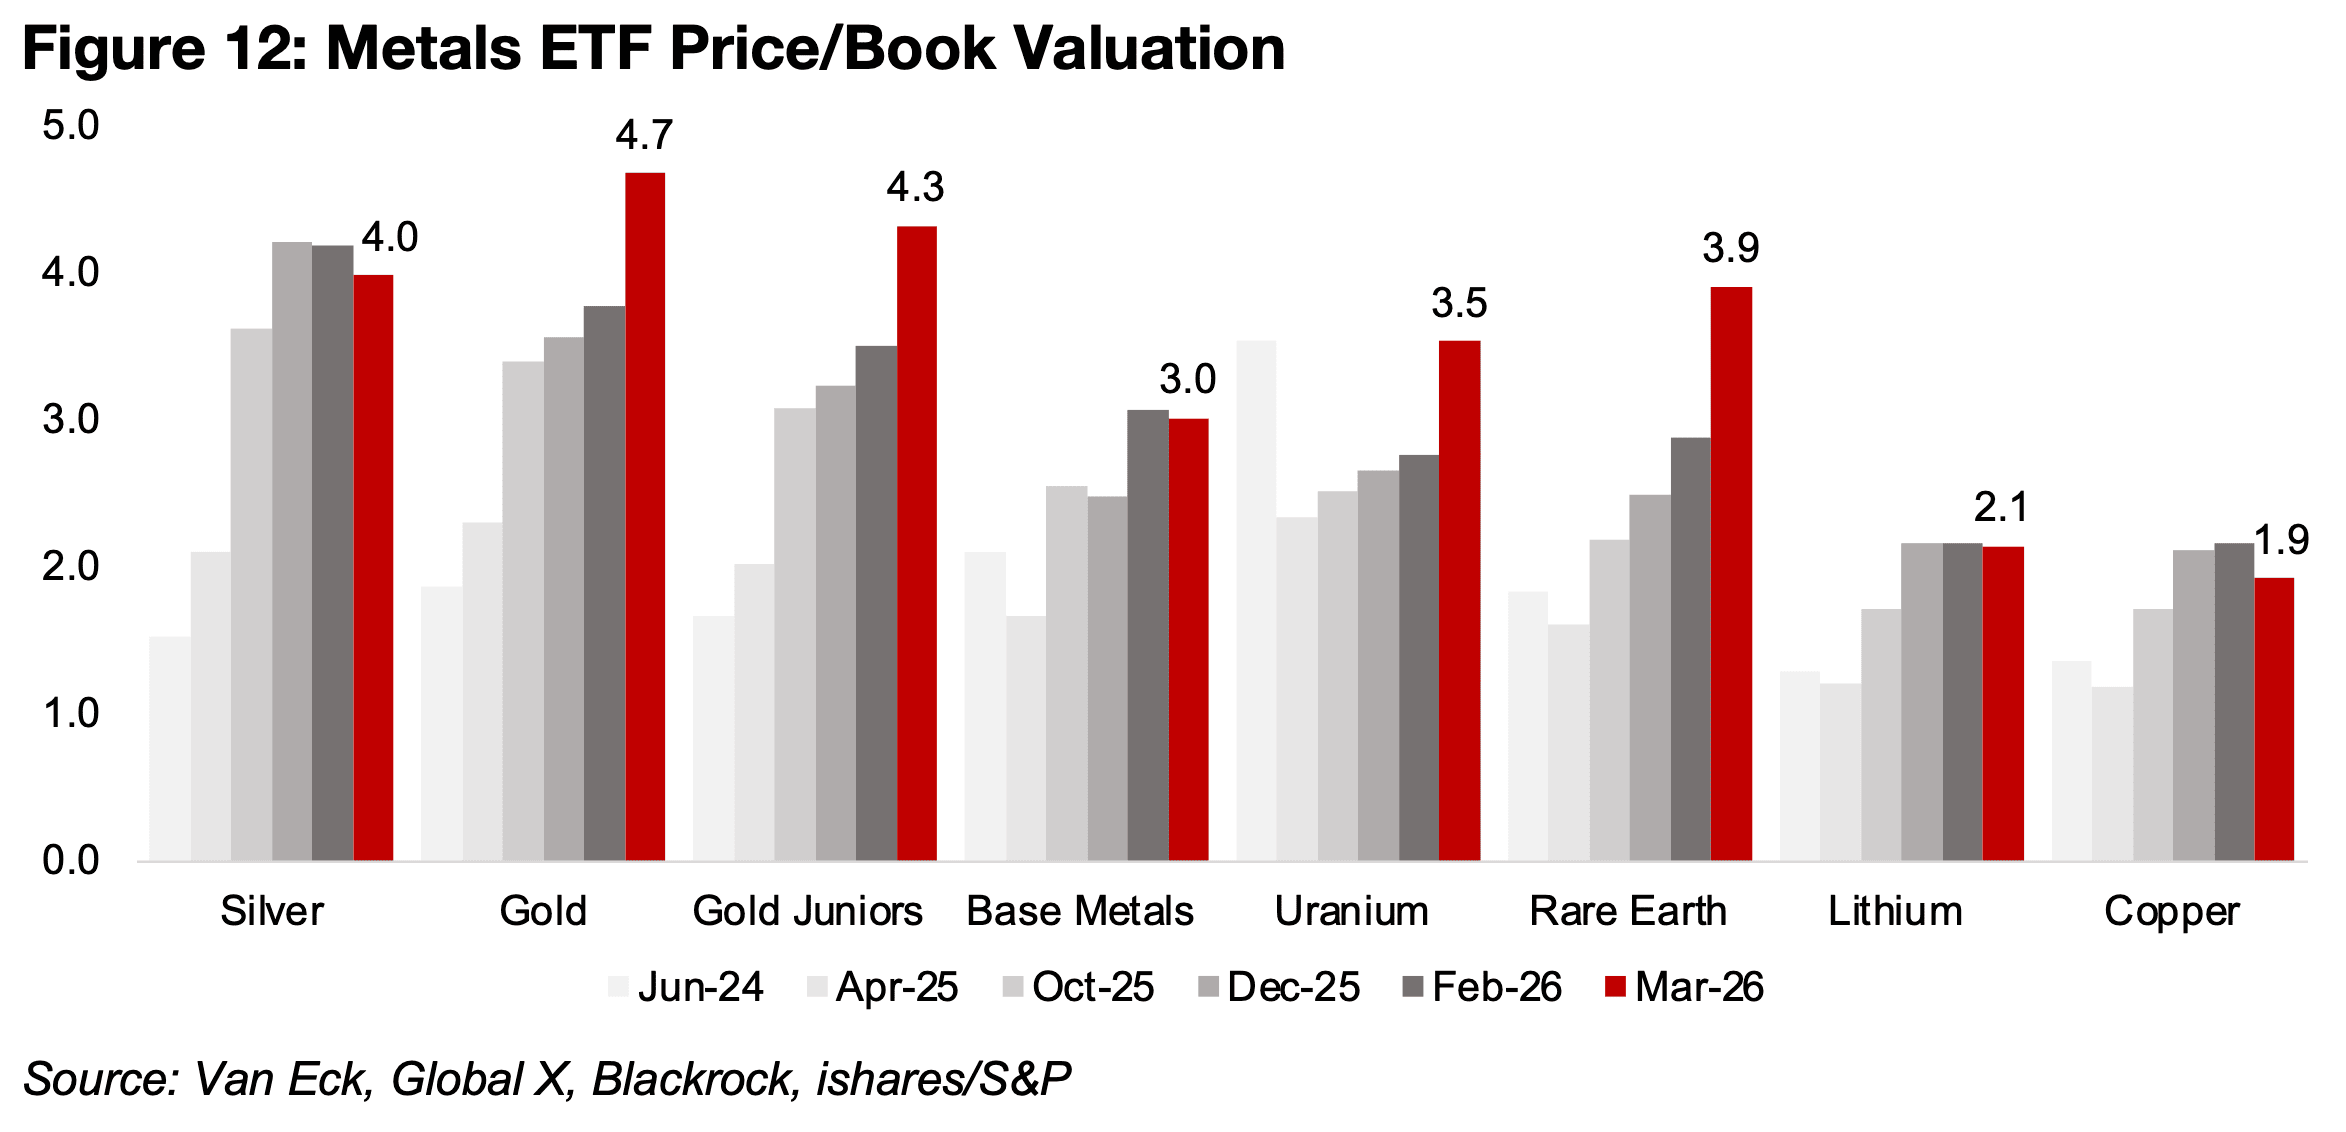
The valuations of the mining stocks have continued to rise, with the price to book
(P/B) multiple especially for the gold producers having jumped over the past month,
to 4.7x (Figure 12). With a multiple above 3.0x generally considered as starting to
enter expensive territory, the gold producers are certainly no longer cheap, unless
there is a further major increase in the gold price. The P/B for the gold juniors has
also jumped to 4.3x, only slightly below the producers, which could be partially
accounted for by the higher risk of these smaller companies.
Both the rare earth and uranium P/Bs have also jumped, to 3.5x and 3.9x, and are
starting to look relatively expensive. The multiples for the silver and base metals
stocks have edged down, with the former still relatively high, and latter just towards
the top of moderate valuation levels. Both the copper and lithium sector valuations
have also edged down and are the only sectors still with relatively low valuations.
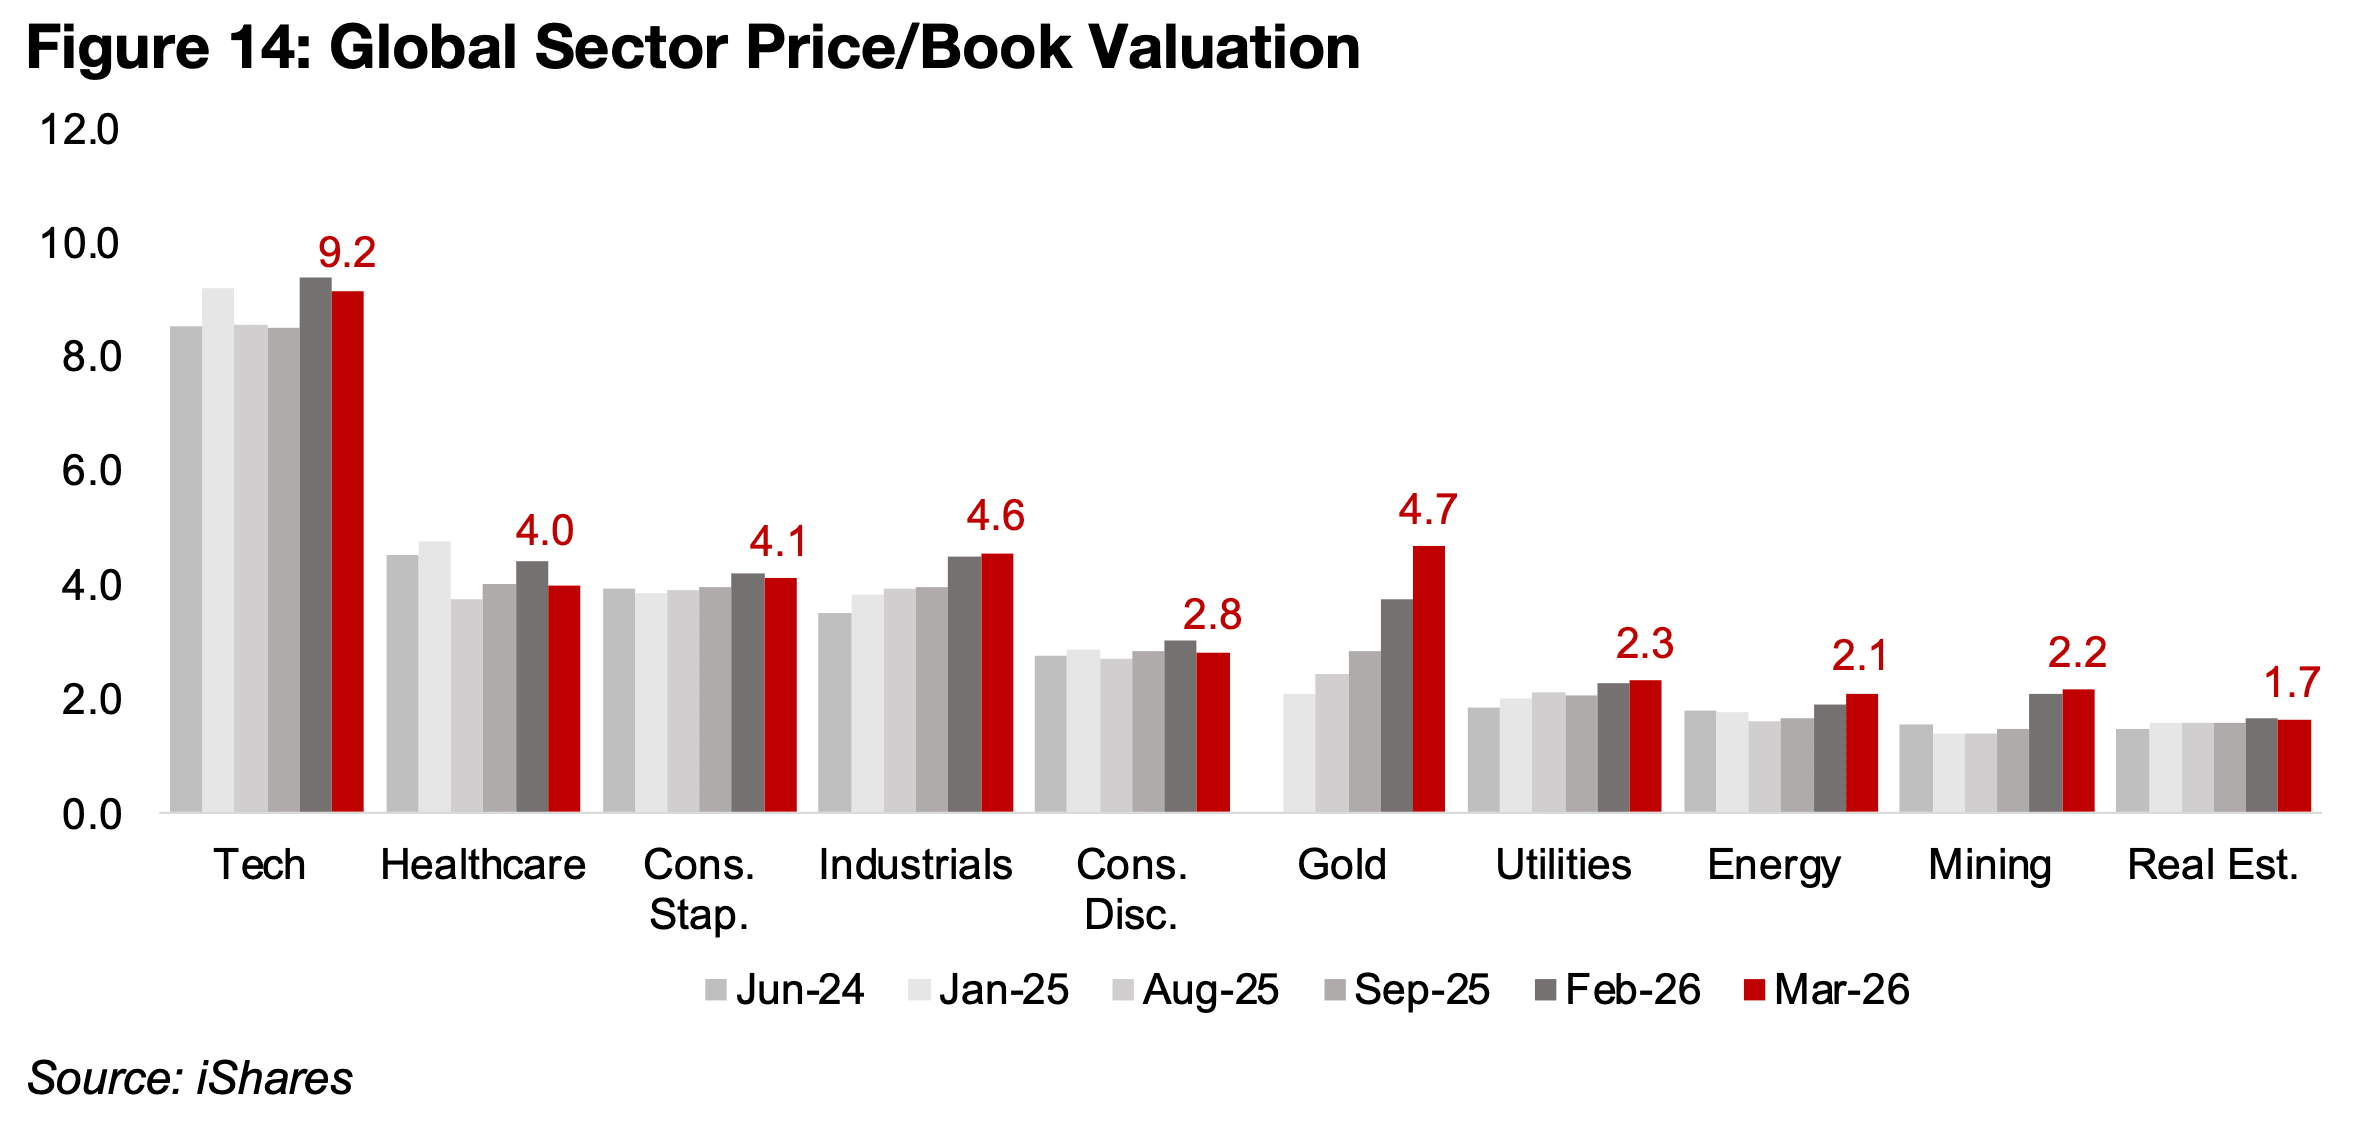
There has been a clear shift into global energy so far this year, with the stock ETF for the sector up 26.1%, more than doubling the other major sectors, and this shift had already started even before the Middle East conflict began (Figure 13). This has partly been from the very low valuations of the sector, with a price to book of only 2.1x even after the recent rise in the sector (Figure 14). In contrast, the gold sector has slumped over the past week, leaving it up just 8.8% for the year, partly on now quite high valuations. The sector’s price to book of 4.7x now puts it above all the major sectors except for tech, which is extremely elevated at 9.2x, a significant shift from September 2025, when its P/B was significantly below the healthcare, consumer staples and industrials sectors, which all have relatively high valuations.
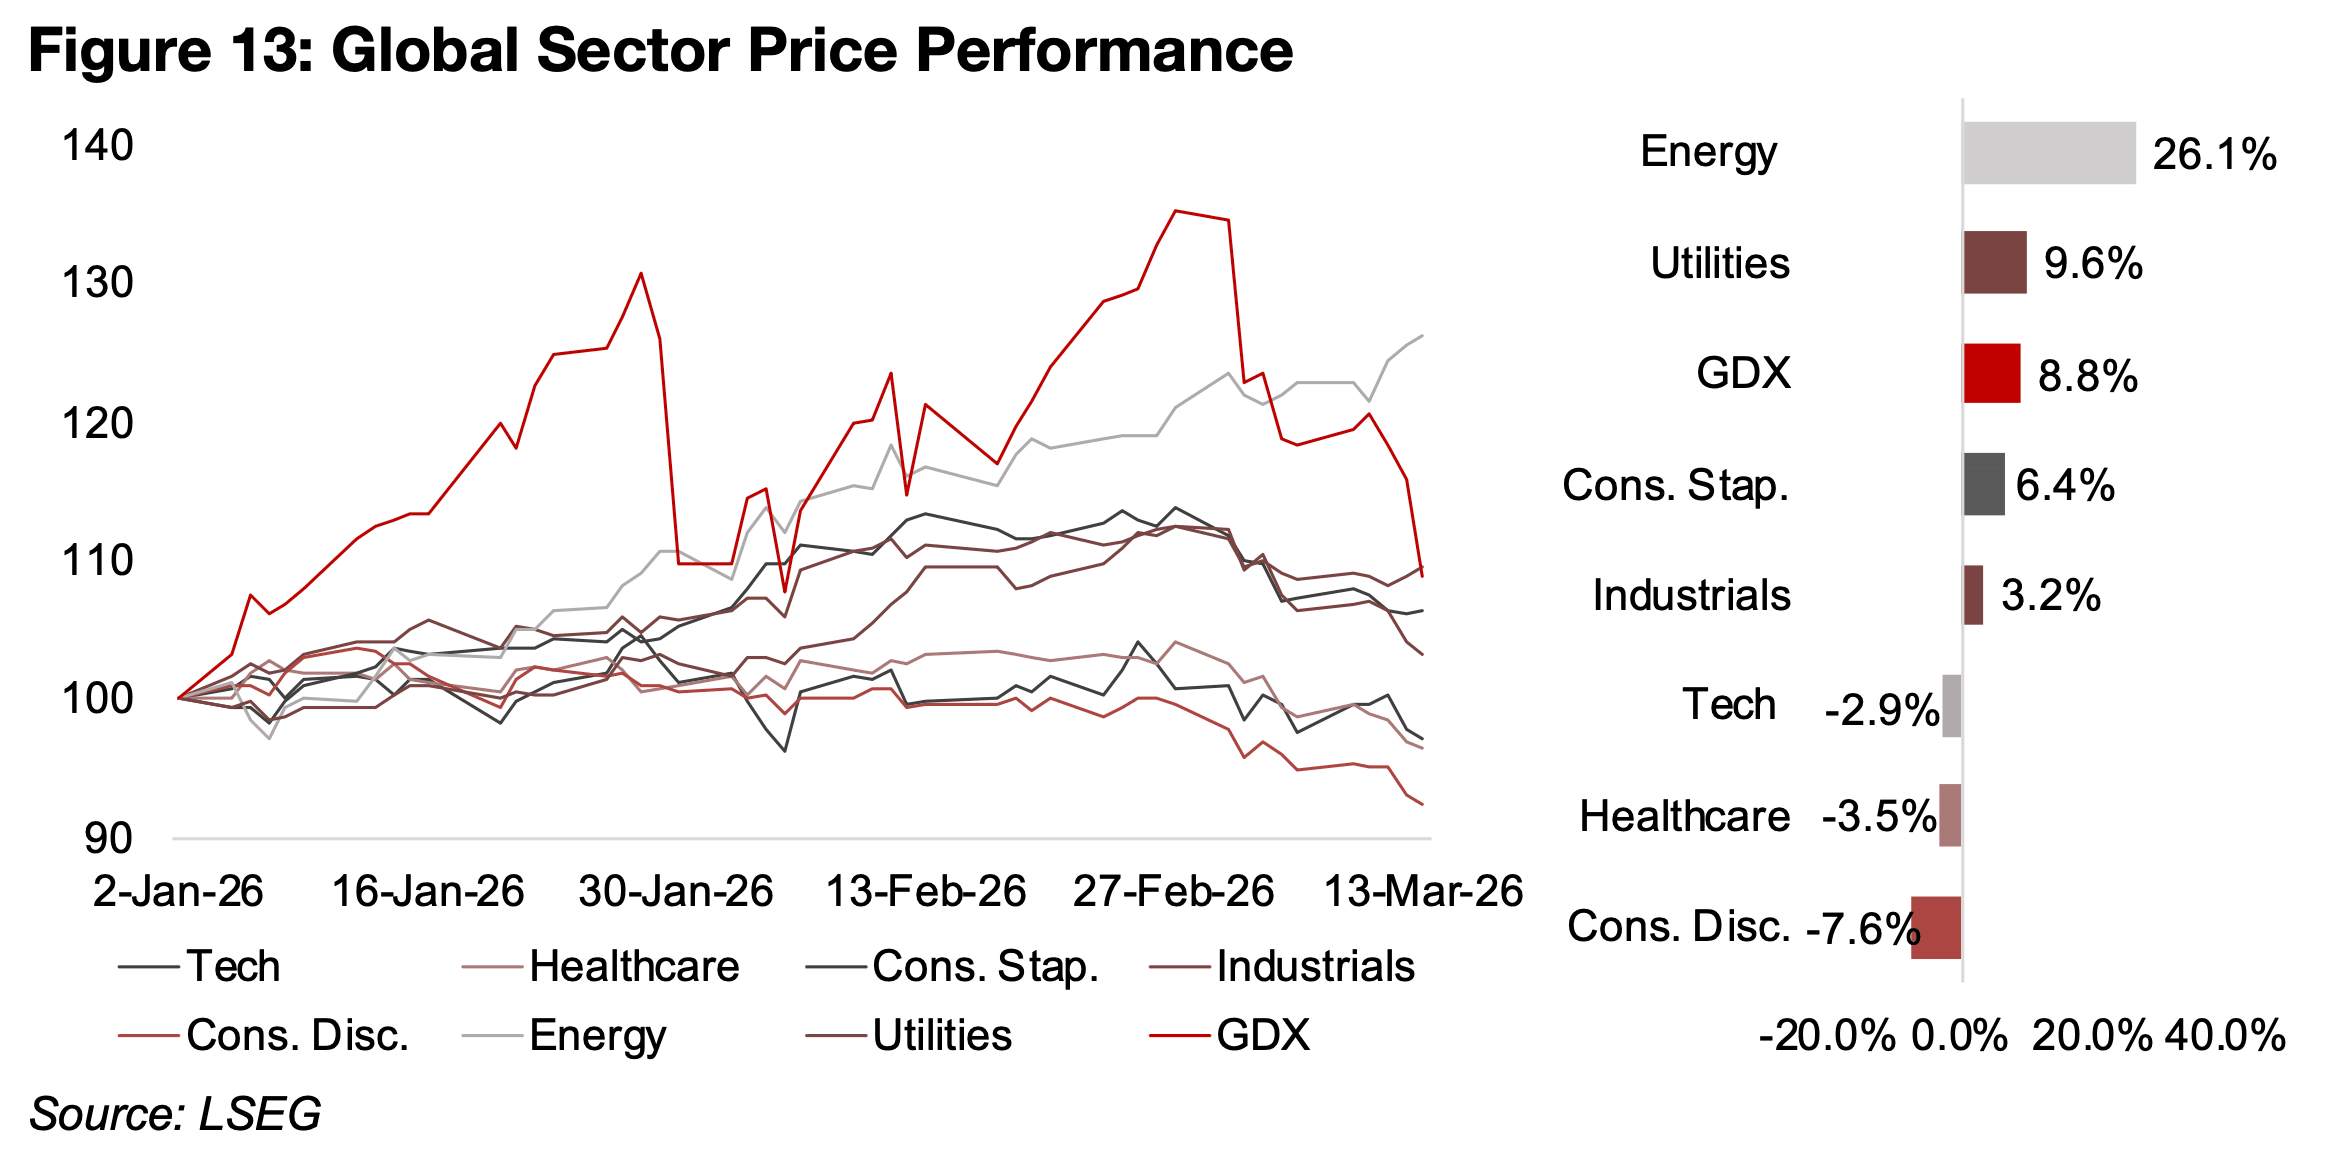
The industrials, tech and healthcare sectors have all underperformed, up 3.2% and down -2.9% and -3.5%, respectively, as the relatively high valuations, especially for tech, weigh on the sectors. The relative strength in the defensive utilities and consumer staples sectors, up 9.6% and 6.4%, respectively, so far in 2026, show the market shifting away from risk. While last year, this type of hedging was often balanced with risk on moves, especially into the tech, this sector seems to have finally fallen out of favor in 2026 for the first time in many years. While gold itself will still likely remain a key hedge for the market, gold stocks could see pressure from the combination of potentially higher costs and high valuations.
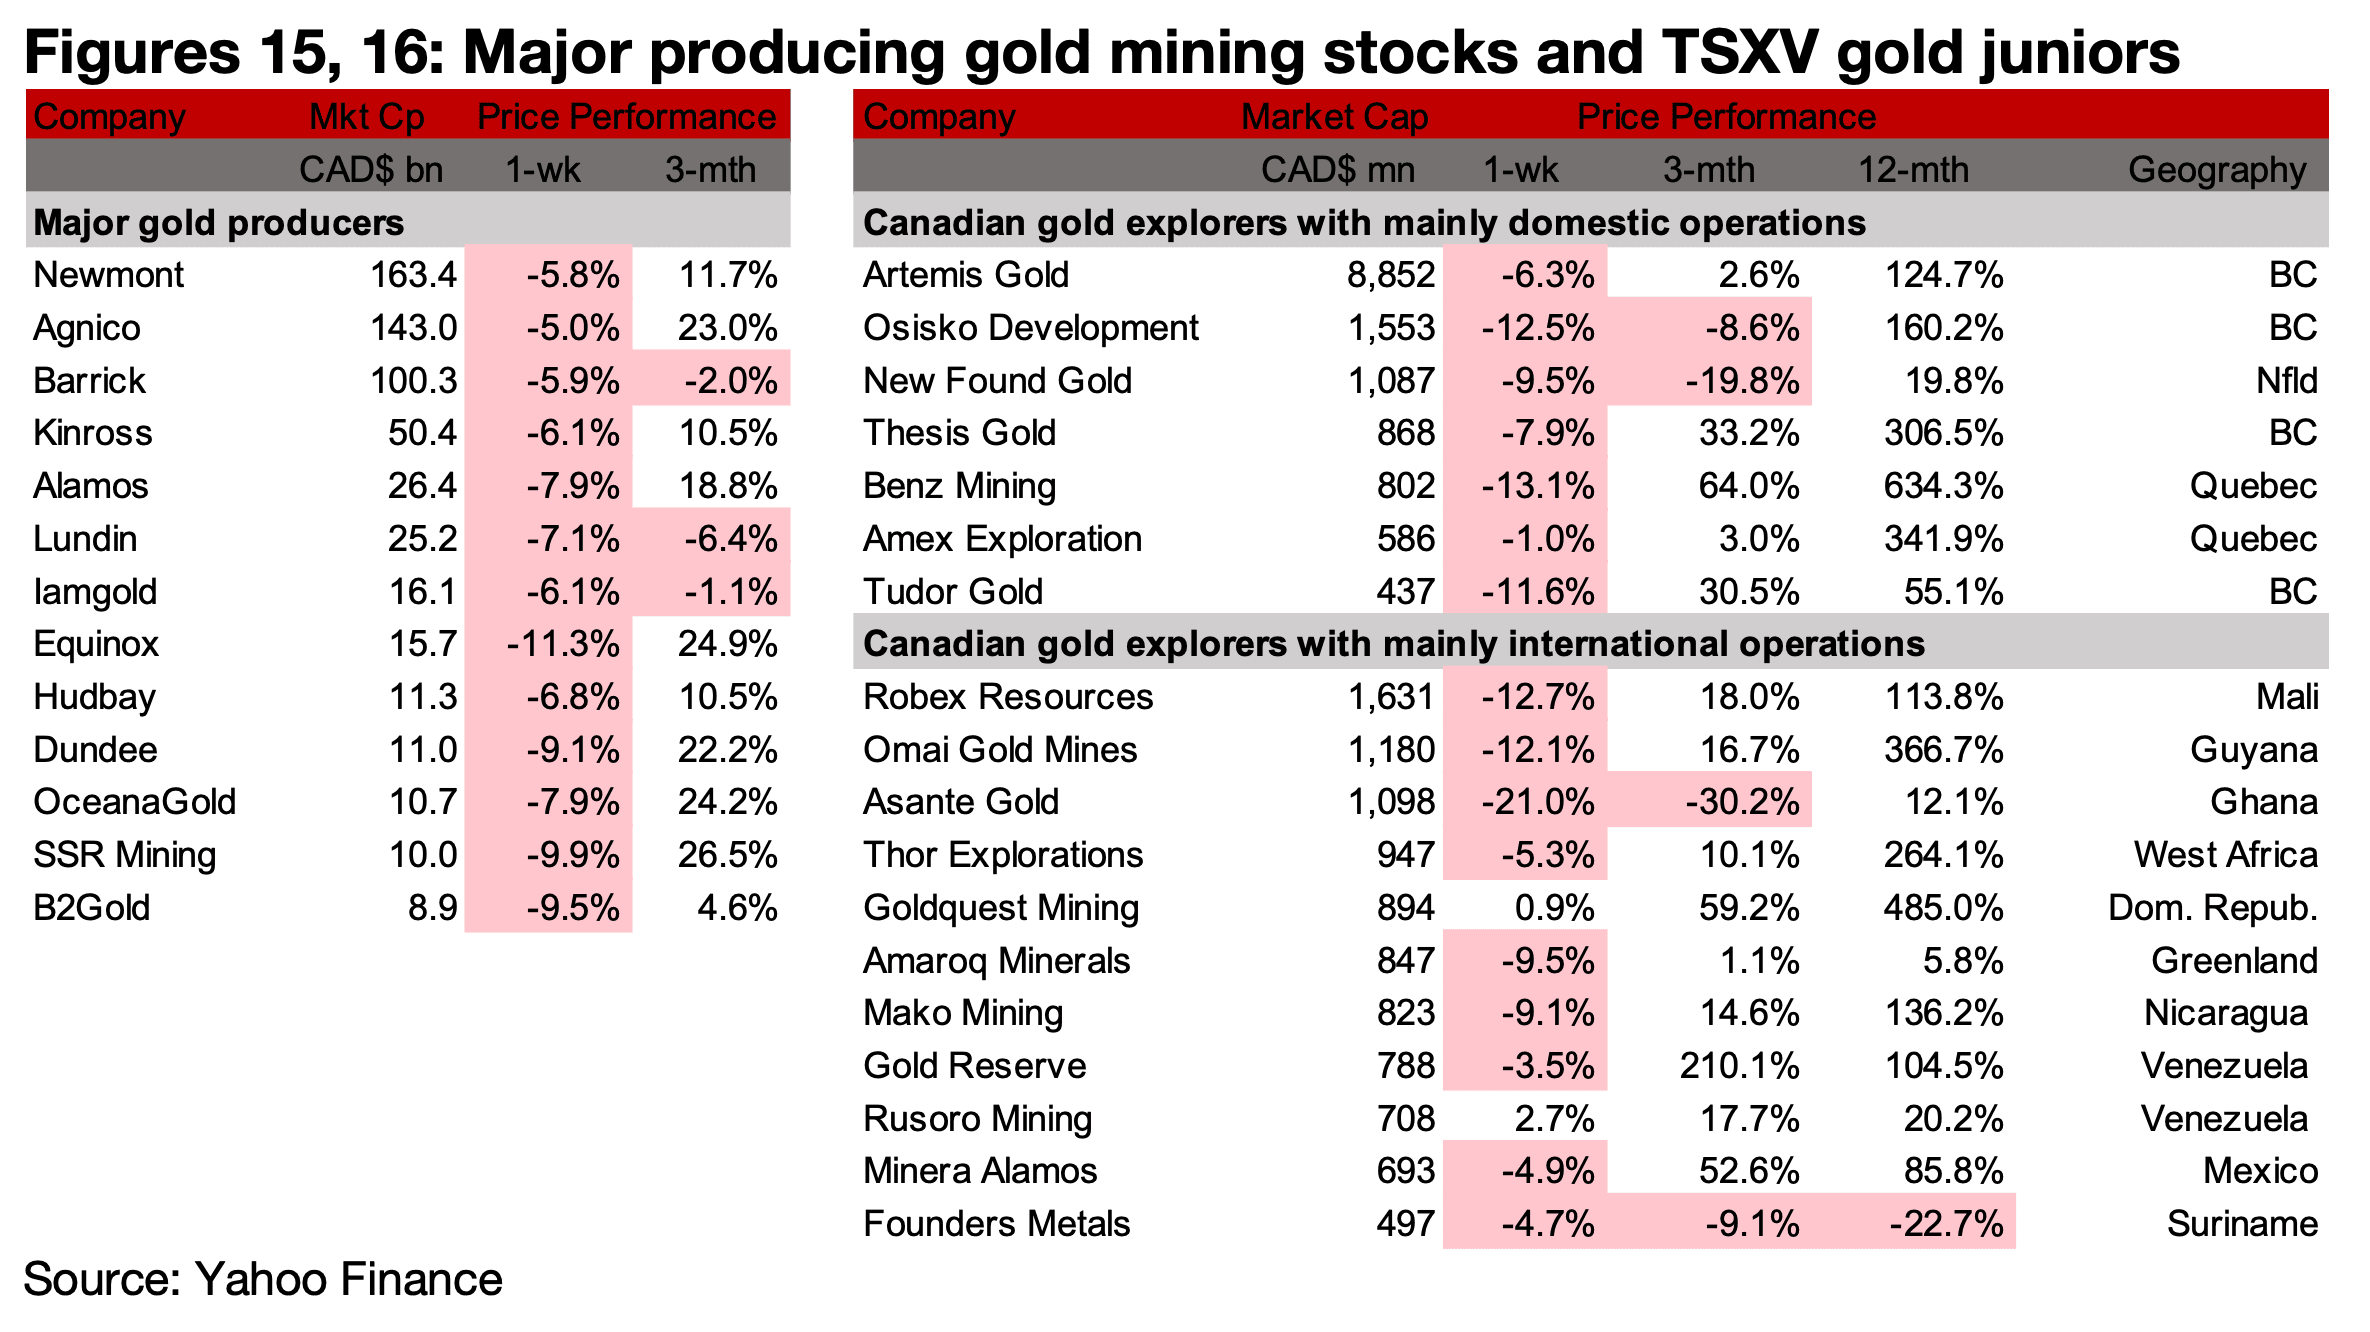
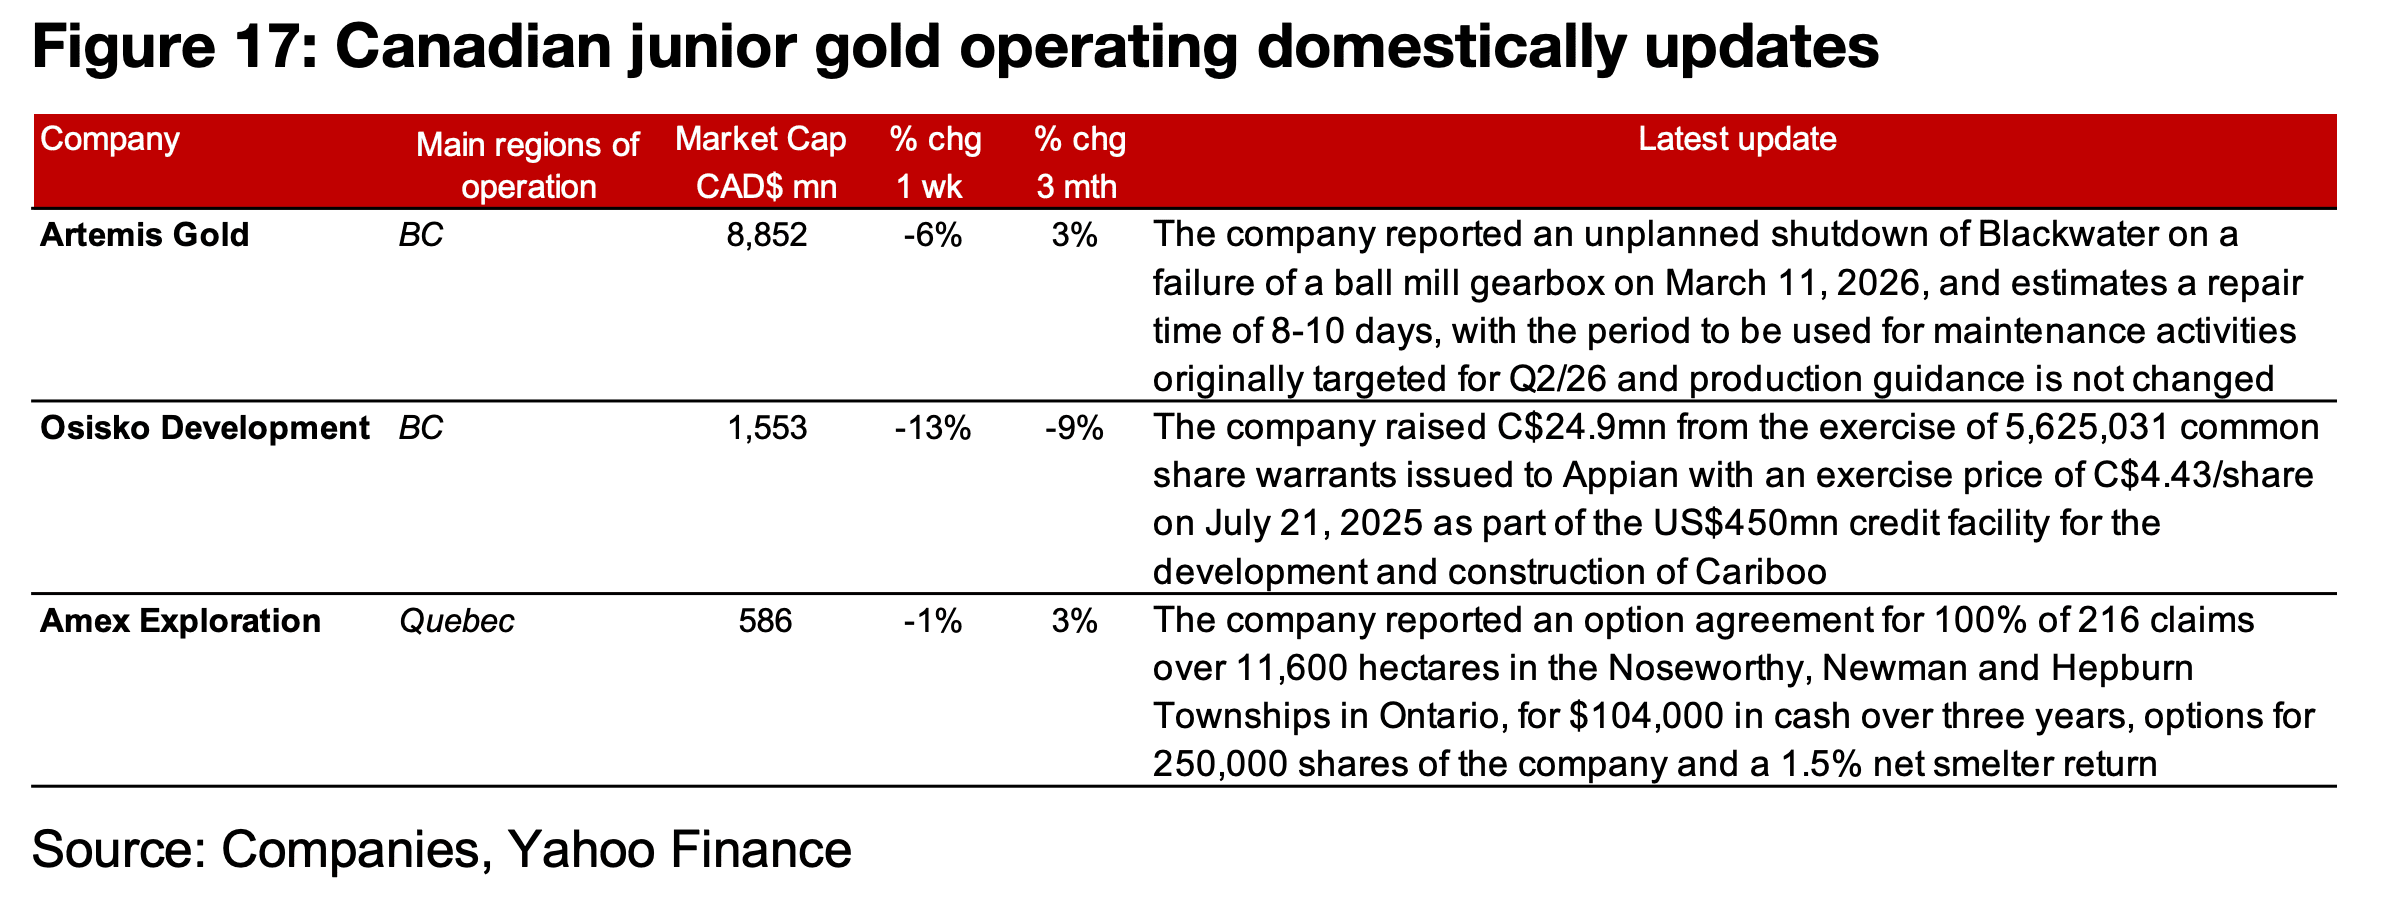
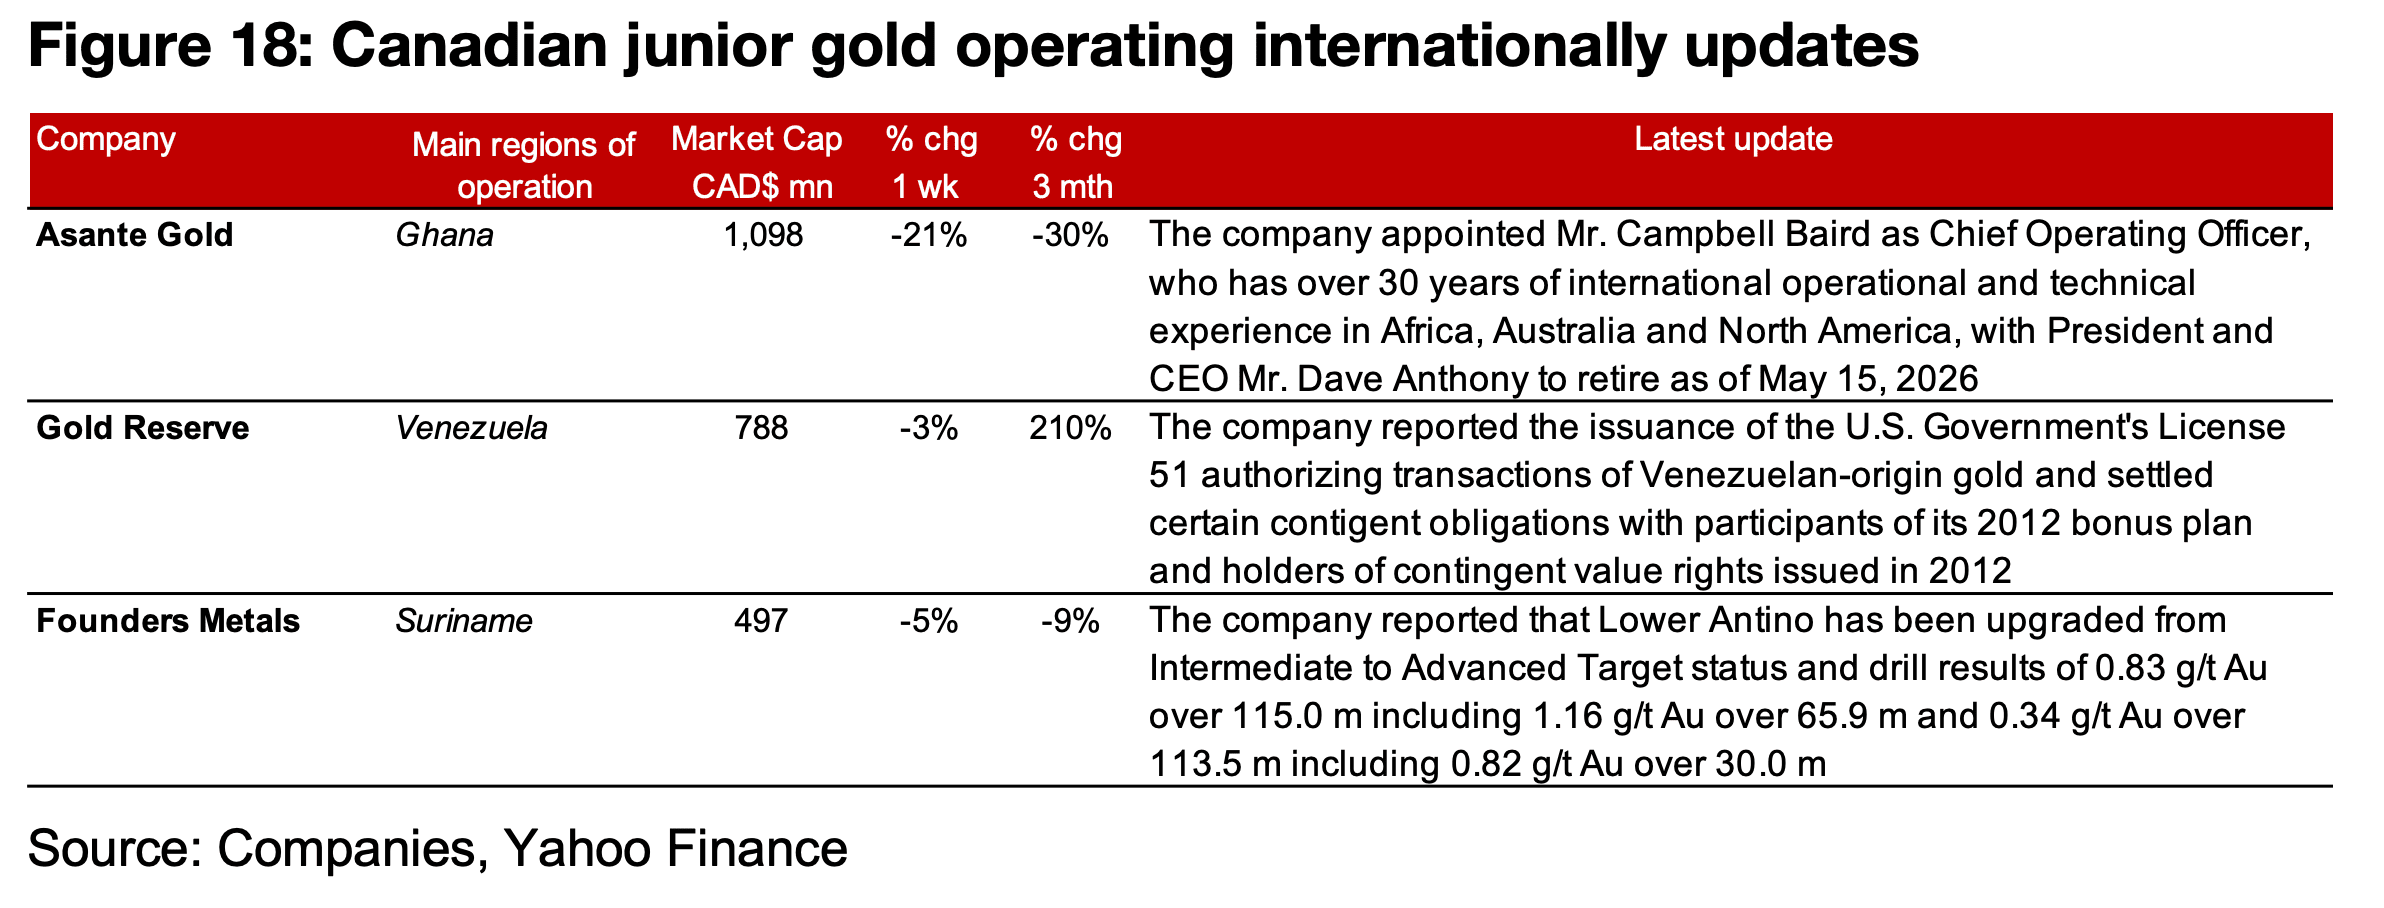
All of the major producers and most of TSXV gold saw major declines on the drop in the gold price and rising cost concerns (Figures 15, 16). For the TSXV gold companies operating mainly domestically, Artemis Gold reported an unplanned shutdown at Blackwater on equipment failure with 8-10 days for repair expected, Osisko Development raised C$24.9mn from the exercise of warrants, and Amex Exploration entered an option agreement for claims at Noseworthy, Newman and Hepburn townships in Ontario (Figure 17). For the TSXV gold companies operating mainly internationally, Asante appointed Mr. Campbell Baird as Chief Operating Officer and the retirement of President and CEO Mr. Dave Anthony, Gold Reserve reported the issuance of a the U.S. Government’s License for Venezuelan-origin gold transactions and settled contingent obligations from 2012 and Founders upgraded Lower Antino from Intermediate to Advanced Target status and reported drill results from the project (Figure 18).
Disclaimer: This report is for informational use only and should not be used an alternative to the financial and legal advice of a qualified professional in business planning and investment. We do not represent that forecasts in this report will lead to a specific outcome or result, and are not liable in the event of any business action taken in whole or in part as a result of the contents of this report.
Author
Ben McGregor authors the Weekly Roundup at CanadianMiningReport.com, providing sharp analysis of the metals and mining sector. With a talent for spotting trends, Ben distills complex market shifts into clear, engaging insights on TSXV junior miners. His weekly updates cover gold, copper, uranium, and more, blending data-driven perspectives with a knack for identifying opportunities. A vital resource for investors, Ben’s work navigates the dynamic junior mining landscape with precision.