
April 15, 2024
Gold rose 1.3% to US$2,356/oz after pulling back from an intra-day high near US$2,450/oz on the last trading day of the week as mixed US inflation data saw market expectations fall to just over 25% for US Fed rate cuts by June 2024.
This week we look at the factors that could continue to drive gold’s parabolic recent move, which is still muted compared to historical jumps, including loosening financial conditions, strong central bank buying, rebounding ETF inflows and political risk.
Gold stocks only edged up this week after a huge month-long rally, as mixed inflation data concerned markets and dragged down equities and the metal price made only moderate gains in the context of recent moves, while TSXV gold stocks were mixed.


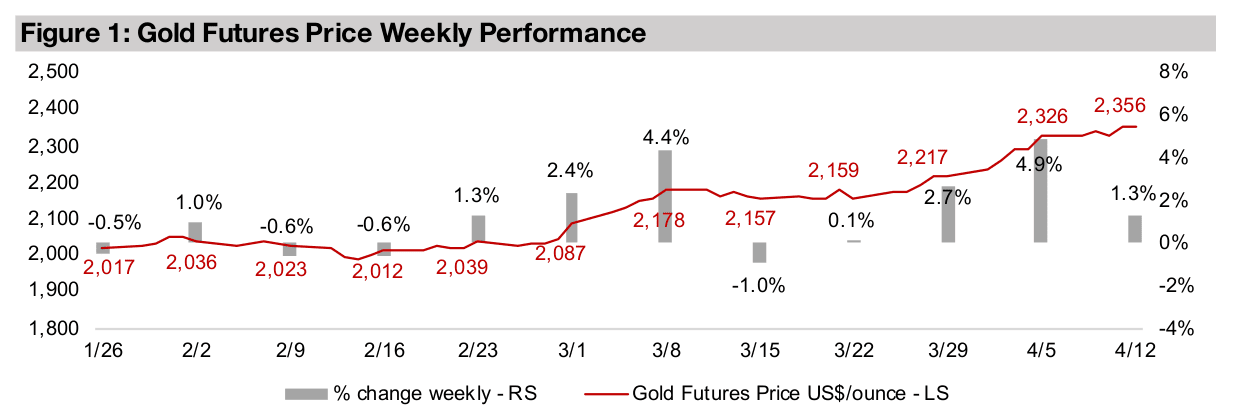
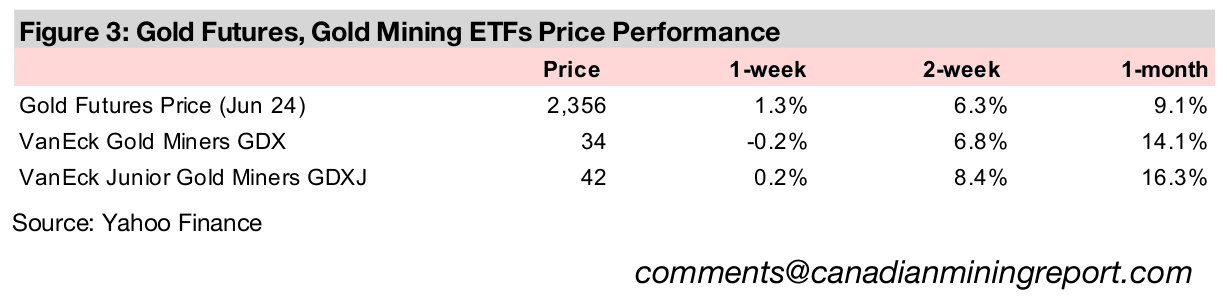
The gold futures price rose 1.3% to US$2,356/oz, and nearly reached US$2,450/oz
in intraday trading on the last day of the week before pulling back. This came as the
markets were shaken first by a hot US CPI inflation print surpassing expectations and
then more dovish US PPI inflation data. The major US equity markets fell, with the
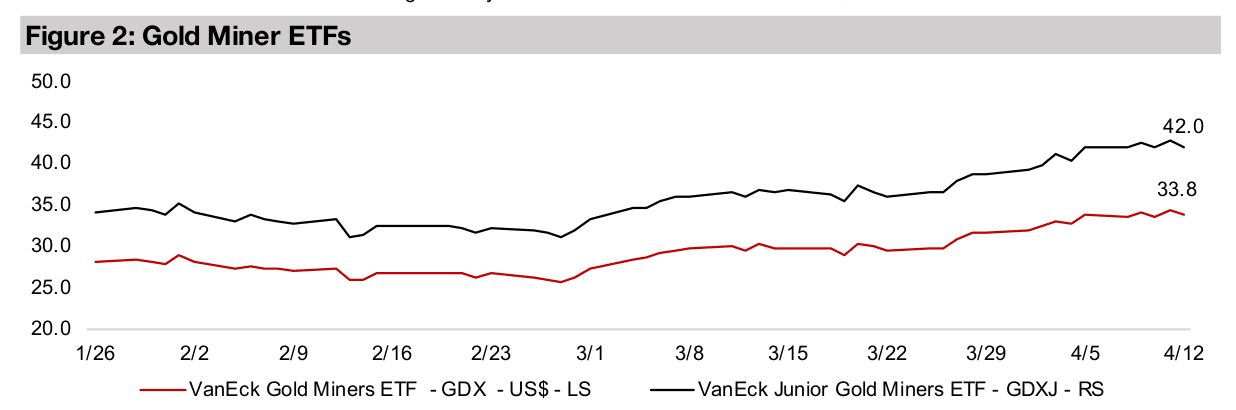
S&P 500 off -1.7%, Nasdaq down -0.7% and Russell 2000 sliding -3.5%. Gold stocks
finally consolidated after a month-long surge, with the GDX down -0.2% and GDXJ
edging up 0.2% on a relatively muted metal price gain and weak equities.
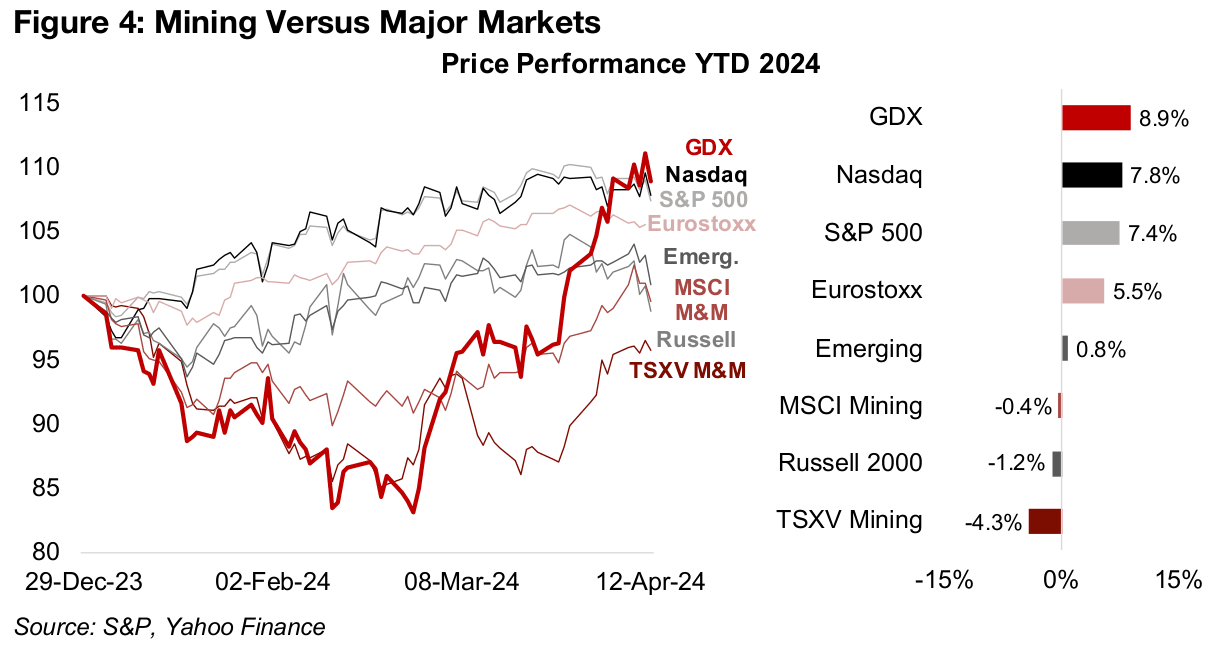
The gold stock rebound has been intense, with the sector ending February 2024 with
the worst performance year to date versus several major markets and the mining
sector but having since shot up to the highest gains. The rebalancing we have been
expecting for several months between overvalued US tech and undervalued mining
stocks, especially the gold sector given the strong metal price, finally seems to be
underway. The GDX ETF of gold producers is up 8.9% year to date, surpassing the
7.8% gain in the Nasdaq and 7.4% rise in the S&P 500, and strongly outpacing 5.5%
and 0.8% gains in European and emerging markets, respectively (Figure 4).
While the rest of the mining stocks have still been struggling, even they have reversed
much of their losses from earlier this year. The MSCI Metals and Mining ETF is now
near flat for the year, but is still facing pressure from heavy exposure to plummeting
iron ore prices, the weakest performing major metal, down -22% (Figure 5). The
S&P/TSXV Metals and Mining Index, while having a strong exposure to the recovery
in gold, lithium and copper, is still down -4.3%, in part because of weakness in small
cap equities overall, with the Russell 2000 down -1.2% for the year.
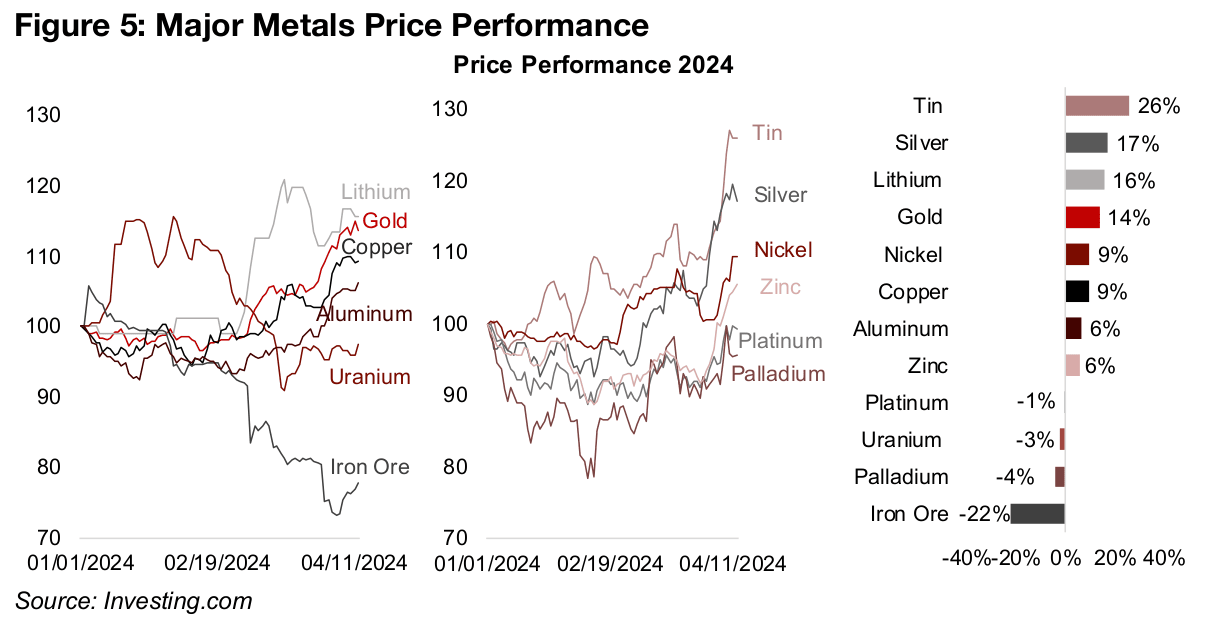
The plunge in iron ore has been an anomaly among the metals, which have ranged from significant gains to near flat performances this year. Tin, silver and lithium, up 26%, 17% and 16% have all outpaced gold, with the major driver appearing to be rising market concerns over a resurgence in inflation. A rebound in oil prices has been a key factor driving up US CPI inflation from a low of 3.0% in January 2024 to 3.5% in March 2024 (Figure 6). While the US Fed focuses more on core inflation for rate decisions than this headline figure, this metric also shocked the market, rising to 3.9% in March from 3.8% in, driving down expectations for a US rate cut in June 2024 to just over 25% from over 50% just a few weeks ago.
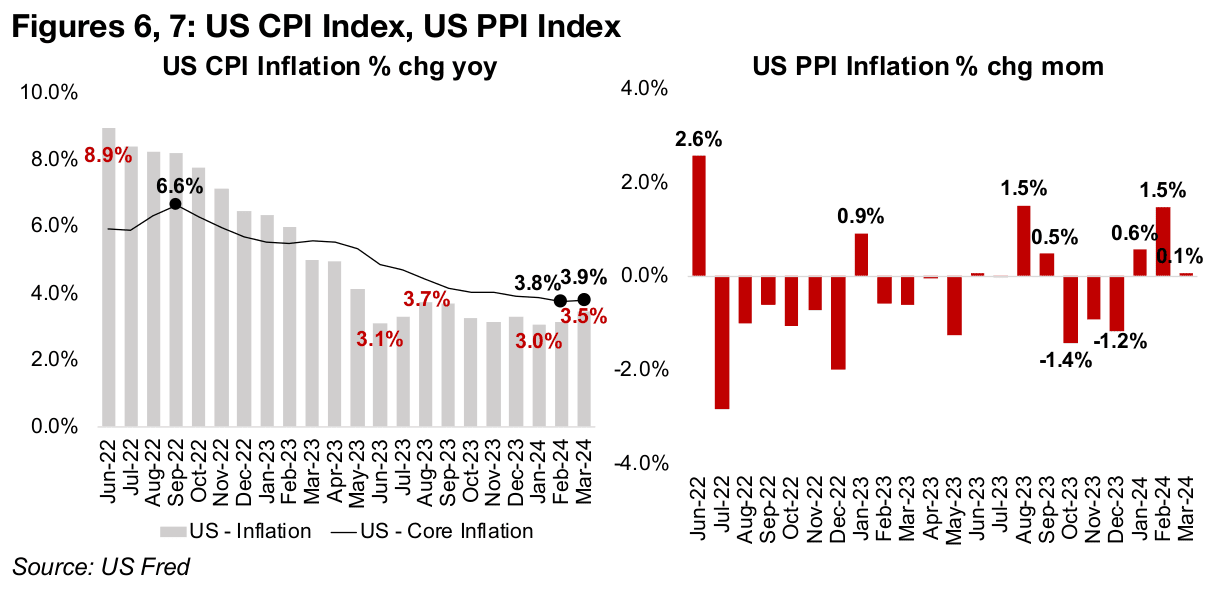
The US PPI data did provide some relief from the shock of the US CPI inflation data, coming in nearly flat month on month after two months of relatively strong gains (Figure 7). However, it was still not enough to curb the market’s likely overall sense that the risk of resurging inflation is rising, especially given the racheting up of tensions in the Middle East and the potential for oil supply disruption.
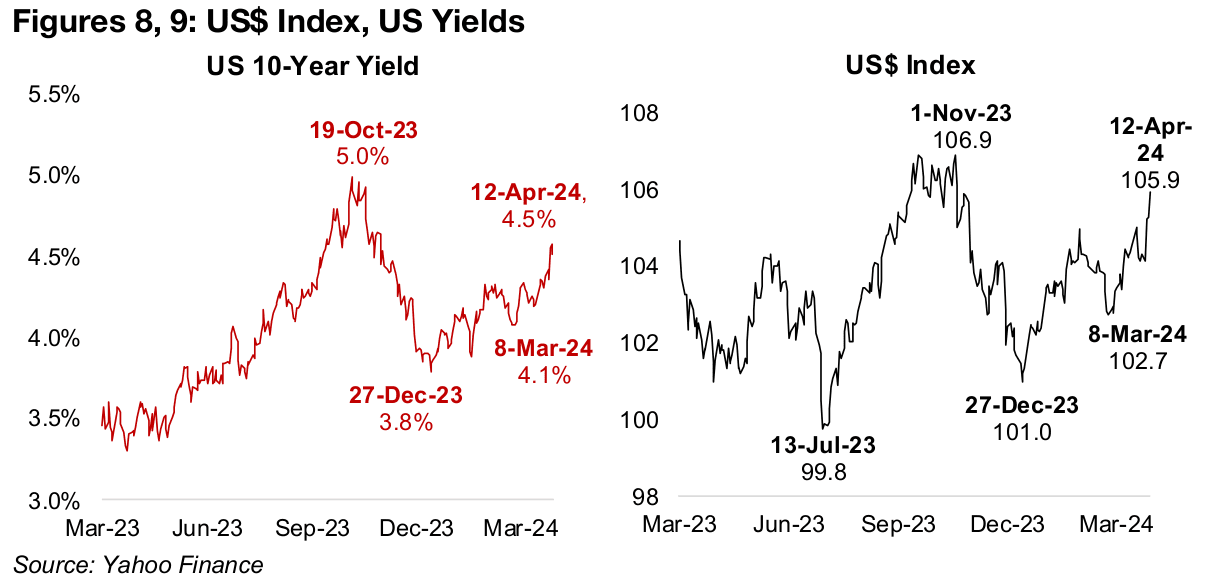
The market’s concerns that rates may not decline as fast as previously expected this year, or even be reduced at all, has pushed up US 10-year yields to 4.5%, nearly a percent above the 3.8% December 2023 lows, and heading towards 5.0% October 2023 highs (Figure 8). This has also driven up the US Index, to 105.9, up from December lows of 101.0, and verging on November 2023 highs of 106.9 (Figure 9).
While both the surging yields and dollar might initially be thought to be strongly
negative drivers for gold, this has not been the case. One reason is that gold is
affected not just by nominal yields alone, but rather by real yields, or nominal yields
minus inflation. As real yields rise, the opportunity cost of holding yieldless gold
versus bonds rises, and as real yields fall, gold becomes relatively more attractive.
US 10-year real yields peaked as far back as October 2023 at 1.55%, when nominal
yields reached highs of 4.80% and inflation was 3.25%, after having been as low as
-6.4% in March 2022, and turning positive in June 2023 (Figure 10). However, they
have declined in March 2024, with average nominal yields near flat for the month and
inflation rising. While US nominal yields have rebounded in late March and early April,
CPI inflation may have also increased given a continued rise in oil, so real yields could
potentially remain relatively flat this month.
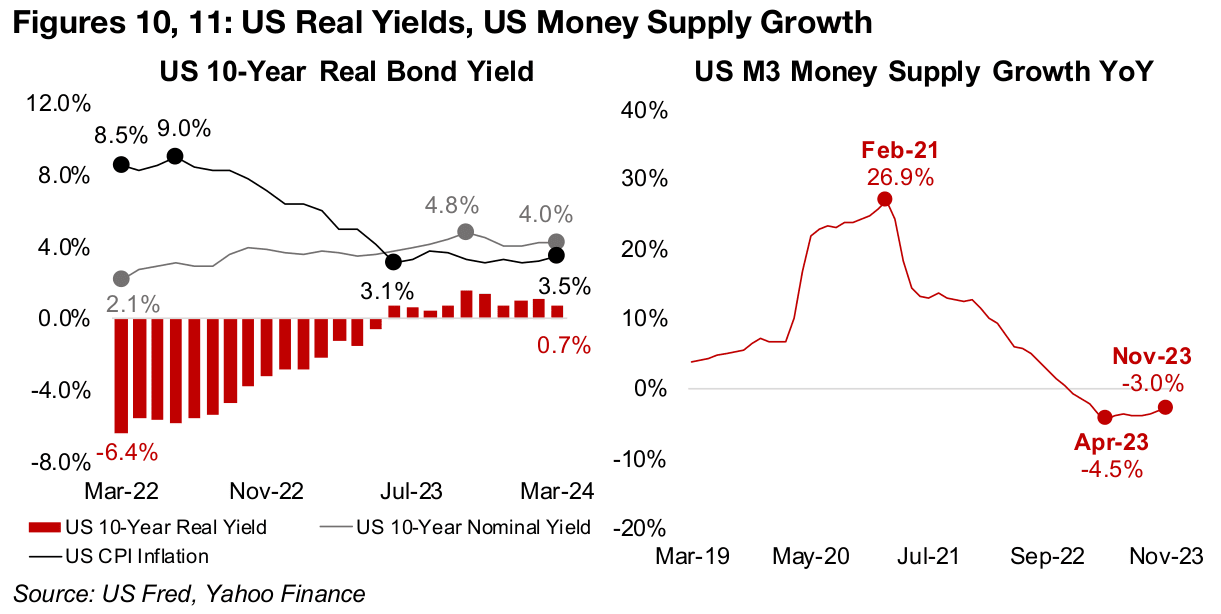
Another major driver for gold is the money supply, with the metal tending to remain a relatively steady proportion of the global money supply in recent years. The expansion of the US M3 money supply in 2020 and early 2021 was at historical extremes, reaching a peak of 26.9%, and this was a major driver for the gold price (Figure 11). However, money supply growth plunged through the rest of 2021 and turned negative in 2022, reaching lows of -4.5% in April 2023, which put pressure on the gold price. However, the money supply contraction has eased since, and was at just -3.0% as of the most recently reported November 2023 data. While a continued contraction in the money supply is not overly bullish for gold, it is at least less negative than this time last year and showing signs of a gradual climb back towards growth.
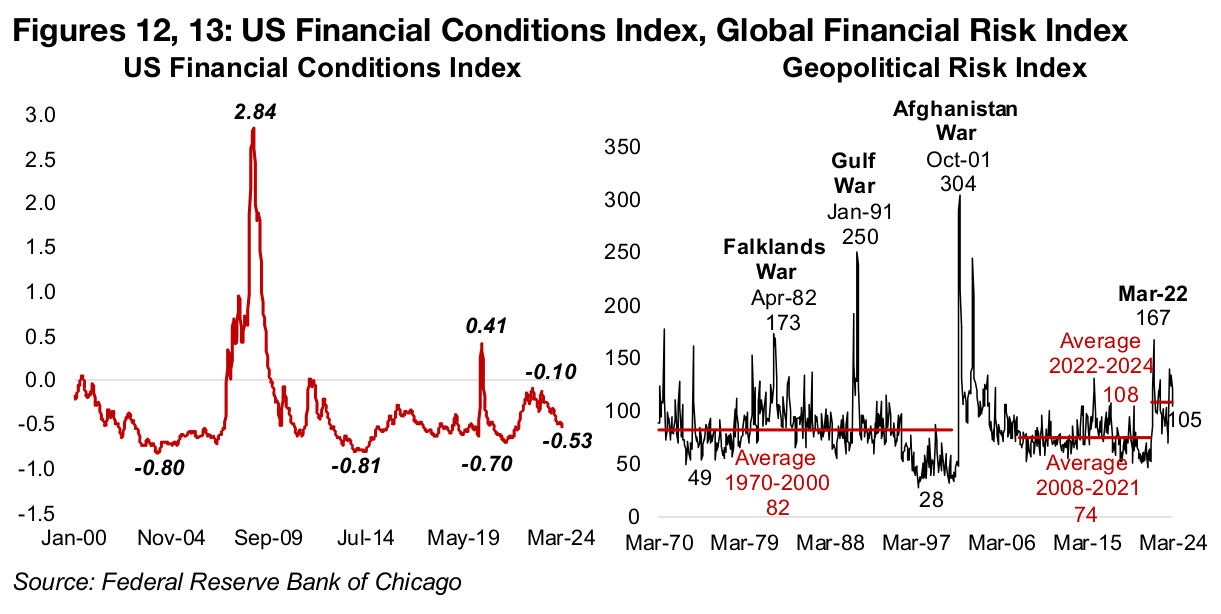
With interest rates near twenty-year highs and the money supply contracting, this
would seem to imply quite tight financial conditions. However, US financial conditions
have actually loosened considerably over the past year, with the index down to -0.53
(Figure 12). With measures above zero indicating tighter conditions, the index spiked
to 2.84 during the financial crisis in 2008 and rose to 0.4 during the global health crisis.
Measures below zero indicate looser conditions, with lows reached around -0.80 in
2004 and in 2014 in aftermath of the dot.com bust and the global financial crisis,
respectively, as central banks flooded the financial system with liquidity. The past
year’s decline in the index is different as interest rates are actually very high, but this
is only one of the total 105 metrics used in its calculation, including credit spreads,
lending standards and volumes, consumer leverage and others.
Perhaps even more key for gold currently than all these financial metrics, is the spike
in political tensions, with gold a general risk hedge, and incorporating geopolitical, as
well as monetary risk. The geopolitical risk index (GPR) has been extremely elevated
recently in the context of the last fifty years, averaging 108 from 2022 to 2024,
compared to just 74 for the relatively subdued period from 2008-2021(Figure 13).
The recent GPR is also considerably above the average of 82 from 1970 to 2000,
which included the tumultuous period from the mid-1970s through to the early-1980s
which ended with the Falklands War and a second spike in January 1991 on the first
Gulf War. While the index pulled back to 105 in March 2024 from 133 in January 2024,
we expect that a severe escalation of the conflict in the Middle East so far in April
could see the index rise again this month.
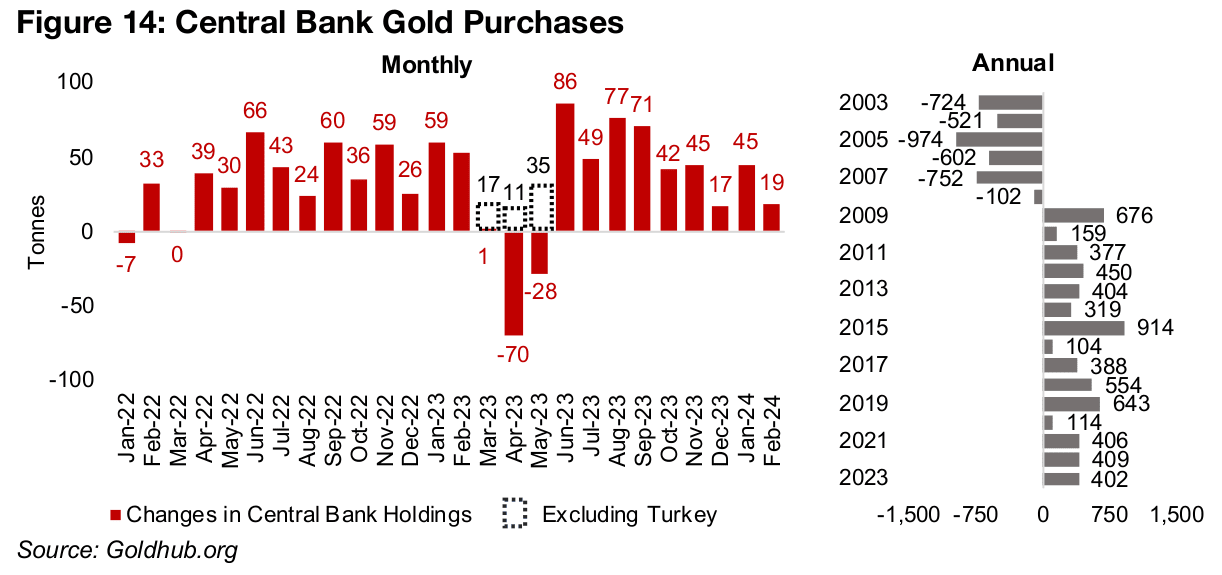
Other major drivers of the gold price are two different types of direct purchases of the metal in the market, by central banks and by ETFs. Central banks have continued a gold buying binge that has lasted since the 2009 financial crisis, with 2008 the last year of net gold sales (Figure 14). Central banks purchased a net 402 tonnes 2023, near the same level as 2021 and 2022. The net buying continued in January and February at 45 tonnes and 19 tonnes, respectively, and given the rising financial and geopolitical risk central banks could add to their holdings substantially again this year.
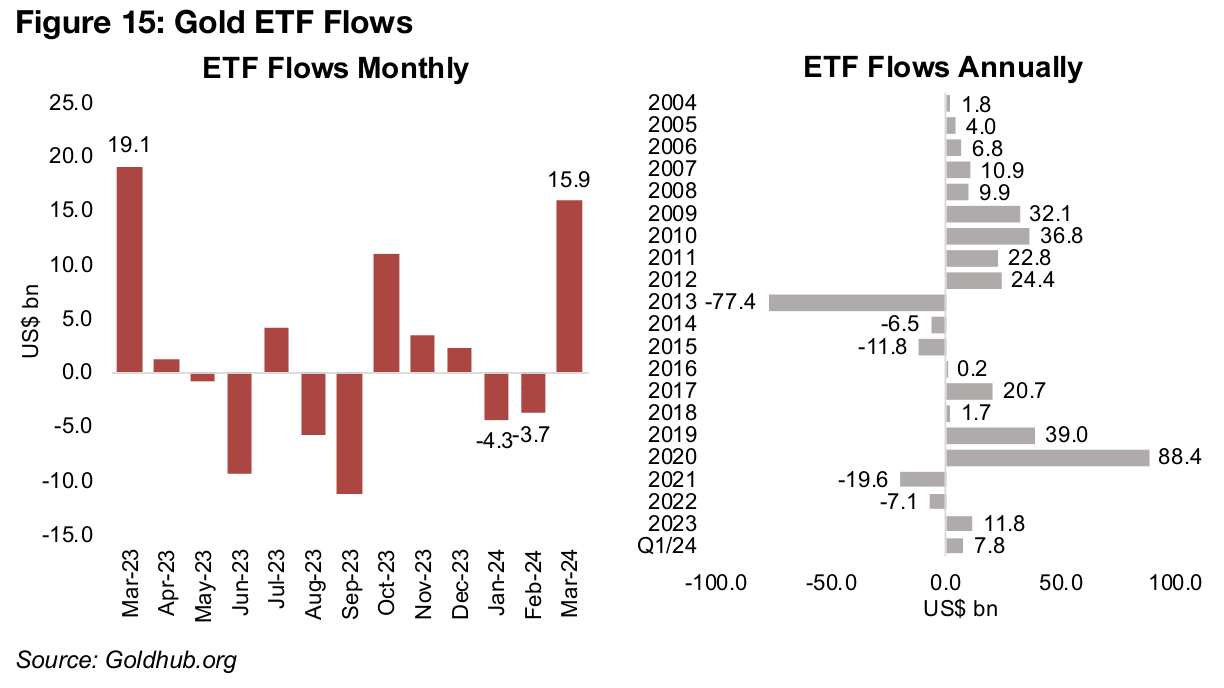
Another big driver for the sector could be ETF inflows. While inflows did rebound in 2023, to US$11.8bn, this was after two weak years in 2021 and 2022, with outflows of US$-19.6bn and US$-7.1bn respectively (Figure 15). The 2023 increase was dwarfed by the huge US$88.4bn inflows of 2020, their highest of the past twenty years, with 2019 the second strongest year at US$39.0bn. This provides some context for the US$15.9bn ETF inflows in March 2024, which are already above the entire 2023 gains, and have rebounded from four relatively weak months. This shows that if a major retail move into gold via ETFs is occurring, it was only just getting started over the past month, and could have a long way to run, especially if there is another repeat of 2020 or even 2019 levels of inflows.
Parabolic moves like that seen for gold recently can raise concerns that a given asset
is moving into a risky bubble, and therefore warrants some consideration of the
fundamentals backing such a move. This week we have outlined a number of factors
which could continue to support gold’s move to a higher level, and in previous weeks
outlined how the metal’s valuations versus a number of comparable assets did not
show it at excessive levels. We also showed that gold stock valuations still remain
quite subdued, further indicating that the sector has not entered frothy territory.
A history of gold’s parabolic moves also shows that the current move has not been
extreme in percentage terms. The largest move was from January 1979 to 1980, with
a US$632 gain, or 290%, followed by a fifteen-year downtrend (Figure 16). Gold
picked up again in the mid-2000s, with two parabolic jumps, a 73% rise with
US$307/oz added from July 2005 to May 2006, and a US$344/oz gain, or 54%, from
June 2007 to July 2008. Following the global financial crisis, gold rose sharply for
about three years, with a final parabolic move of US$347/oz, or 30%, from July 2011
to September 2011, before a multi-year gold bear market.
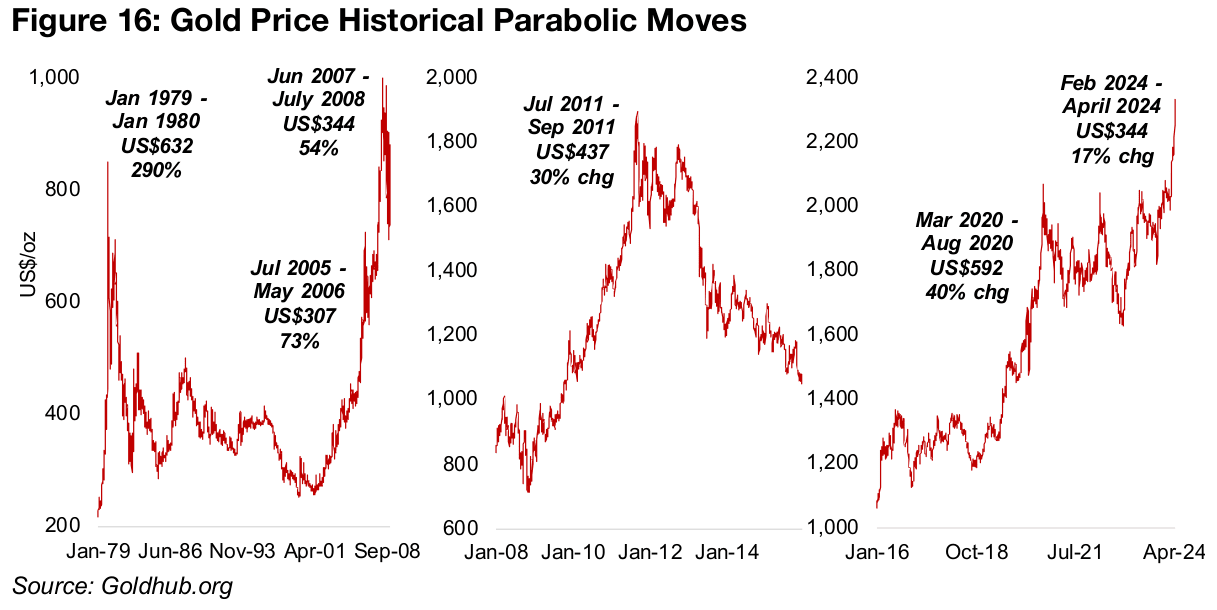
The most recent parabolic moves have been by US$592/oz, or 40%, from March 2020 to August 2020, and the gain since March 2024, which so far has run up 17%, with a US$344/oz increase. While the US$/oz gain in the current move has already surpassed some of the historical jumps, given the much higher absolute level of the gold price over time, the percentage move is more key, and this is only about half or less the level of previous big moves. Big Article Content Success! Set active successfully.
Gold has been surging because a previously quite bullish market is finally starting to
put a much higher weighting on bearish scenarios which could boost the safe-haven
metal. In a scenario where economic growth is maintained, but there is a resurgence
of inflation, gold is likely to continue to rise, as it has historically been a hedge against
rising prices. If economic growth falters, central banks will likely return to monetary
easing, driving up the money supply, pushing down real yields and the US$, and
therefore propelling gold. If geopolitical risk spikes further, gold is also likely to gain.
The only scenario where gold doesn’t win is a return to very low inflation and interest
rates at the same time as there is high economic growth coupled with low geopolitical
risk. While this occurred during the mid-2010s, it is looking increasingly anomalous
in retrospect and certainly very unlikely in the short to medium term. Any significant
weighting the market may be giving to a ‘return to the mid-2010s’ scenario in the
several months leading up to February 2024 seems to have faded since March 2024.
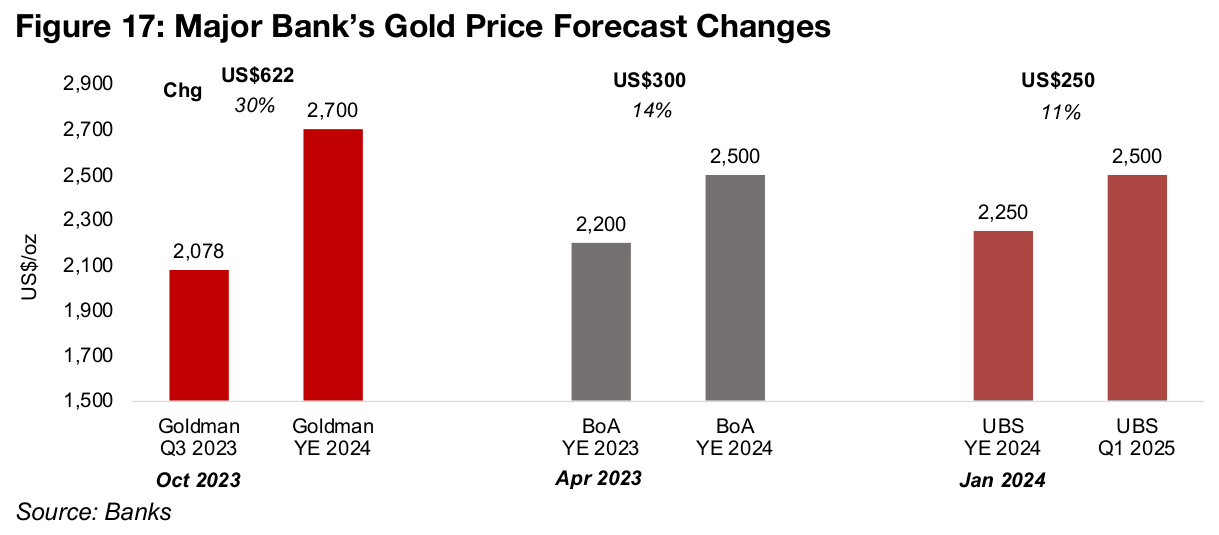
Major investment banks seem to be giving higher weighting to pro-gold scenarios
given the significant upgrades to their forecasts for the metal in recent months.
Goldman Sachs has boosted its target US$622/oz, or by 30%, to US$2,700/oz for
YE 2024, up from a Q3 2023 target of US$2,078/oz released in October 2023 (Figure
17). Bank of America has increased its gold target by US$300/oz, or 14%, to
US$2,500/oz from a YE 2023 target of US$2,200/oz from April 2023, and UBS has
boosted its Q1 2005 target also to US$2,500/oz, up US$250/oz, or 11%, from a
US$2,250/oz target for YE 2024 made as recently as January 2024.
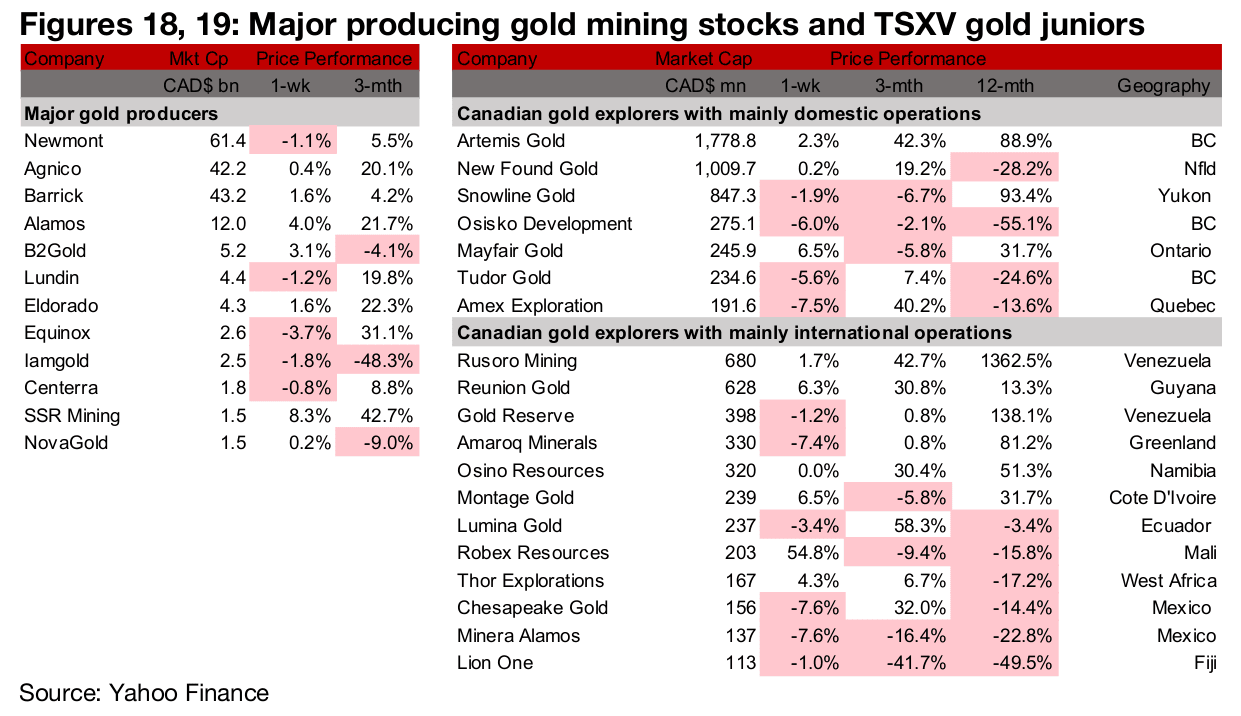
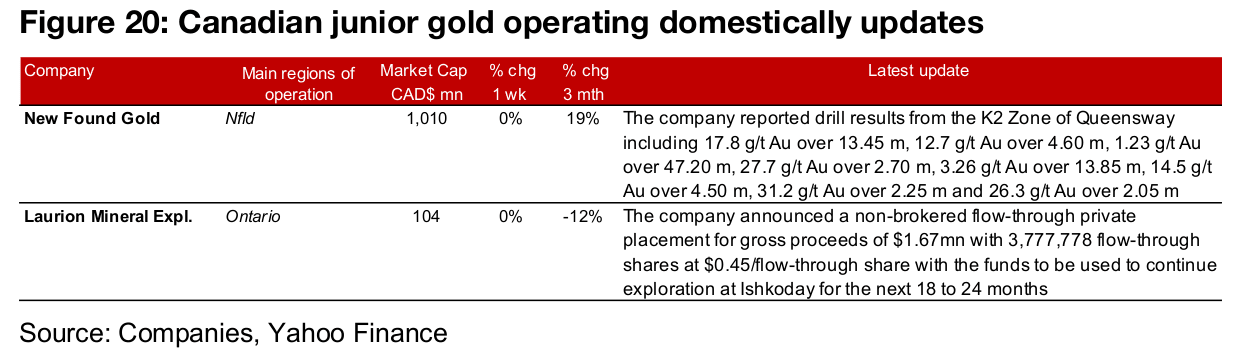
The large producers and TSXV gold were mixed as the gold price gained but equities declined (Figures 18, 19). For the TSXV gold companies operating domestically, New Found Gold reported drill results from the K2 Zone of Queensway and Laurion Mineral Exploration announced a $1.67mn non-brokered flow-through private placement (Figure 20). There was no major news from the larger TSXV gold companies operating internationally.
Disclaimer: This report is for informational use only and should not be used an alternative to the financial and legal advice of a qualified professional in business planning and investment. We do not represent that forecasts in this report will lead to a specific outcome or result, and are not liable in the event of any business action taken in whole or in part as a result of the contents of this report.
Author
Ben McGregor authors the Weekly Roundup at CanadianMiningReport.com, providing sharp analysis of the metals and mining sector. With a talent for spotting trends, Ben distills complex market shifts into clear, engaging insights on TSXV junior miners. His weekly updates cover gold, copper, uranium, and more, blending data-driven perspectives with a knack for identifying opportunities. A vital resource for investors, Ben’s work navigates the dynamic junior mining landscape with precision.