December 15, 2025
Silver’s three-month outperformance continued, with a 40% rise since late September 2025, as the UK inventory recovery has been driven by depleting China stocks, while demand has outpaced a pickup in output from leading producers.
The gold stocks jumped with the GDX up 5.7% and GDXJ rising 7.2%, outperforming the -0.9% fall in the S&P 500 and -1.7% drop in the Nasdaq on concerns over the tech boom’s sustainability, although small caps rose, with an 0.8% Russell 2000 gain.


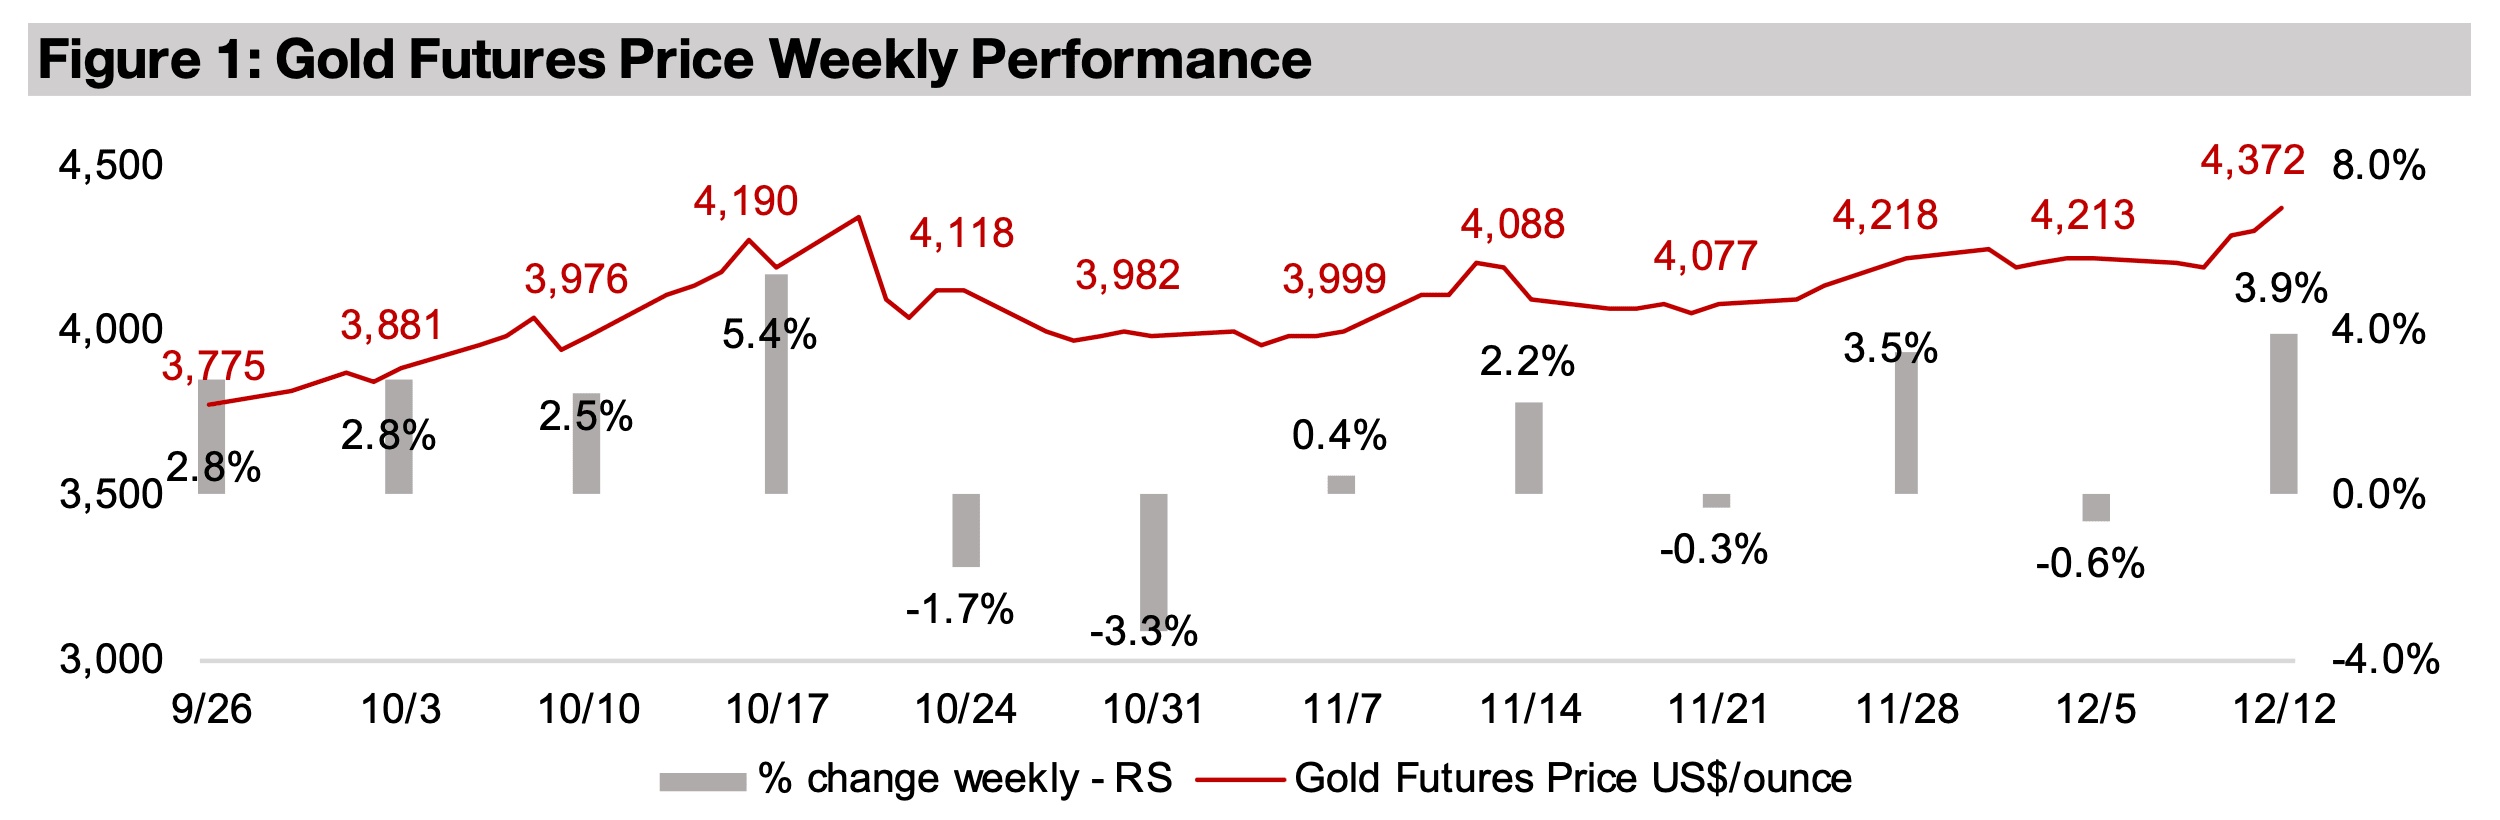
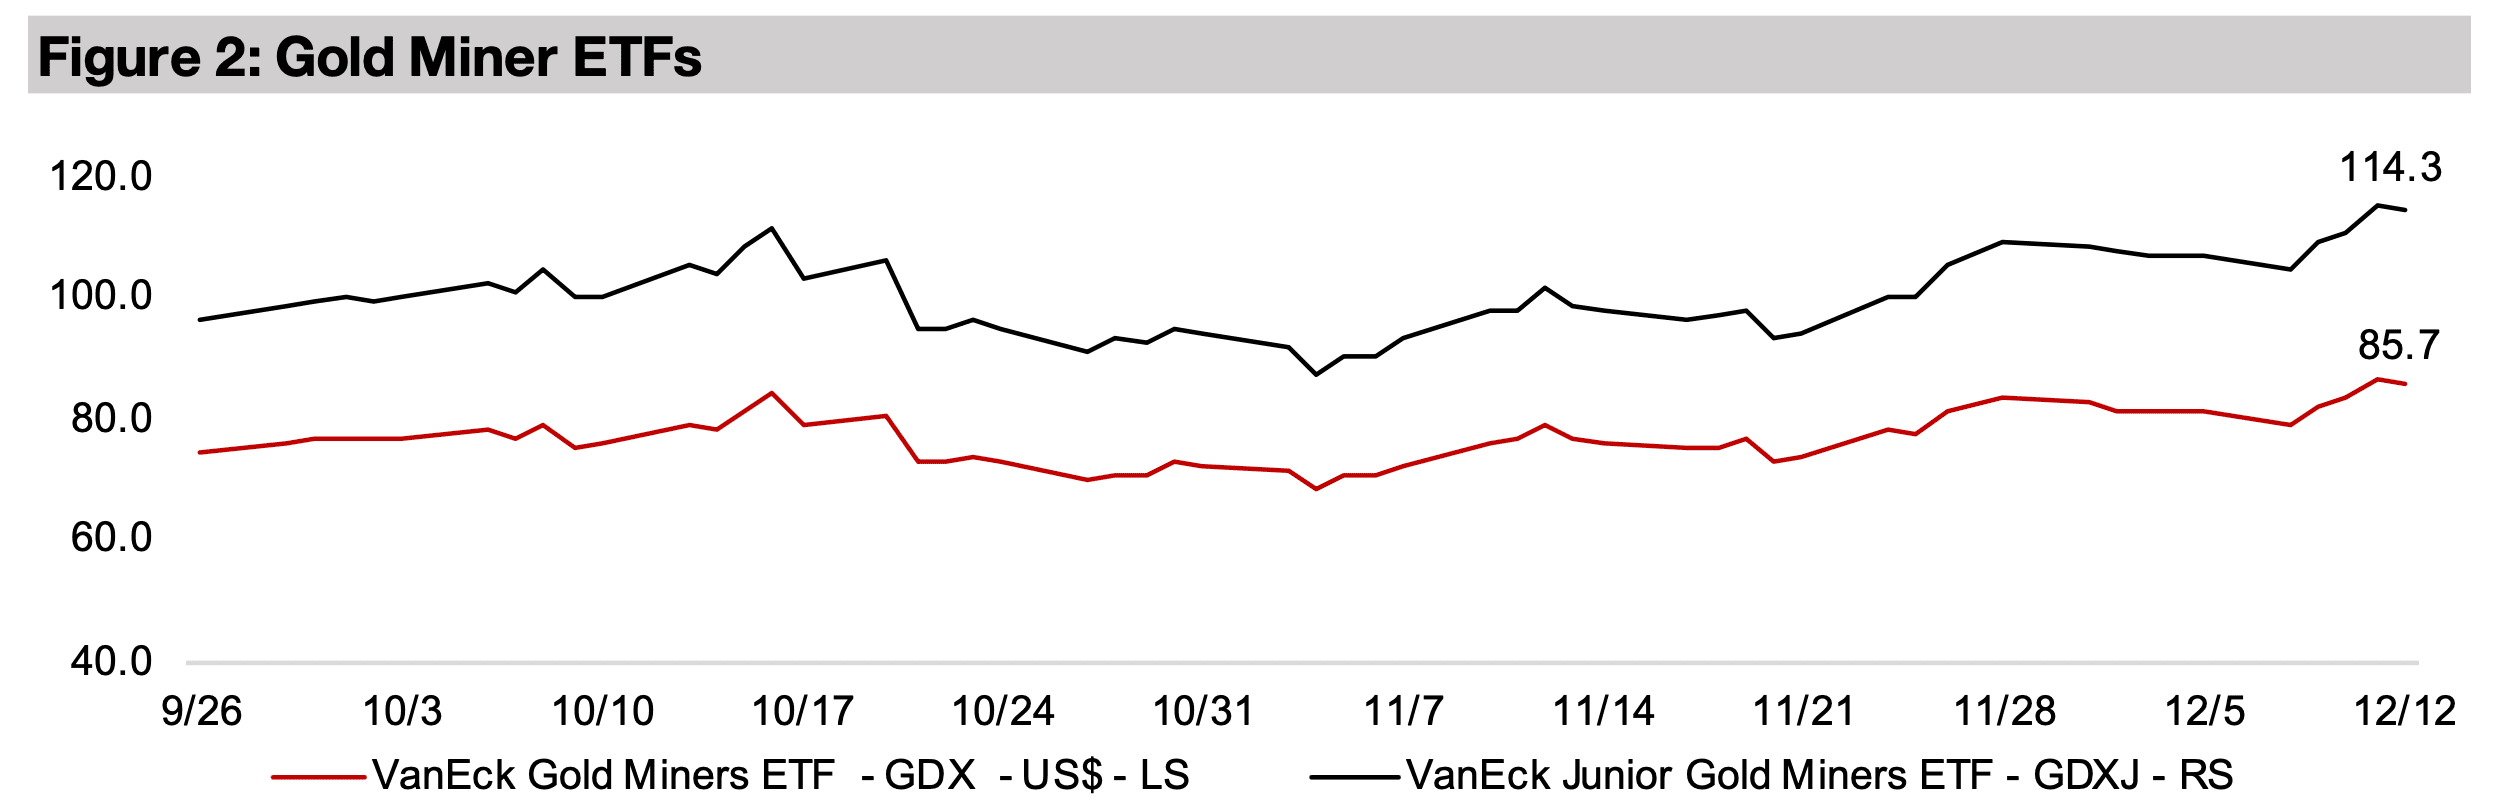
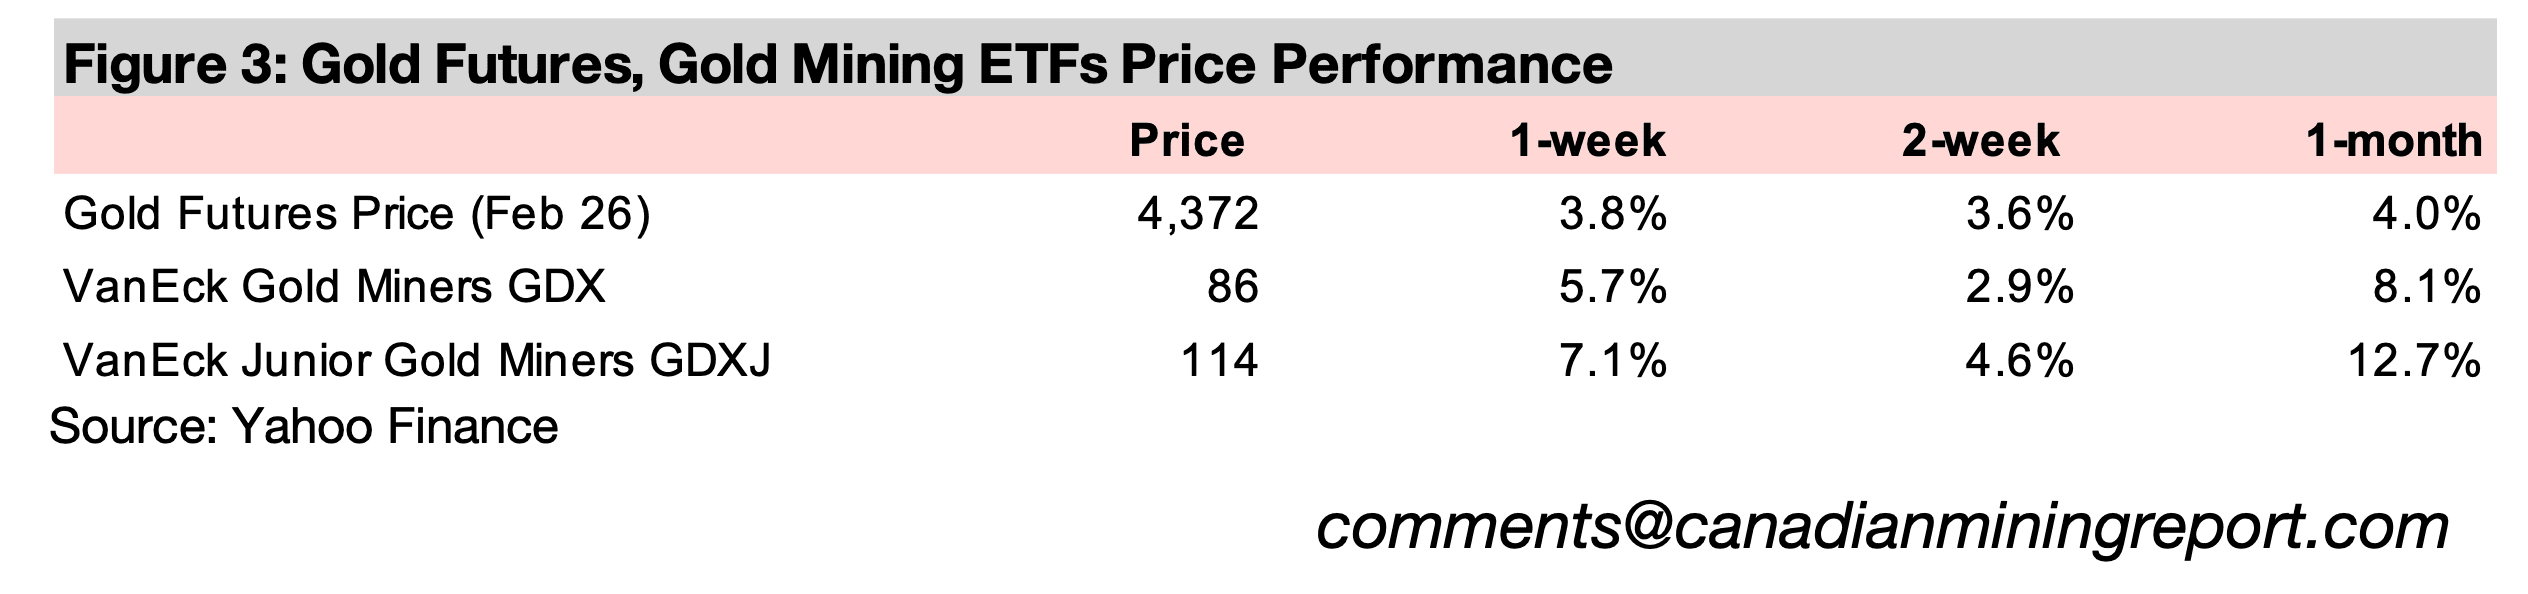
The gold price jumped 3.9% to US$4,372/oz, pulling ahead of previous all-time highs of US$4,336/oz on October 20, 2025, as the US Fed cut rates by 0.25%, followed by comments that were viewed as dovish by the markets, implying further reductions are possible in 2026. The lower rates indicate that the ongoing global monetary expansion will continue into next year, and this tends to be the core driver of the gold price long-term. However, this did not boost the S&P 500, which declined -0.7%, or the Nasdaq, which dropped -1.9%, mainly on a -2.8% slump in the US Tech sector. This came after a nearly -15% crash in the share price of Oracle, a major player in AI infrastructure which raised concerns over the sustainability of the bubble in that sector. However, the markets still were in risk-on mode, just away from large caps and tech, with a 0.8% gain in the small cap Russell 2000 index. The rise in the metal price also boosted gold stocks, with the GDX up 5.1% and GDXJ adding 7.1%, with both also hitting new highs just above the October 20, 2025 peaks.
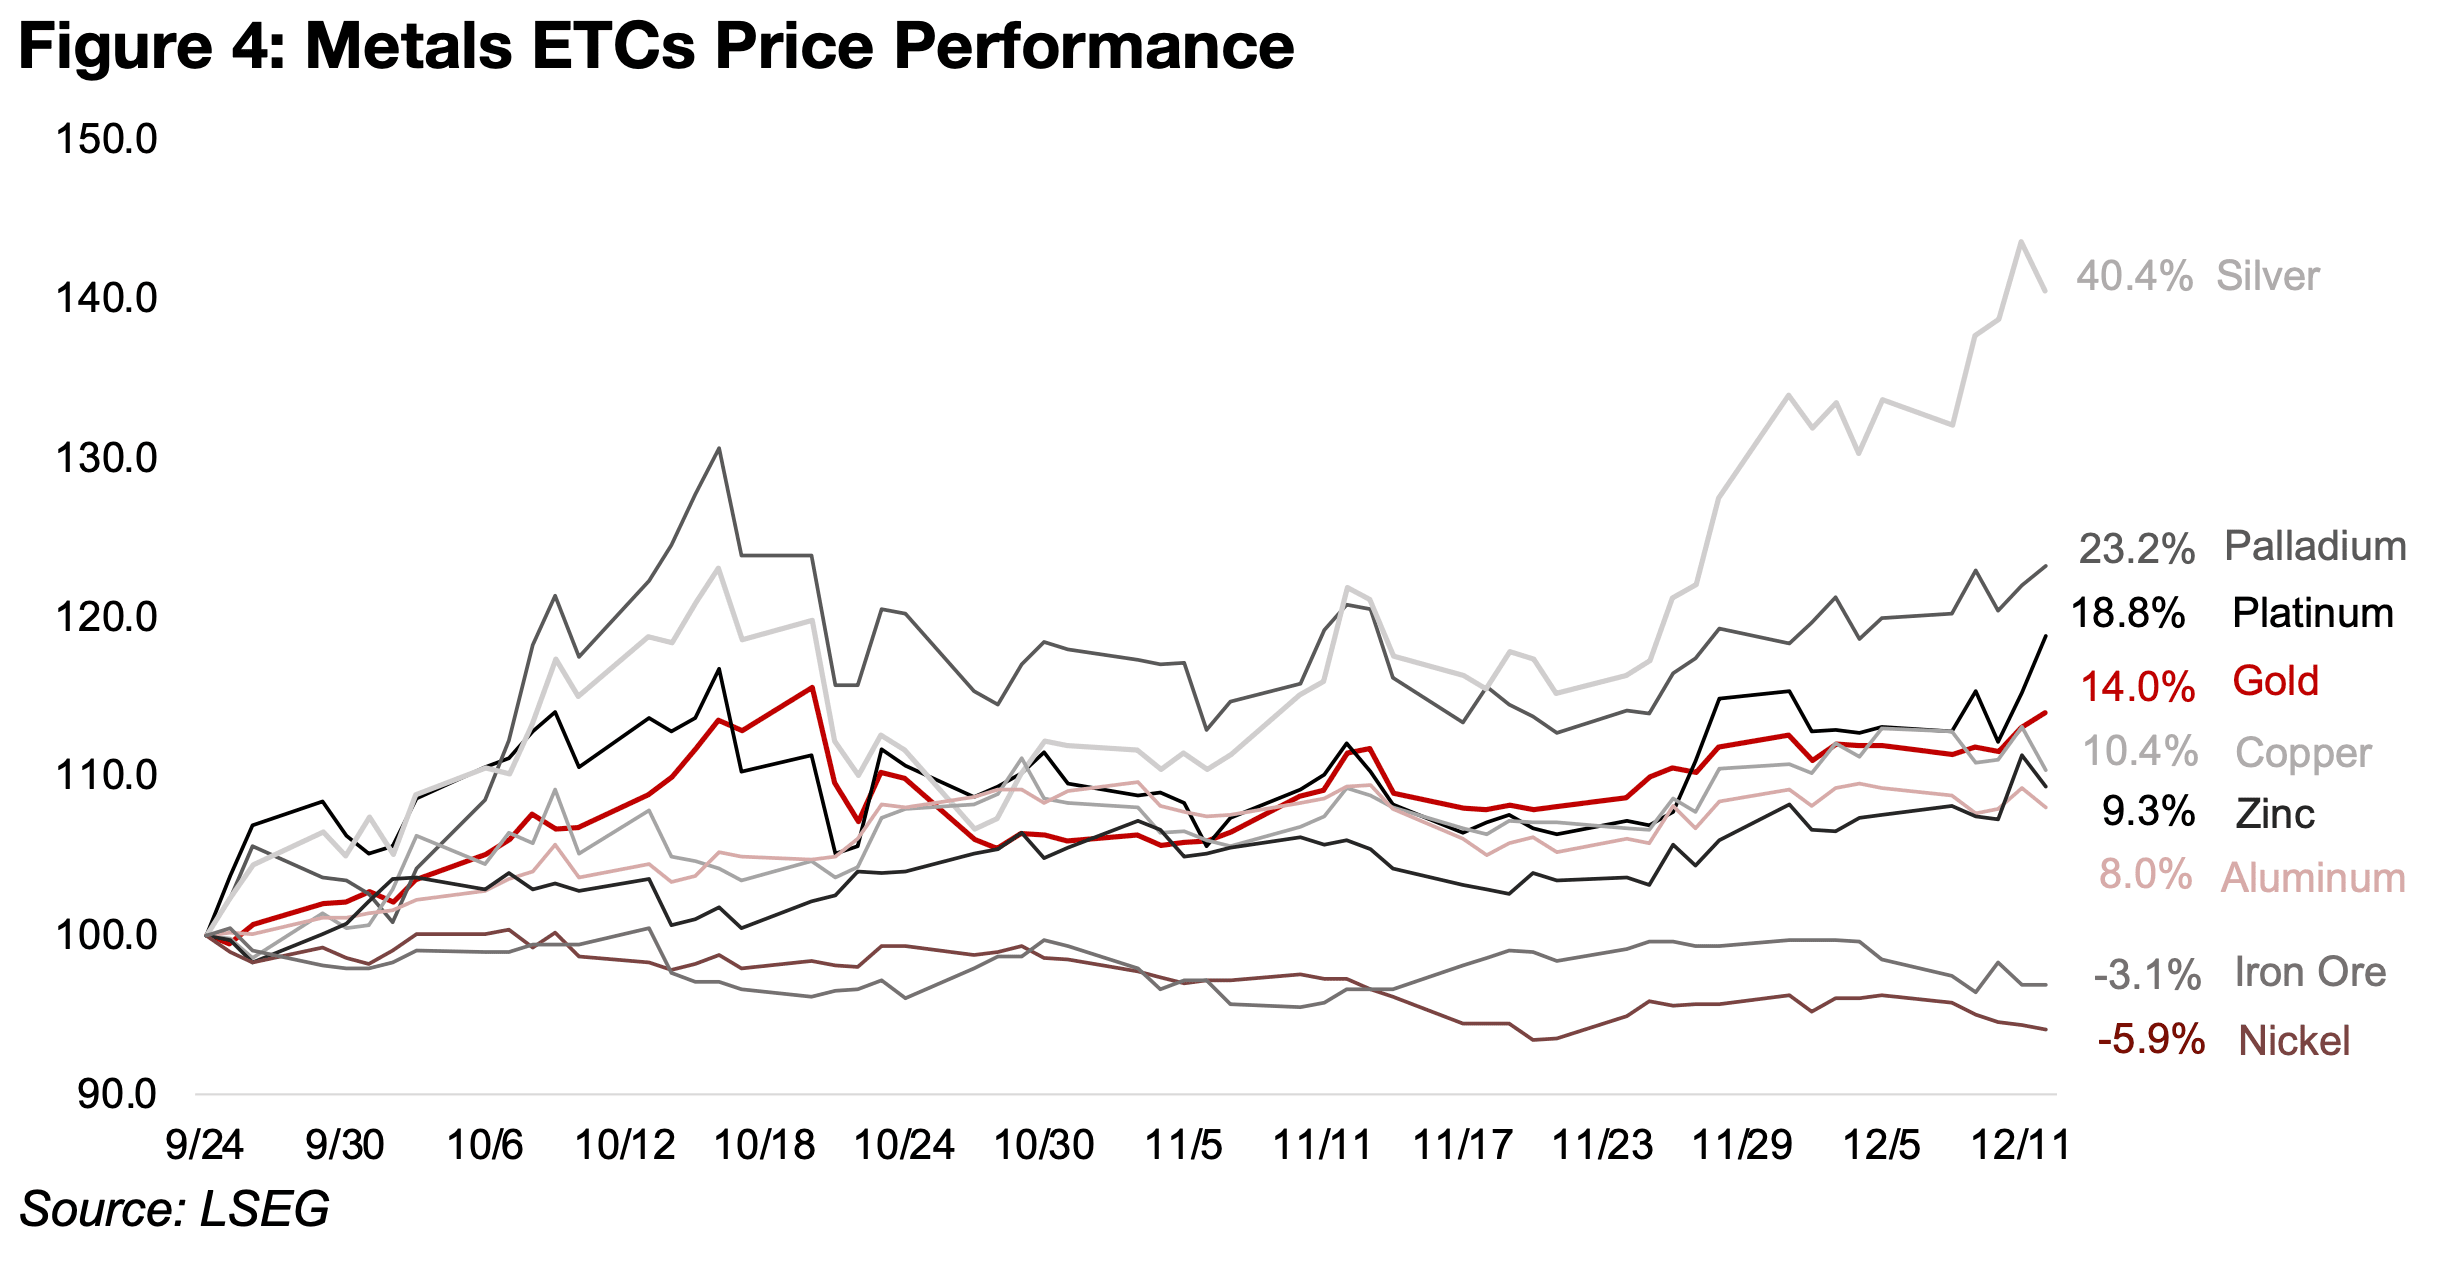
While gold has been relatively strong over the past three months, gaining 14.0% since September 24, 2025, it has still been outpaced by platinum, which is up 18.8% after a jump this week, and palladium, gaining 23.2% (Figure 4). However, silver has been by far the leader in the recent scramble for precious metals, up 40.4% since late September 2025. Most of the major base metals pulled back last week, including copper, zinc, aluminum and nickel, possibly hit by the prospects of reduced demand if the tech boom faltered, with all having significant use in the sector. Iron ore, which has more limited use directly in tech, was flat for the week, as it is mainly driven by China and India property and infrastructure, although there is some indirect tech demand from the construction of data centers.
Copper had actually been outpacing gold from late September 2025 until last week.
This had led us last week to consider whether the market was finally moving away
from stagflationary expectations that had persisted earlier this year. This had seen an
outperformance of gold and underperformance of copper, as the market seemed to
expect that a large monetary expansion, driving the former, would not necessarily
translate to strong economic growth, and push up the latter. However, since
September 2025, the rise of both these metals implied the market was shifting more
towards expectations of a monetary expansion coupled with economic growth, which
is generally considered the standard case, with stagflation a historical anomaly.
With the drop in Oracle putting the AI boom suddenly more in question, and this
sector key to overall global growth expectations, it also dimmed the outlook for
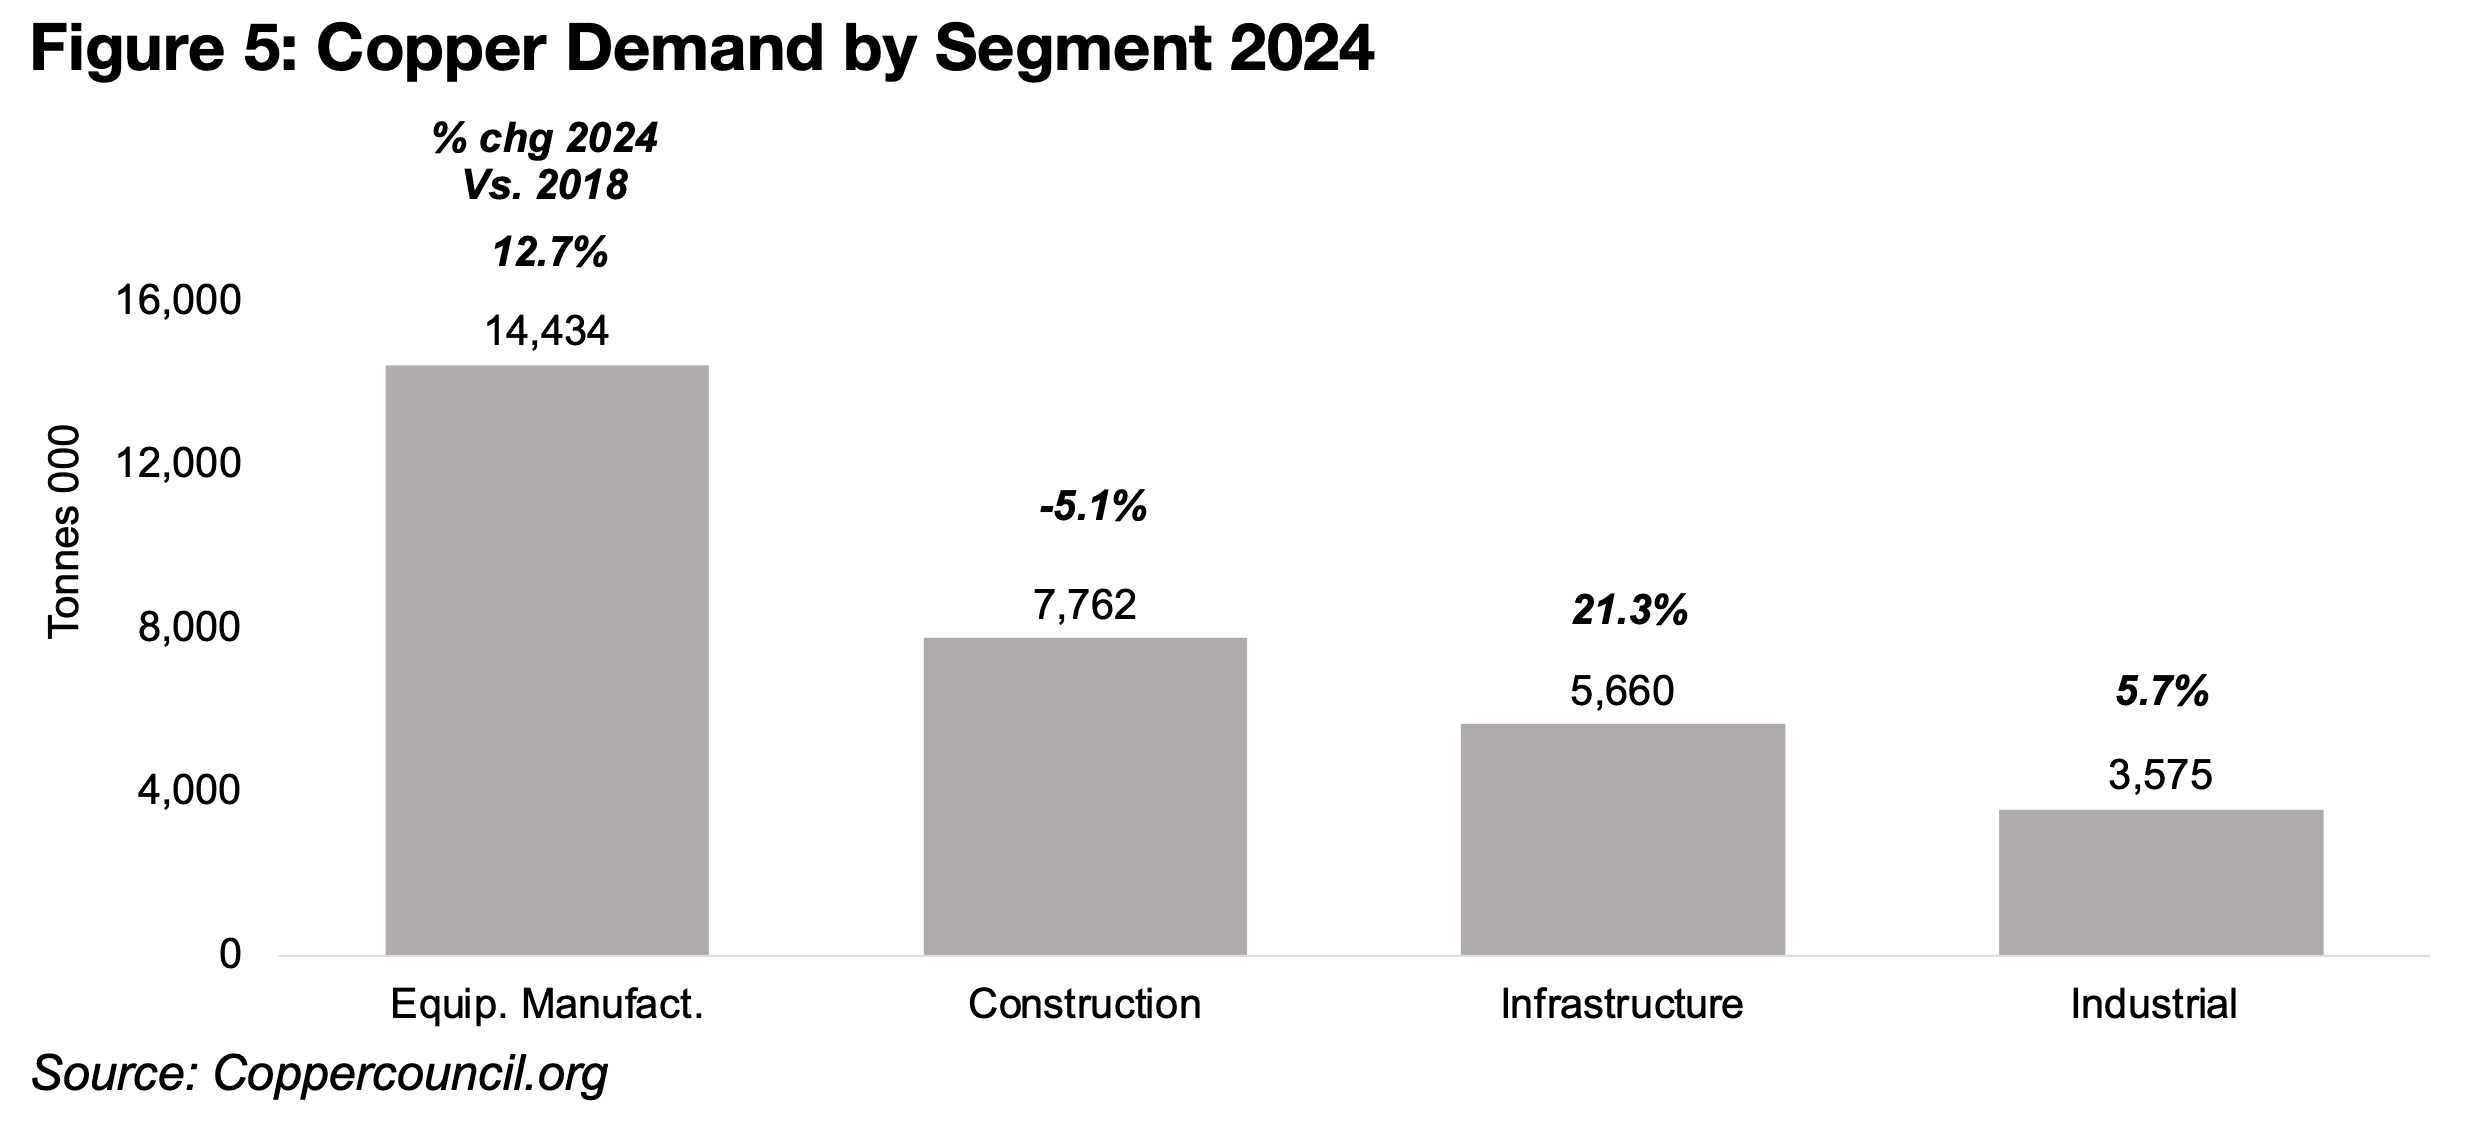
copper and could perhaps start another divergence between the metal and gold. The
largest growth in copper demand has come from infrastructure, at 5.6 mn tonnes in
2024, and up 21.3% since 2018, and equipment manufacture at 14.3 mn tonnes, and
up 12.7% since 2024, with construction demand declining -5.1% and industrial
demand, the smallest segment, up just 5.7% (Figure 5). The infrastructure segment
comprises power utilities and telecommunications, with the latter especially likely
seeing a major driver in the major expansion of data centers related to AI growth.
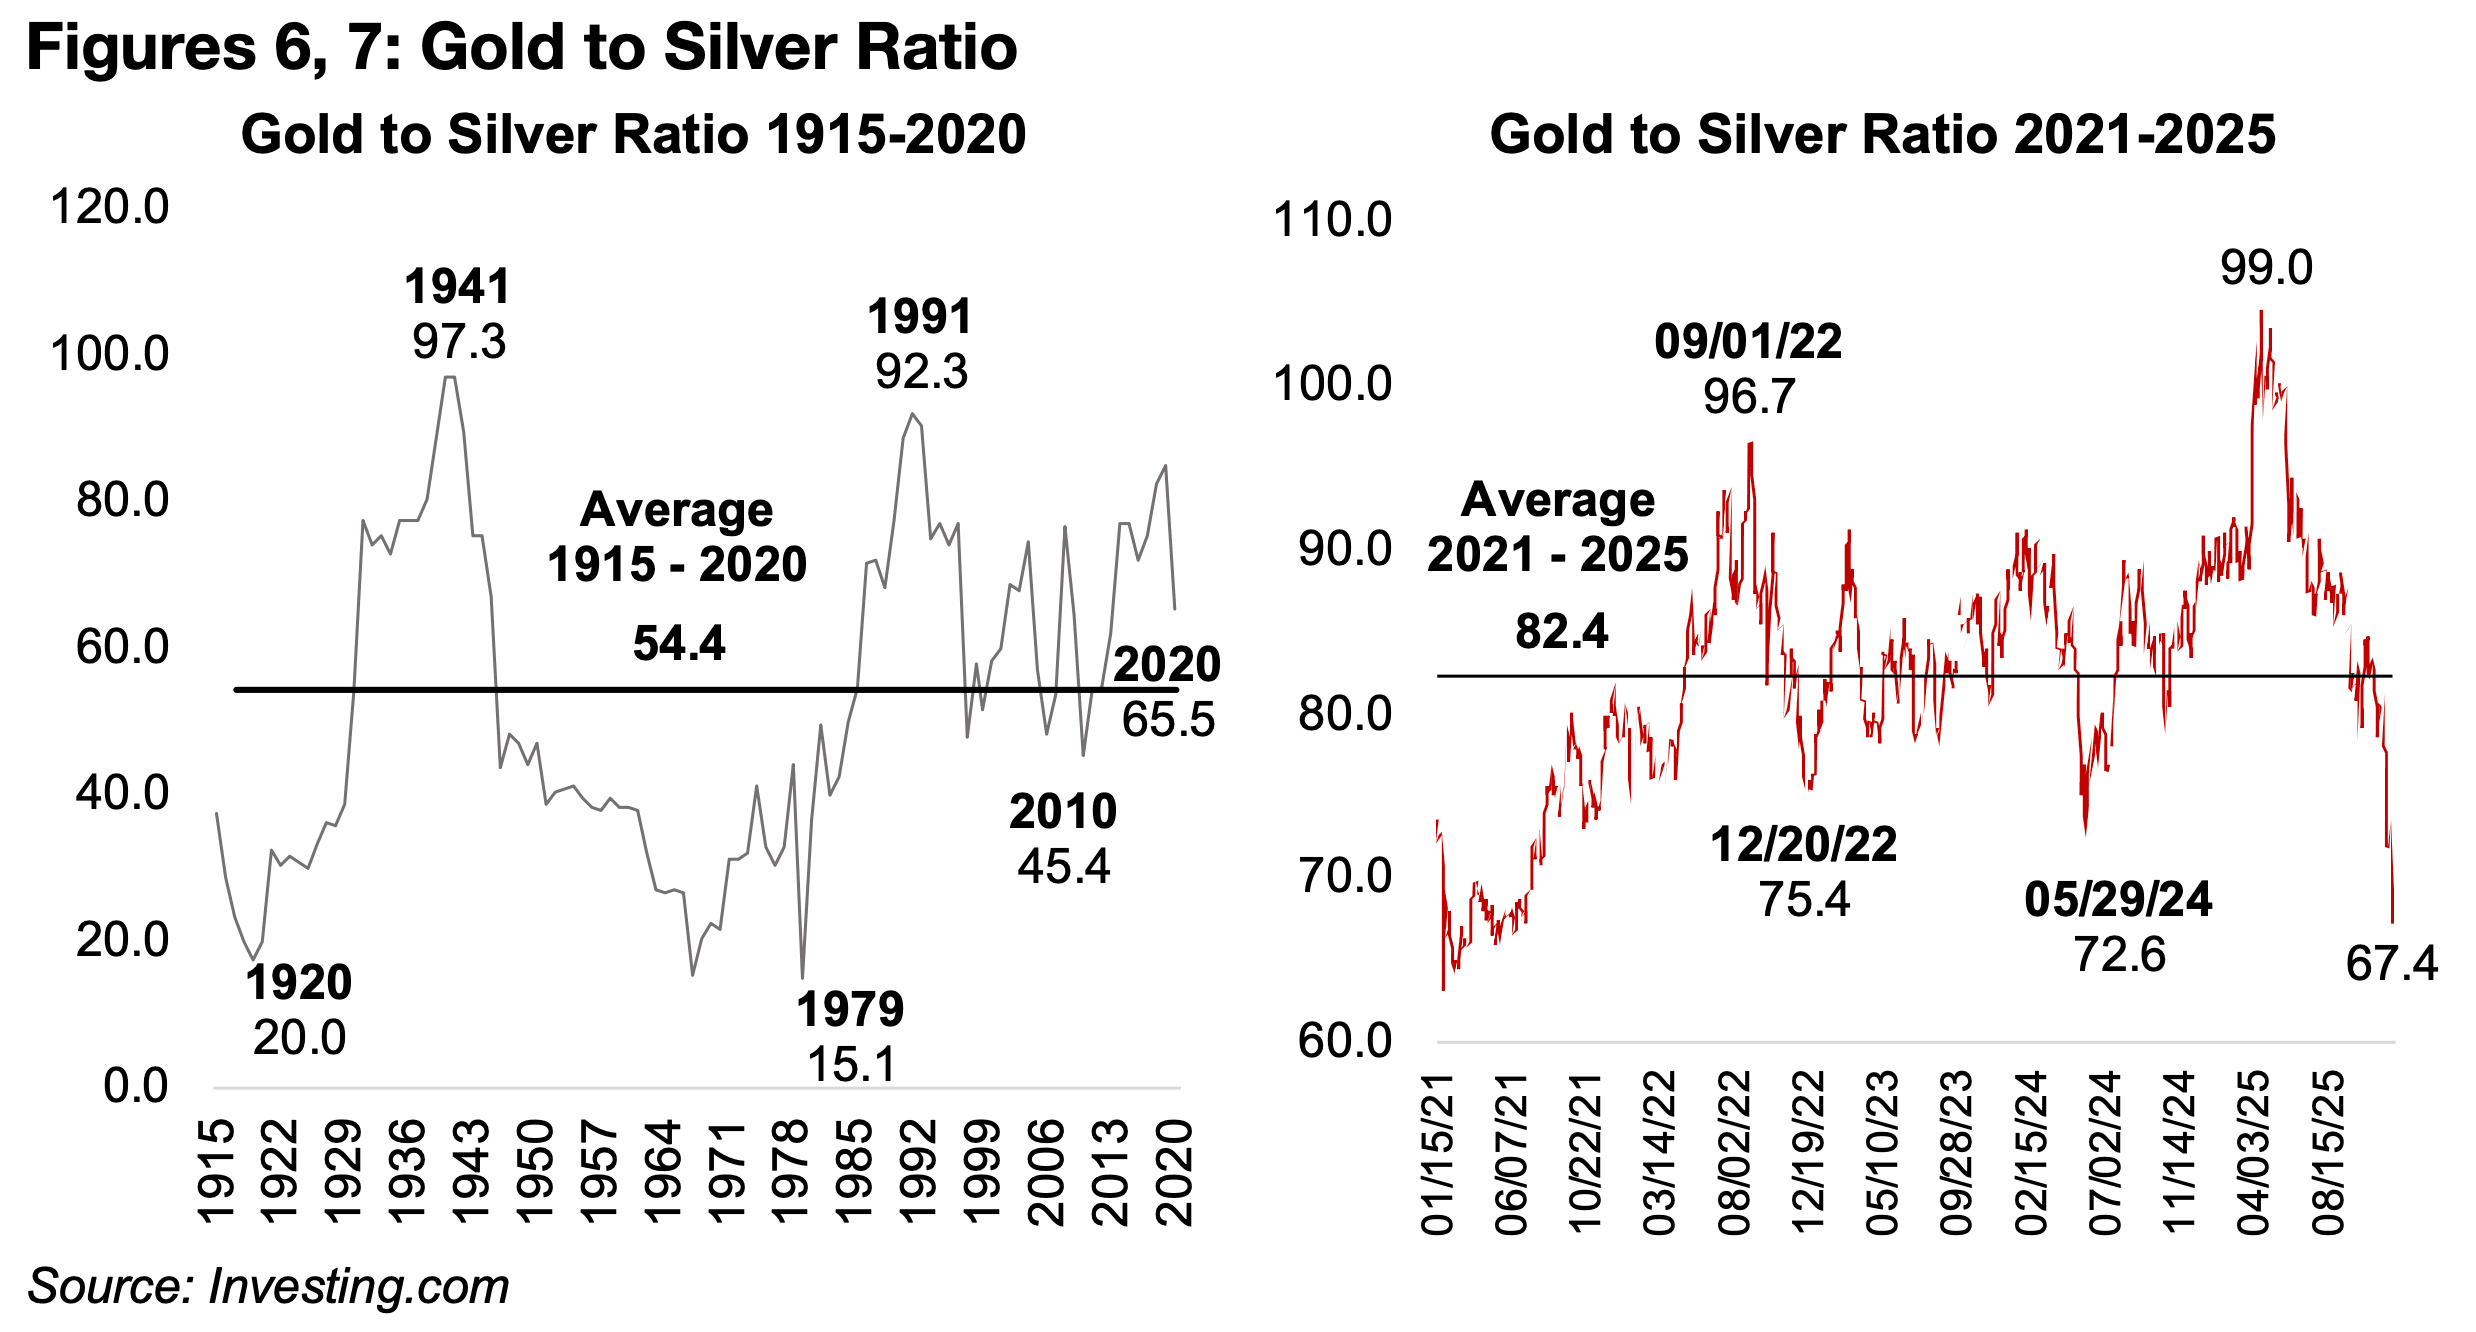
The rise in the silver price has seen the gold to silver ratio plunge towards the long-
term average of 54.4x from 1915-2020 (Figure 6). The ratio has seen extreme volatility
this year, having reached as high as 99.0x in early 2025, especially on the surge in
gold, but it has reversed to just 67.4x, which is also far below the medium-term
average of 82.4x from 2021-2025. Some in the market suggest that the gold to silver
ratio has been far too high for decades, and that it could eventually see a severe
decline especially driven by a rise in the silver price.
While the historical lows in the ratio were in 1920 at 20.0x and 1979 at 15.1x, reaching
these levels again may be unlikely given structural changes in the industry. The more
recent trough of 45.4x in 2010 could be considered a more reasonable potential
bottom for the ratio currently. However, based on the recent average, it does imply a
pullback in silver to bring the ratio in balance, especially given that the recent surge
has been driven mainly by severe distortions in supply short-term that are unlikely to
persist.
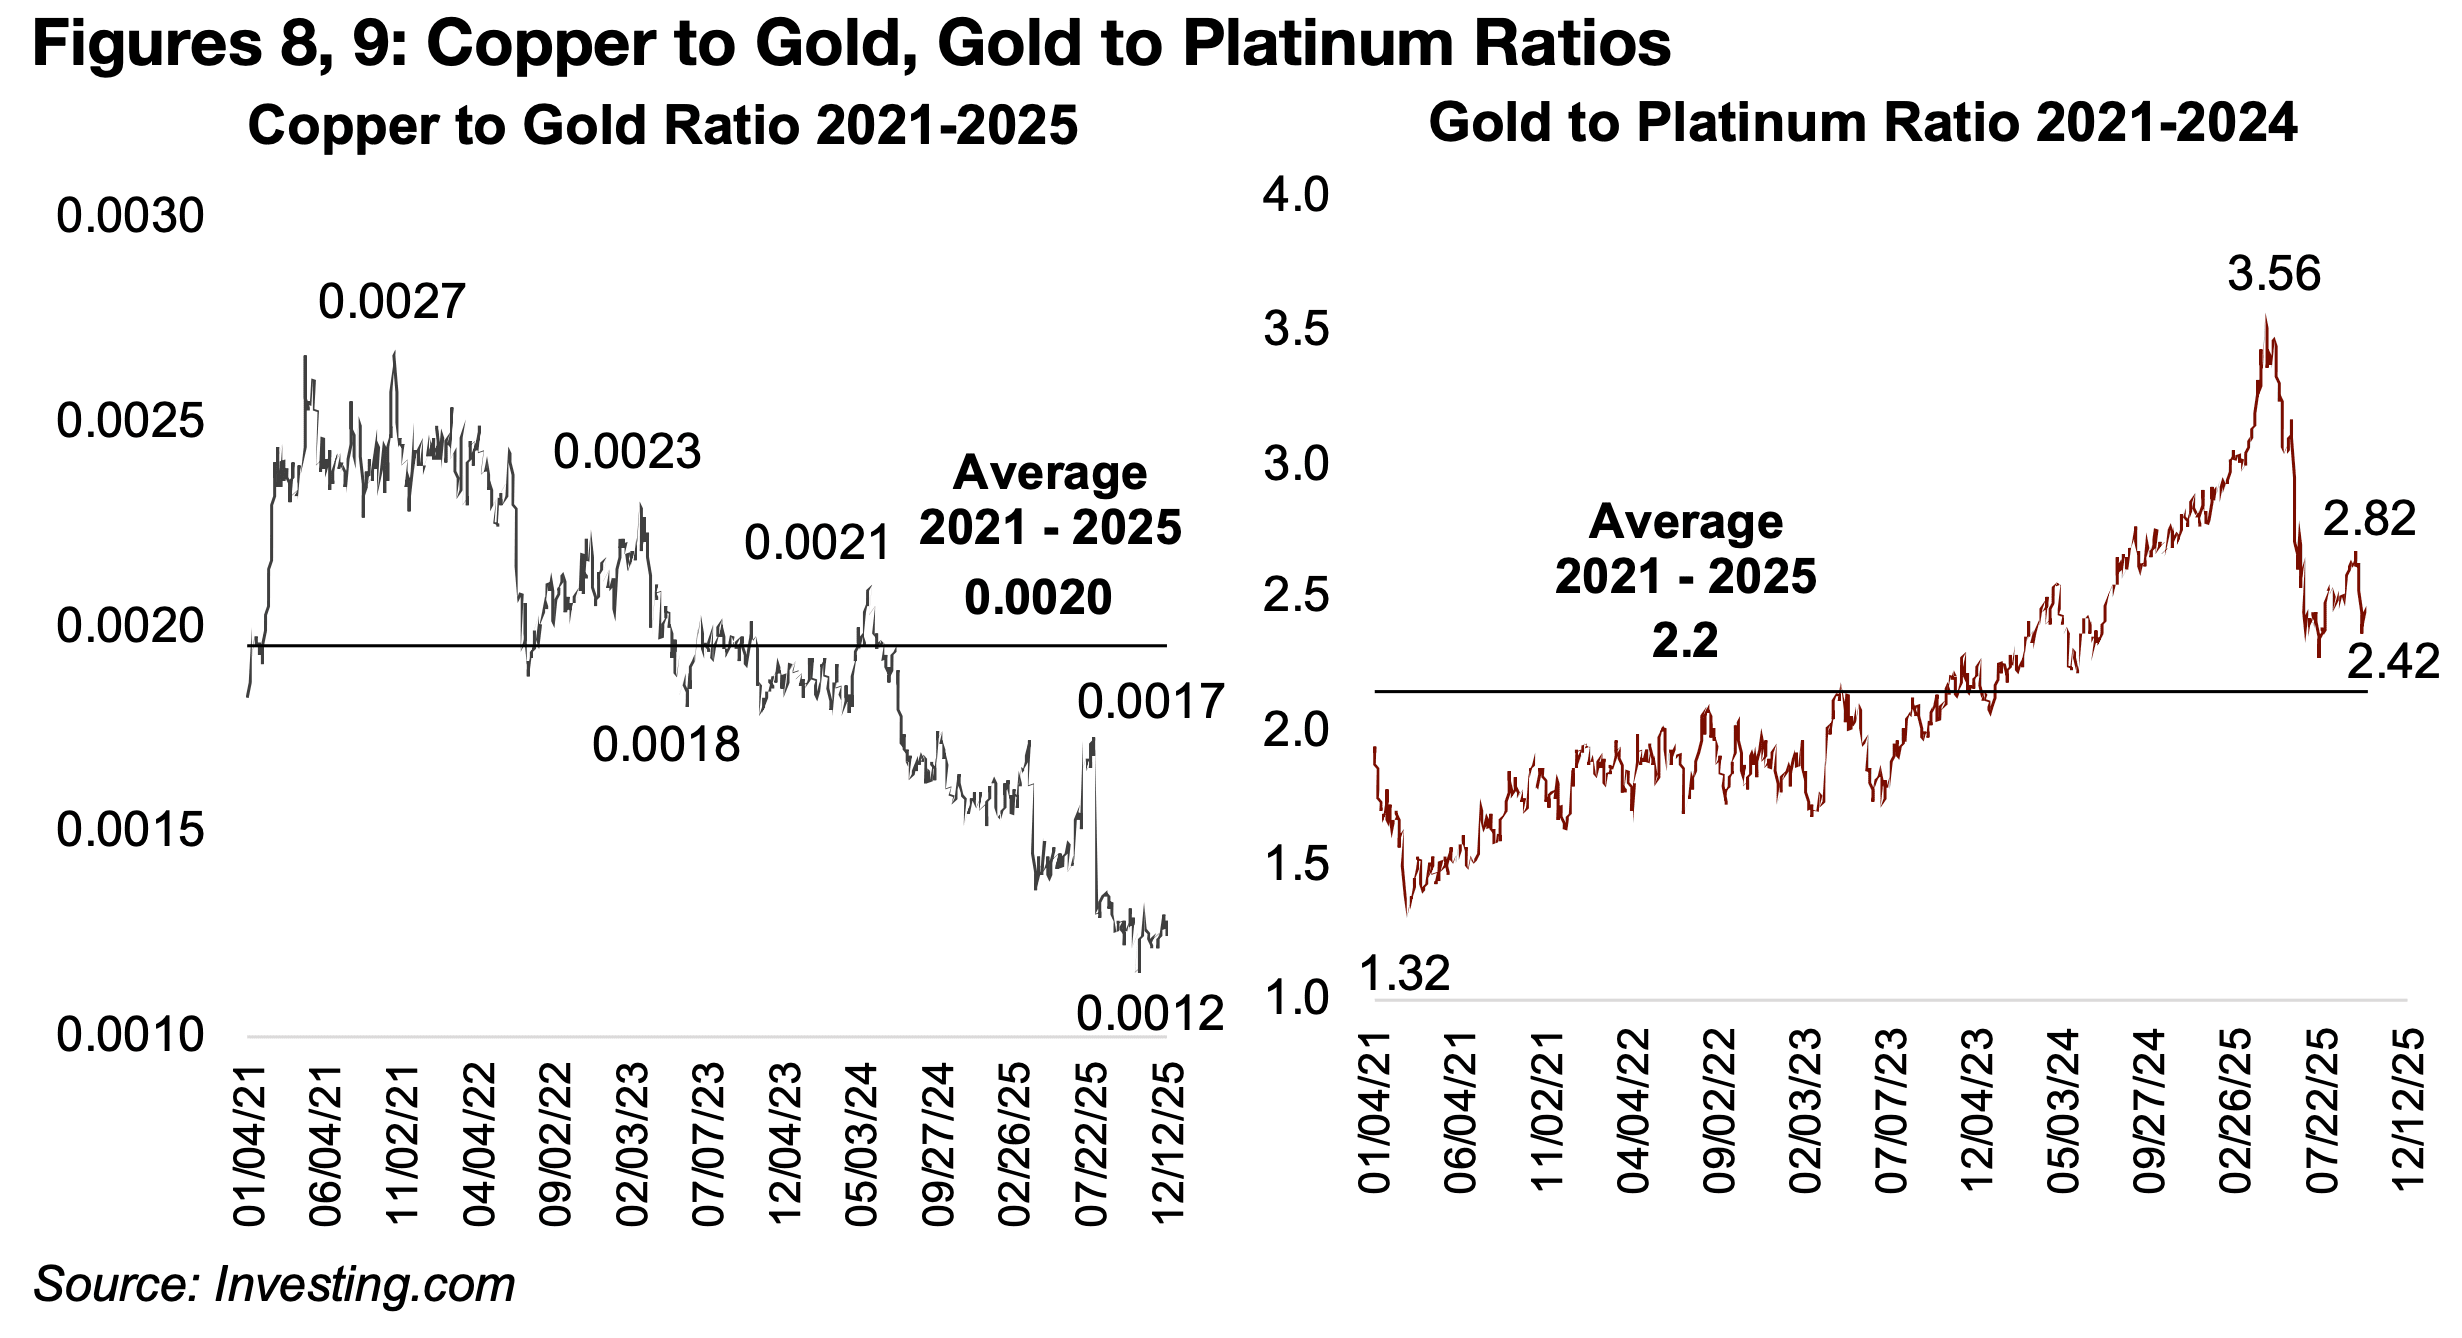
There has also been a considerable fall in the copper to gold ratio, from 0.0017 in
July 2020 to just 0.0012, and it is at less than half of the 0.0027 peak in 2021. This
shows that the market’s stagflationary expectations earlier this year implied by
copper underperforming gold have actually been part of a broader trend that had
been ongoing for several years already (Figure 8). The gold to platinum ratio has
reverted to 2.42x, back to near its 2021-2025 average of 2.15x on the rise in the
platinum ratio, not suggesting a major imbalance between the two metals (Figure 9).
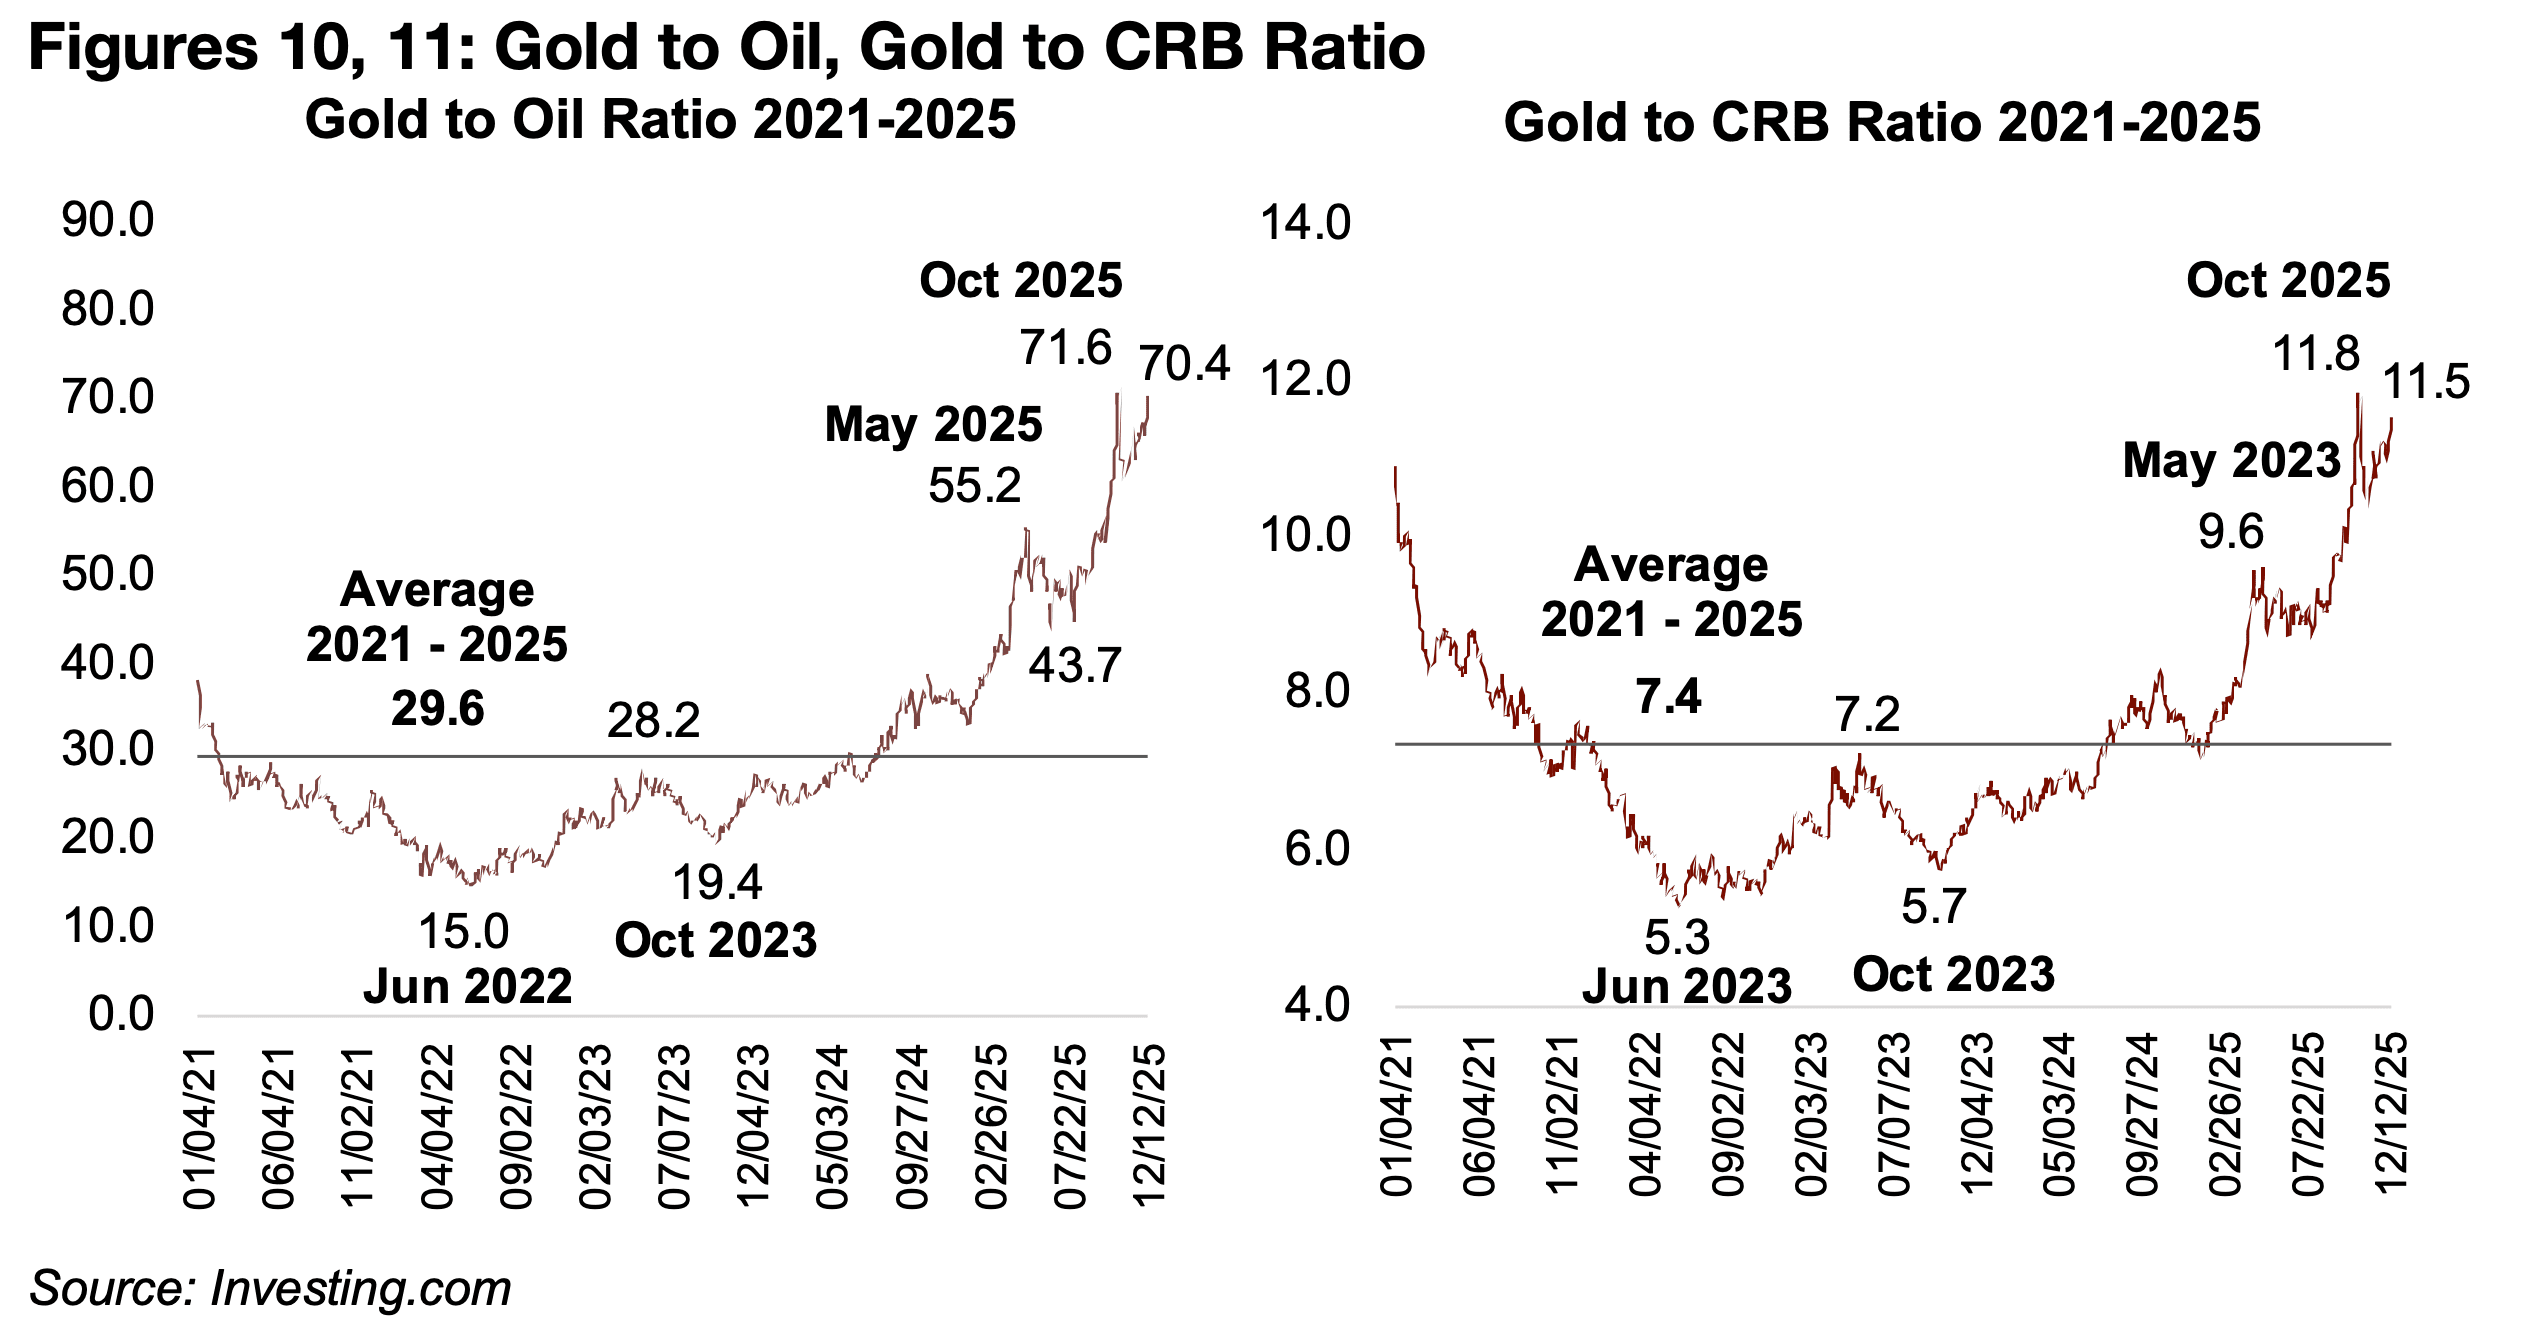
The gold to oil ratio is still far above the 2021-2025 average of 29.6x at 70.4x, and
just below the October 2025 highs of 71.6x (Figure 10). However, as this has been on
a significant rise in oil supply with most major producers seeing strong growth in
output and driving down the price, it does have a strong fundamental backing. The
gold to commodities ratio is somewhat high versus the 2021-2025 average of 7.4x,
at 11.5x, and also near the 11.8x peak of October, with this ratio partly affected by a
significant weighting of the index to oil (Figure 11). However, this could be another
indicator of stagflationary expectations by the market, suggesting that monetary
growth might outpace the demand for goods like commodities.
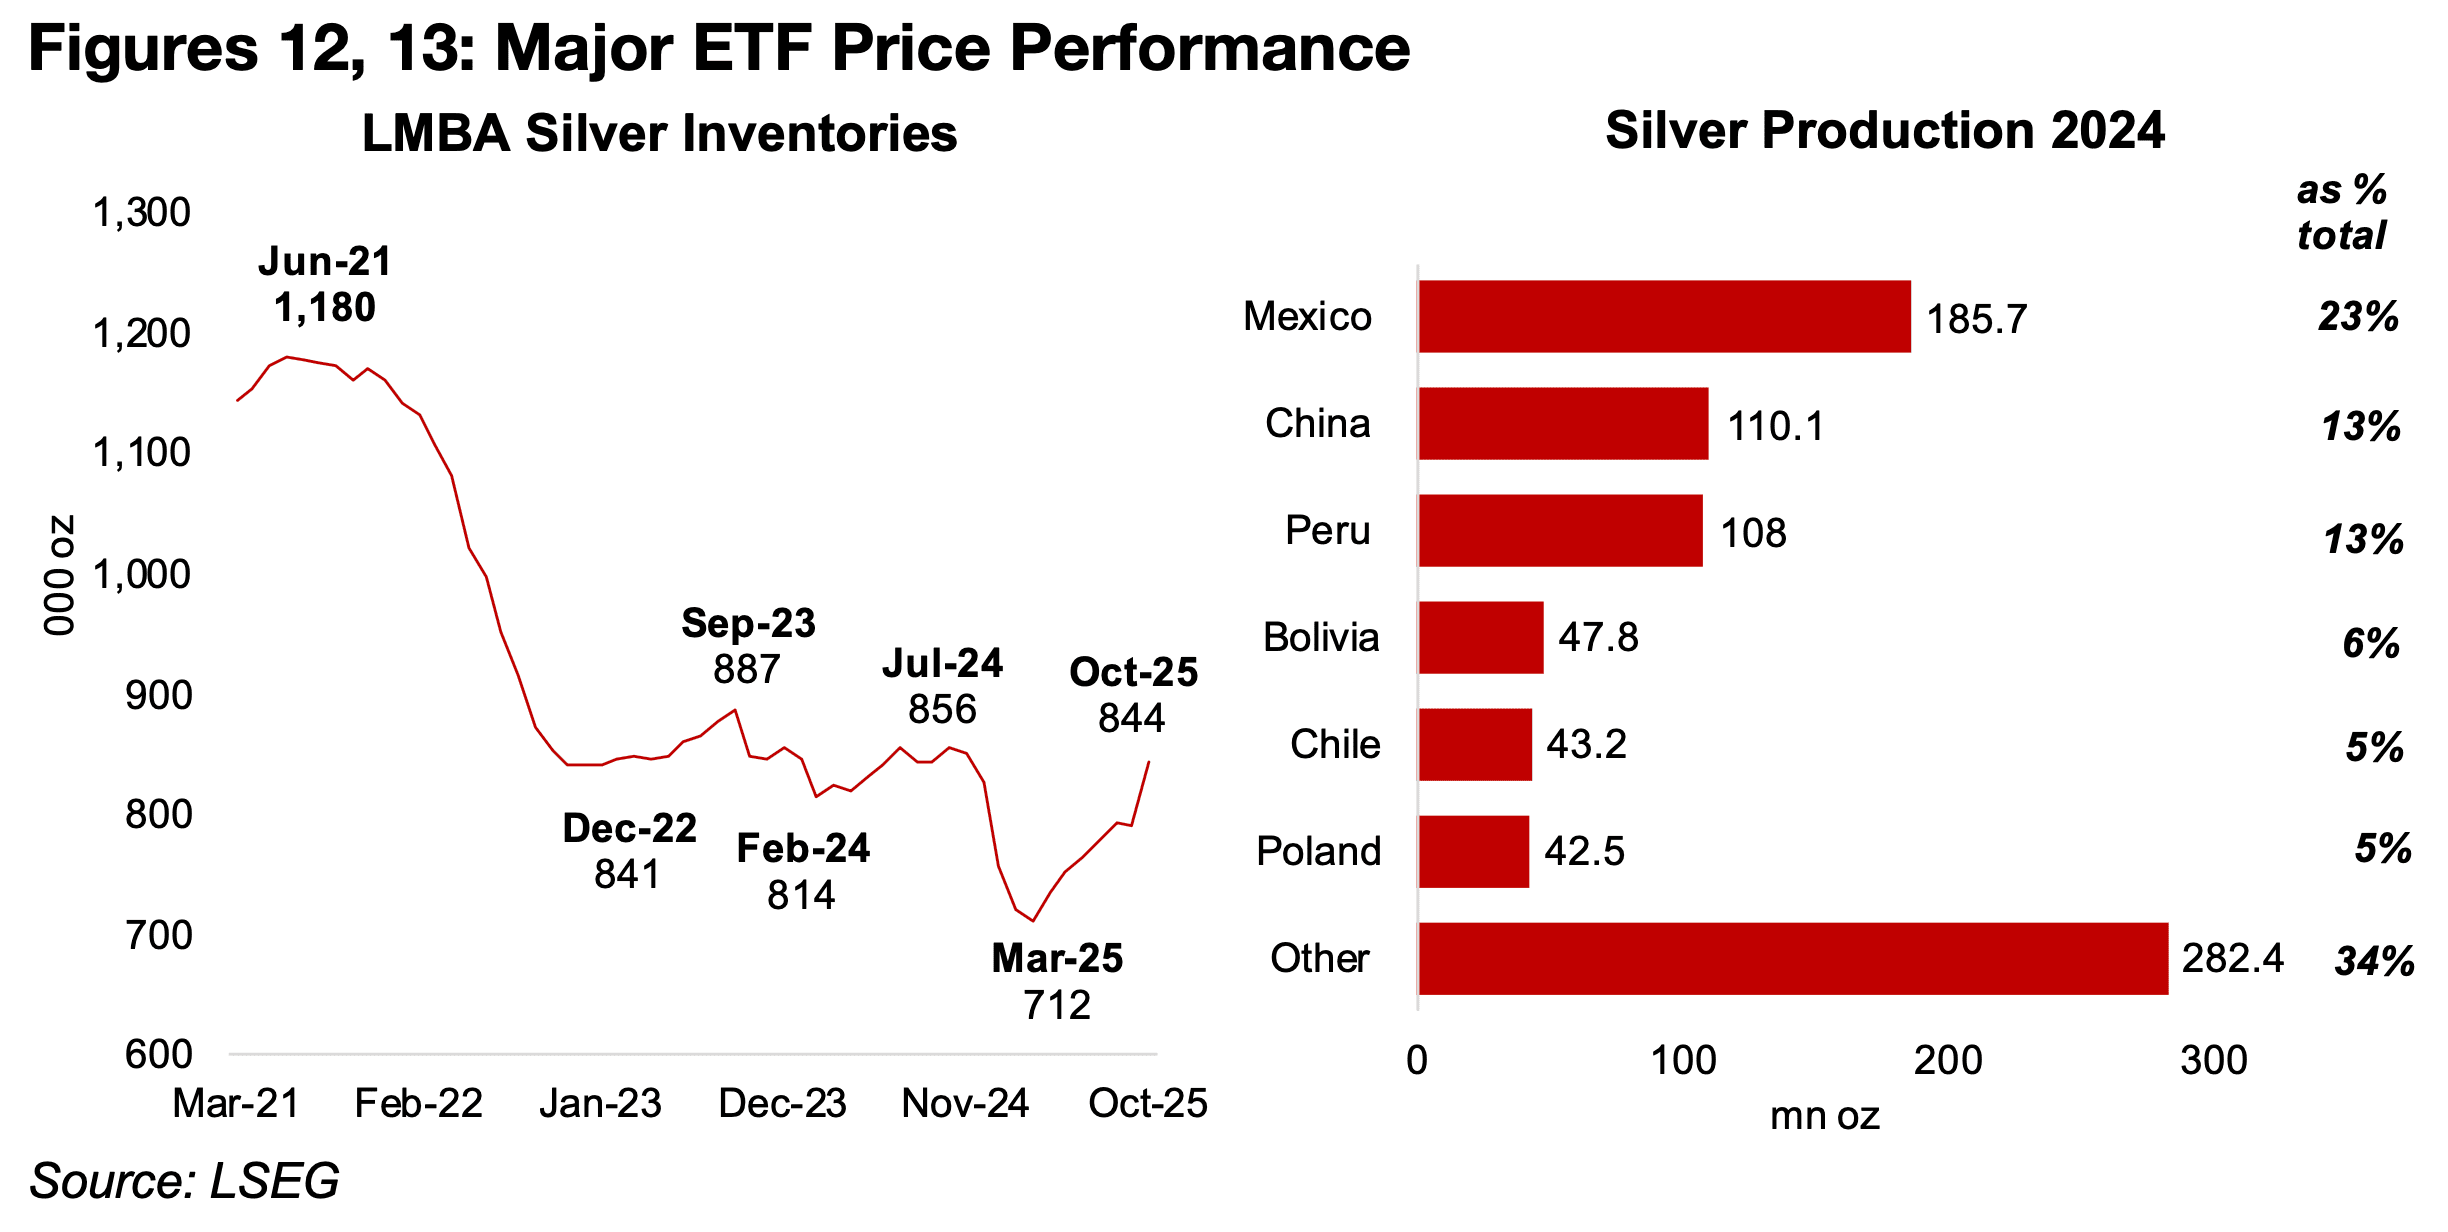
The surge in silver has been driven by a fifth year of major deficit, with mine output
still expected to rise in 2025 and into next year, but with this still being outpaced by
demand. While silver inventories at the LBMA rebounded to 844k oz in October 2025,
up from low of 712k oz in March 2025, they still remain far below the recent highs of
1,180k oz (Figure 12). However, this rebound appears to have been driven by
significant silver imports from China.
Export of the metal from China started to rise in September 2025 and had doubled
by October 2025 versus the average for the first eight months of the year. The spike
in the silver price implies that this trend has likely continued through to December,
with China inventories depleted further, barring another slump in the silver stocks at
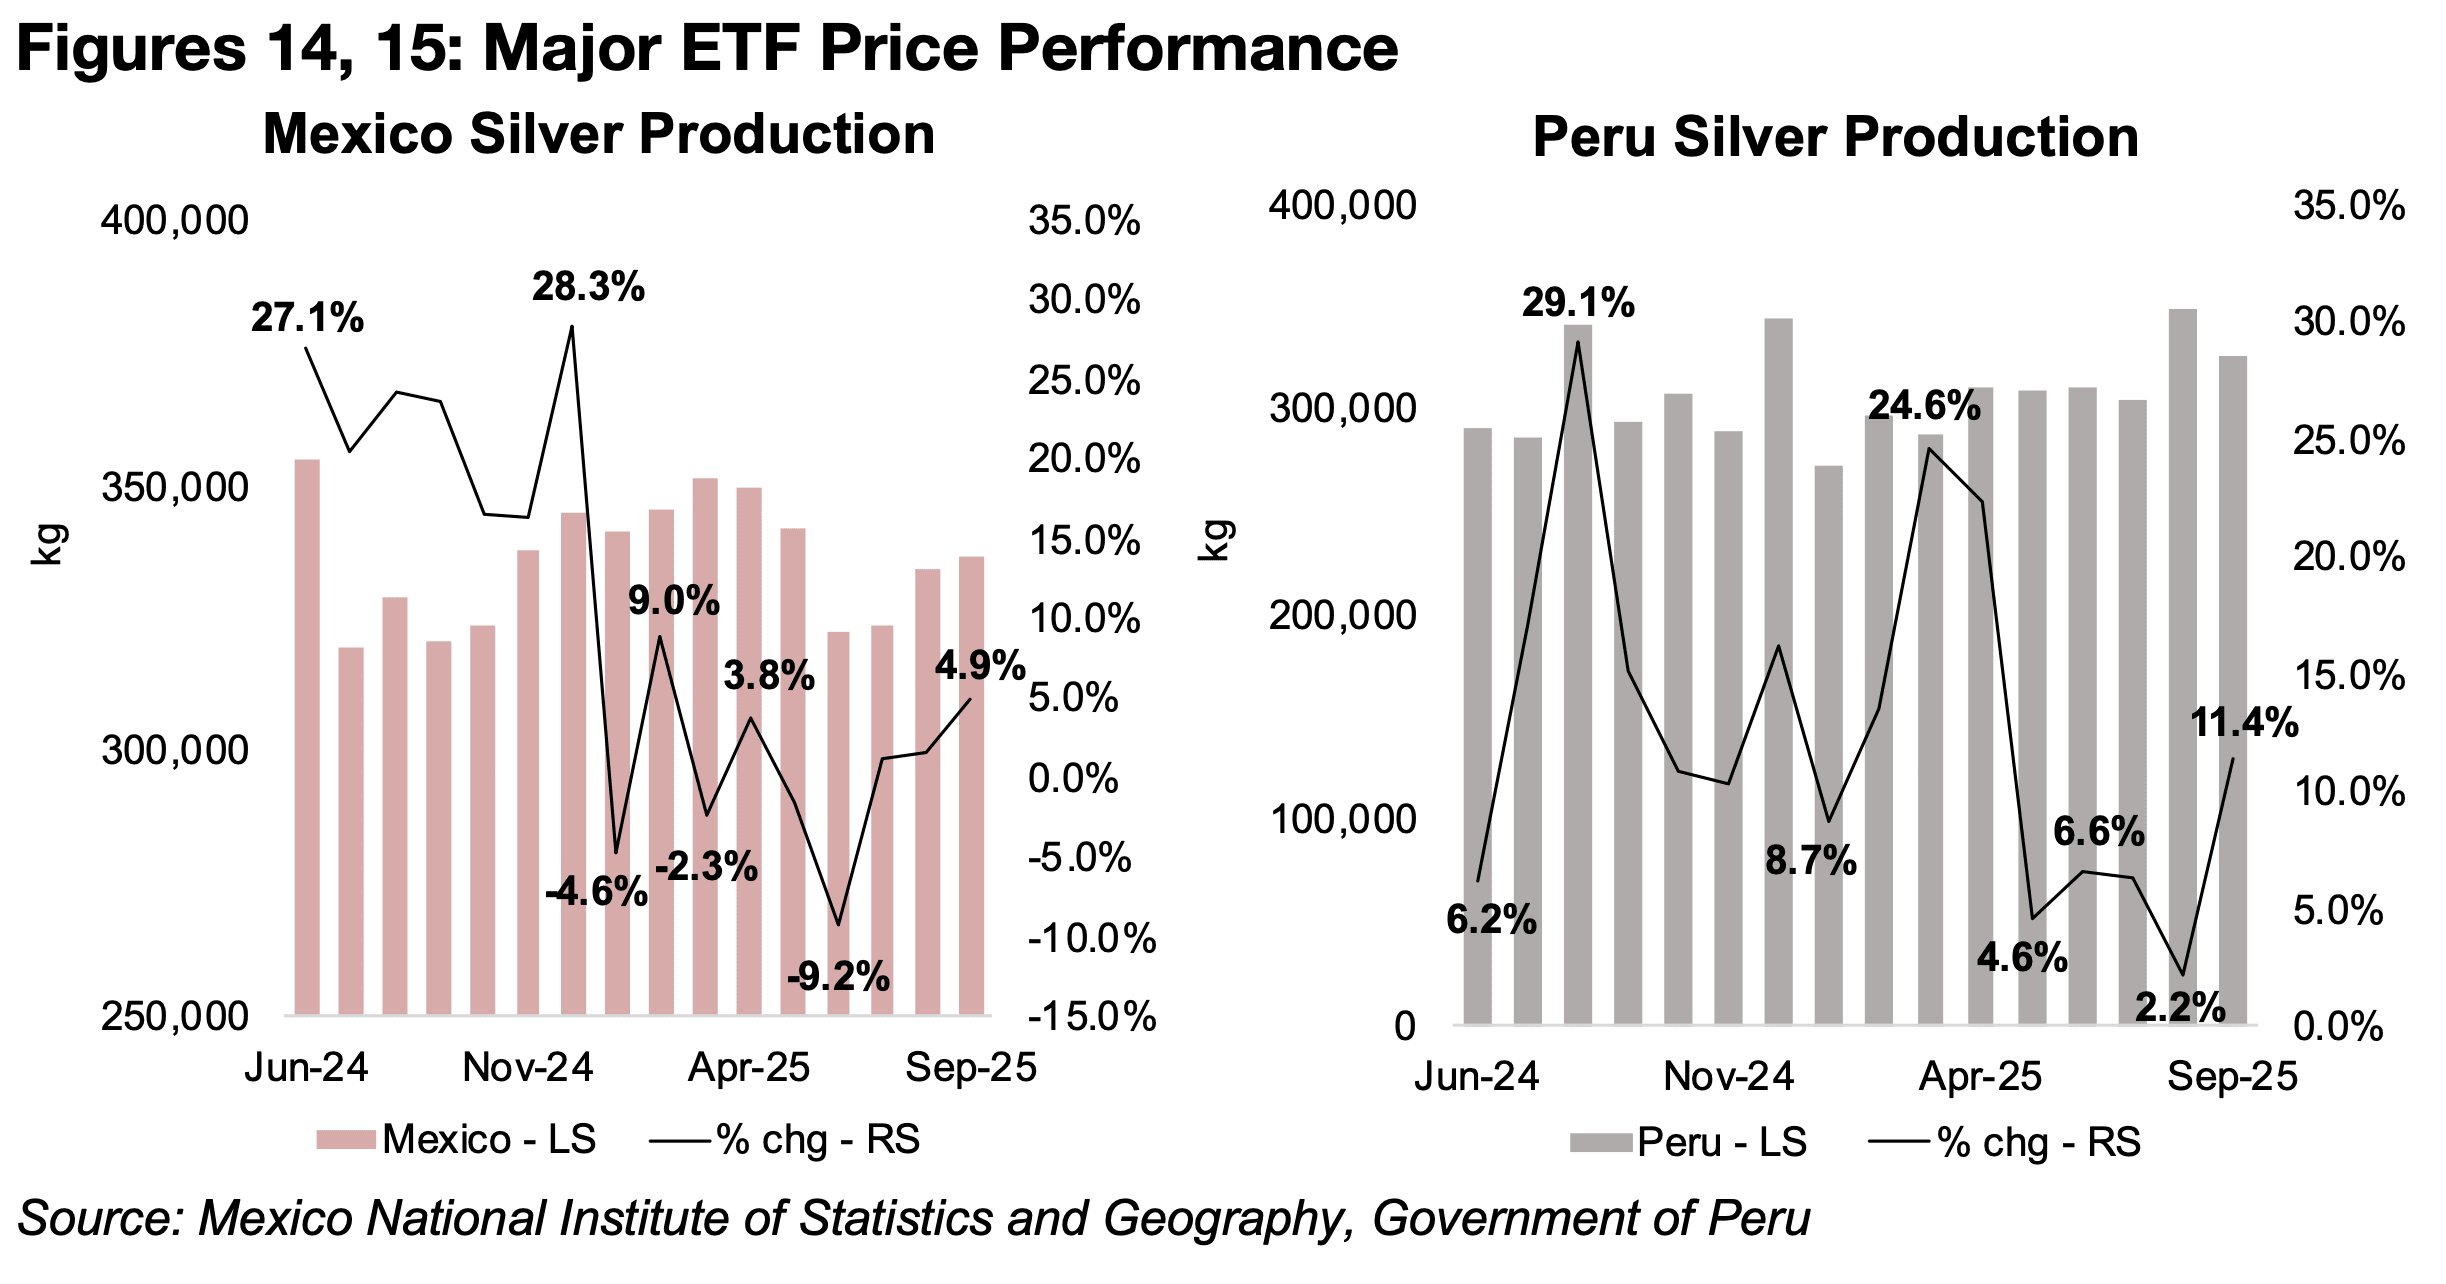
the LBMA. Output growth of silver at the two largest global producers that report
monthly figures, Mexico and Peru, has rebounded as of the most recently reported
September 2025 figures (Figure 13). Mexico’s silver output growth was 4.9%, up from
lows of -9.2% in March 2025, and Peru’s production rose 11.4%, up from lows of
2.2% in September 2025 (Figures 14, 15). China does not report monthly silver
production, but available data indicates some growth this year.
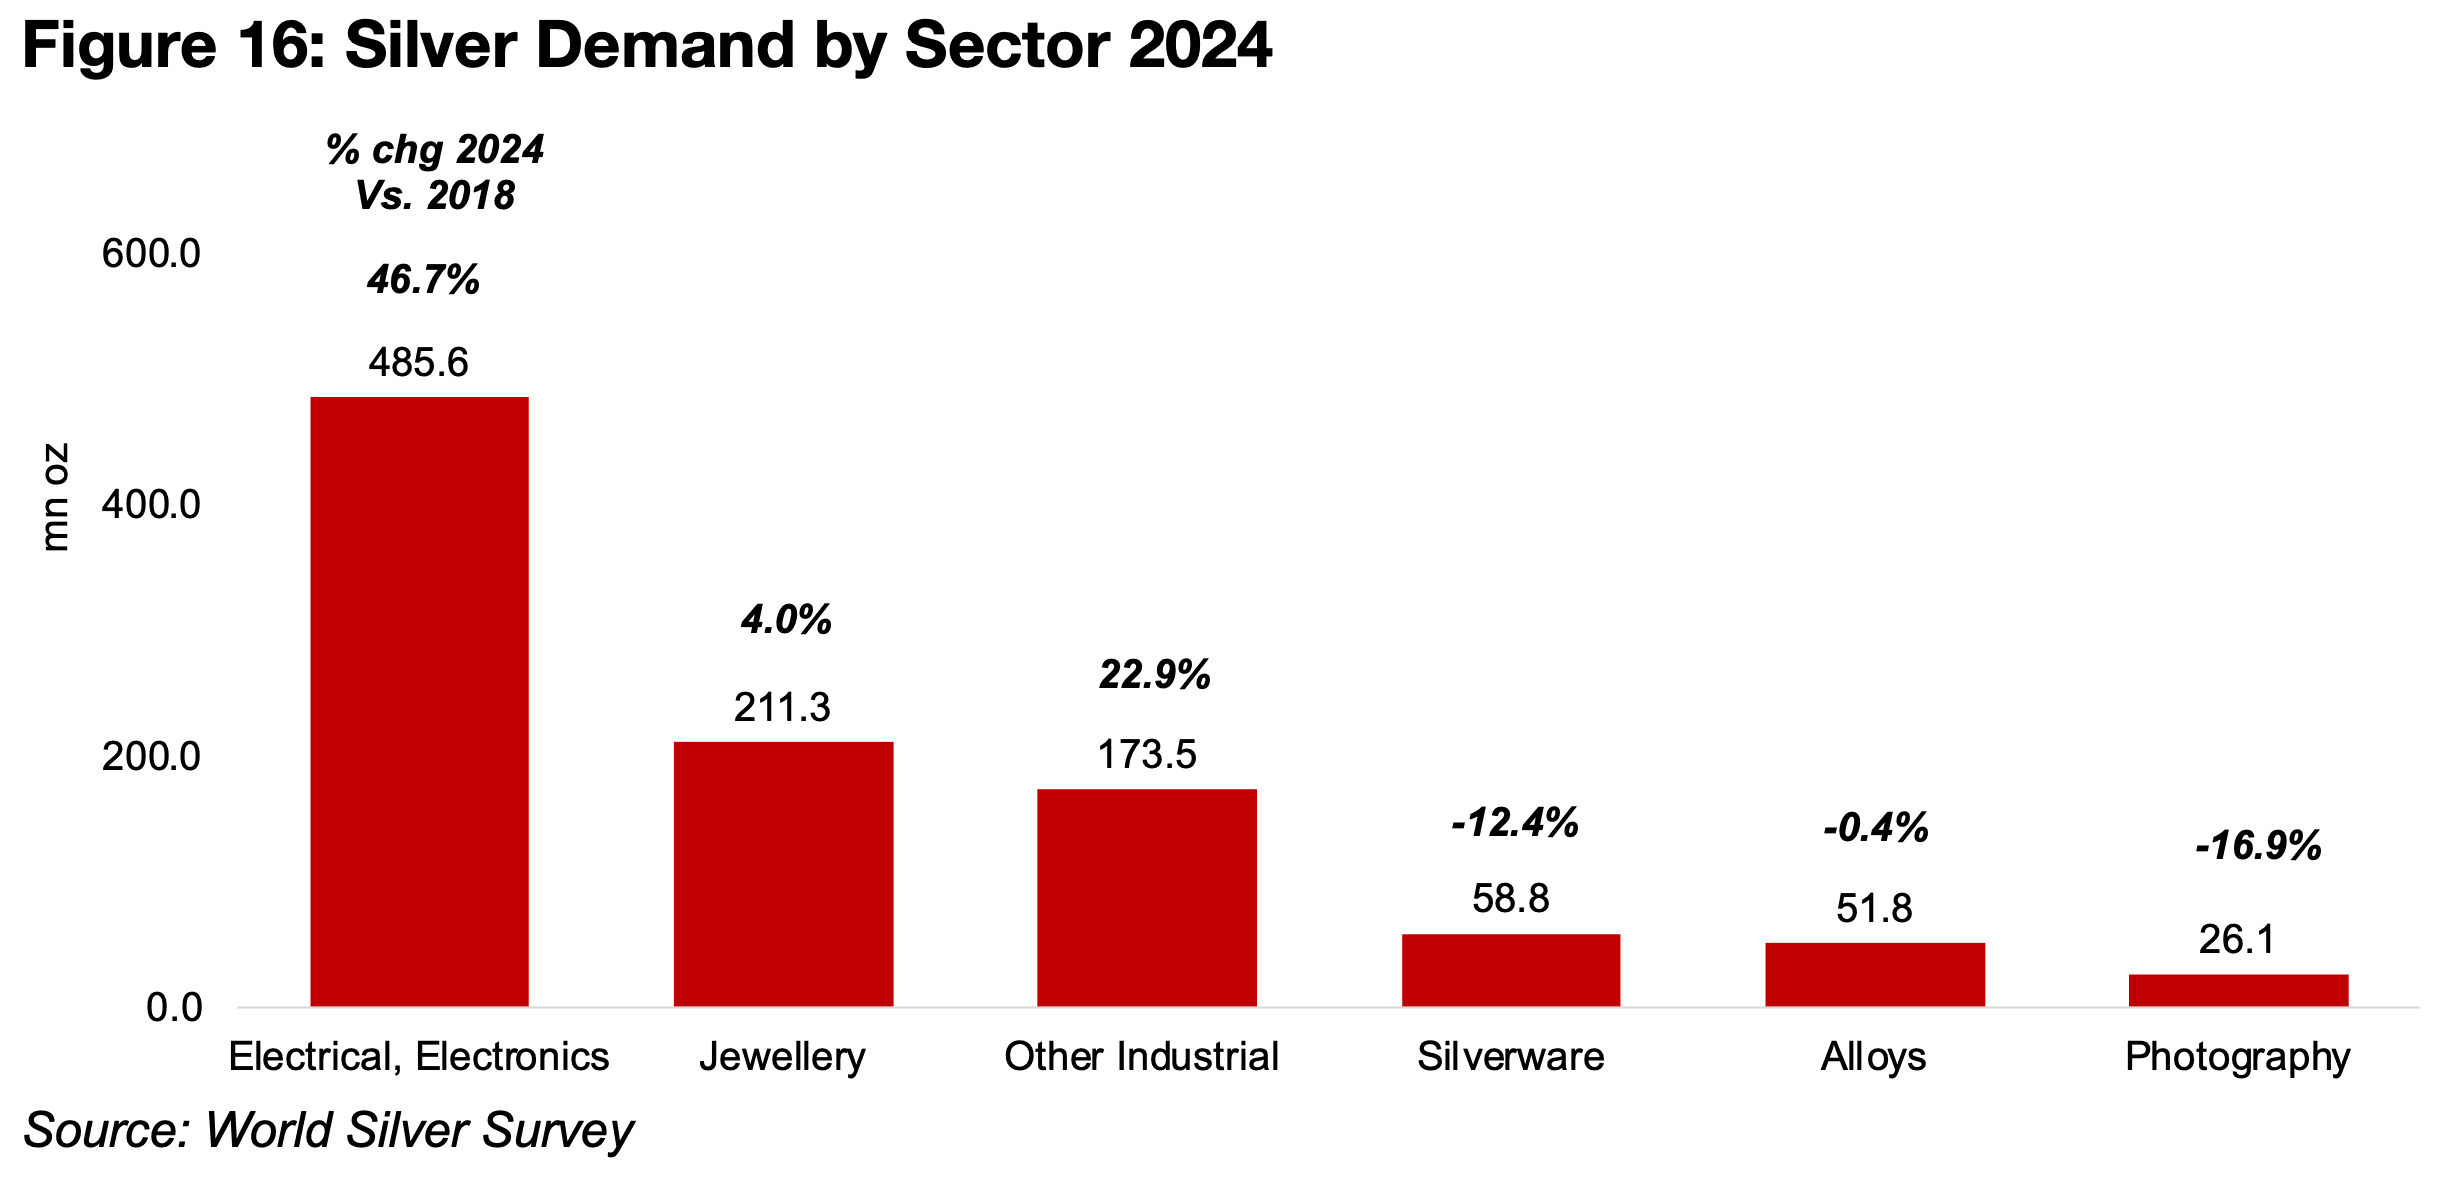
The demand in silver is partly driven by monetary factors, similar to gold, but also has a large component of demand from industrial factors, similar to copper. Silver demand also has likely been driven partly by the AI boom, with the electrical and electronics segment comprising the largest proportion of demand, and growing by far the most rapidly, up 46.7% from 2018 (Figure 16). The other industrial segment has also risen substantially, up 22.9% since 2018, with jewellery demand rising moderately and silverware, alloys and photography demand declining over the past six years. A combination of a decline in electrical and electronics demand from a cooling AI of the boom, a rebuilding of global inventories, and continued growth pickup for major producers could all potentially put some pressure on silver prices.
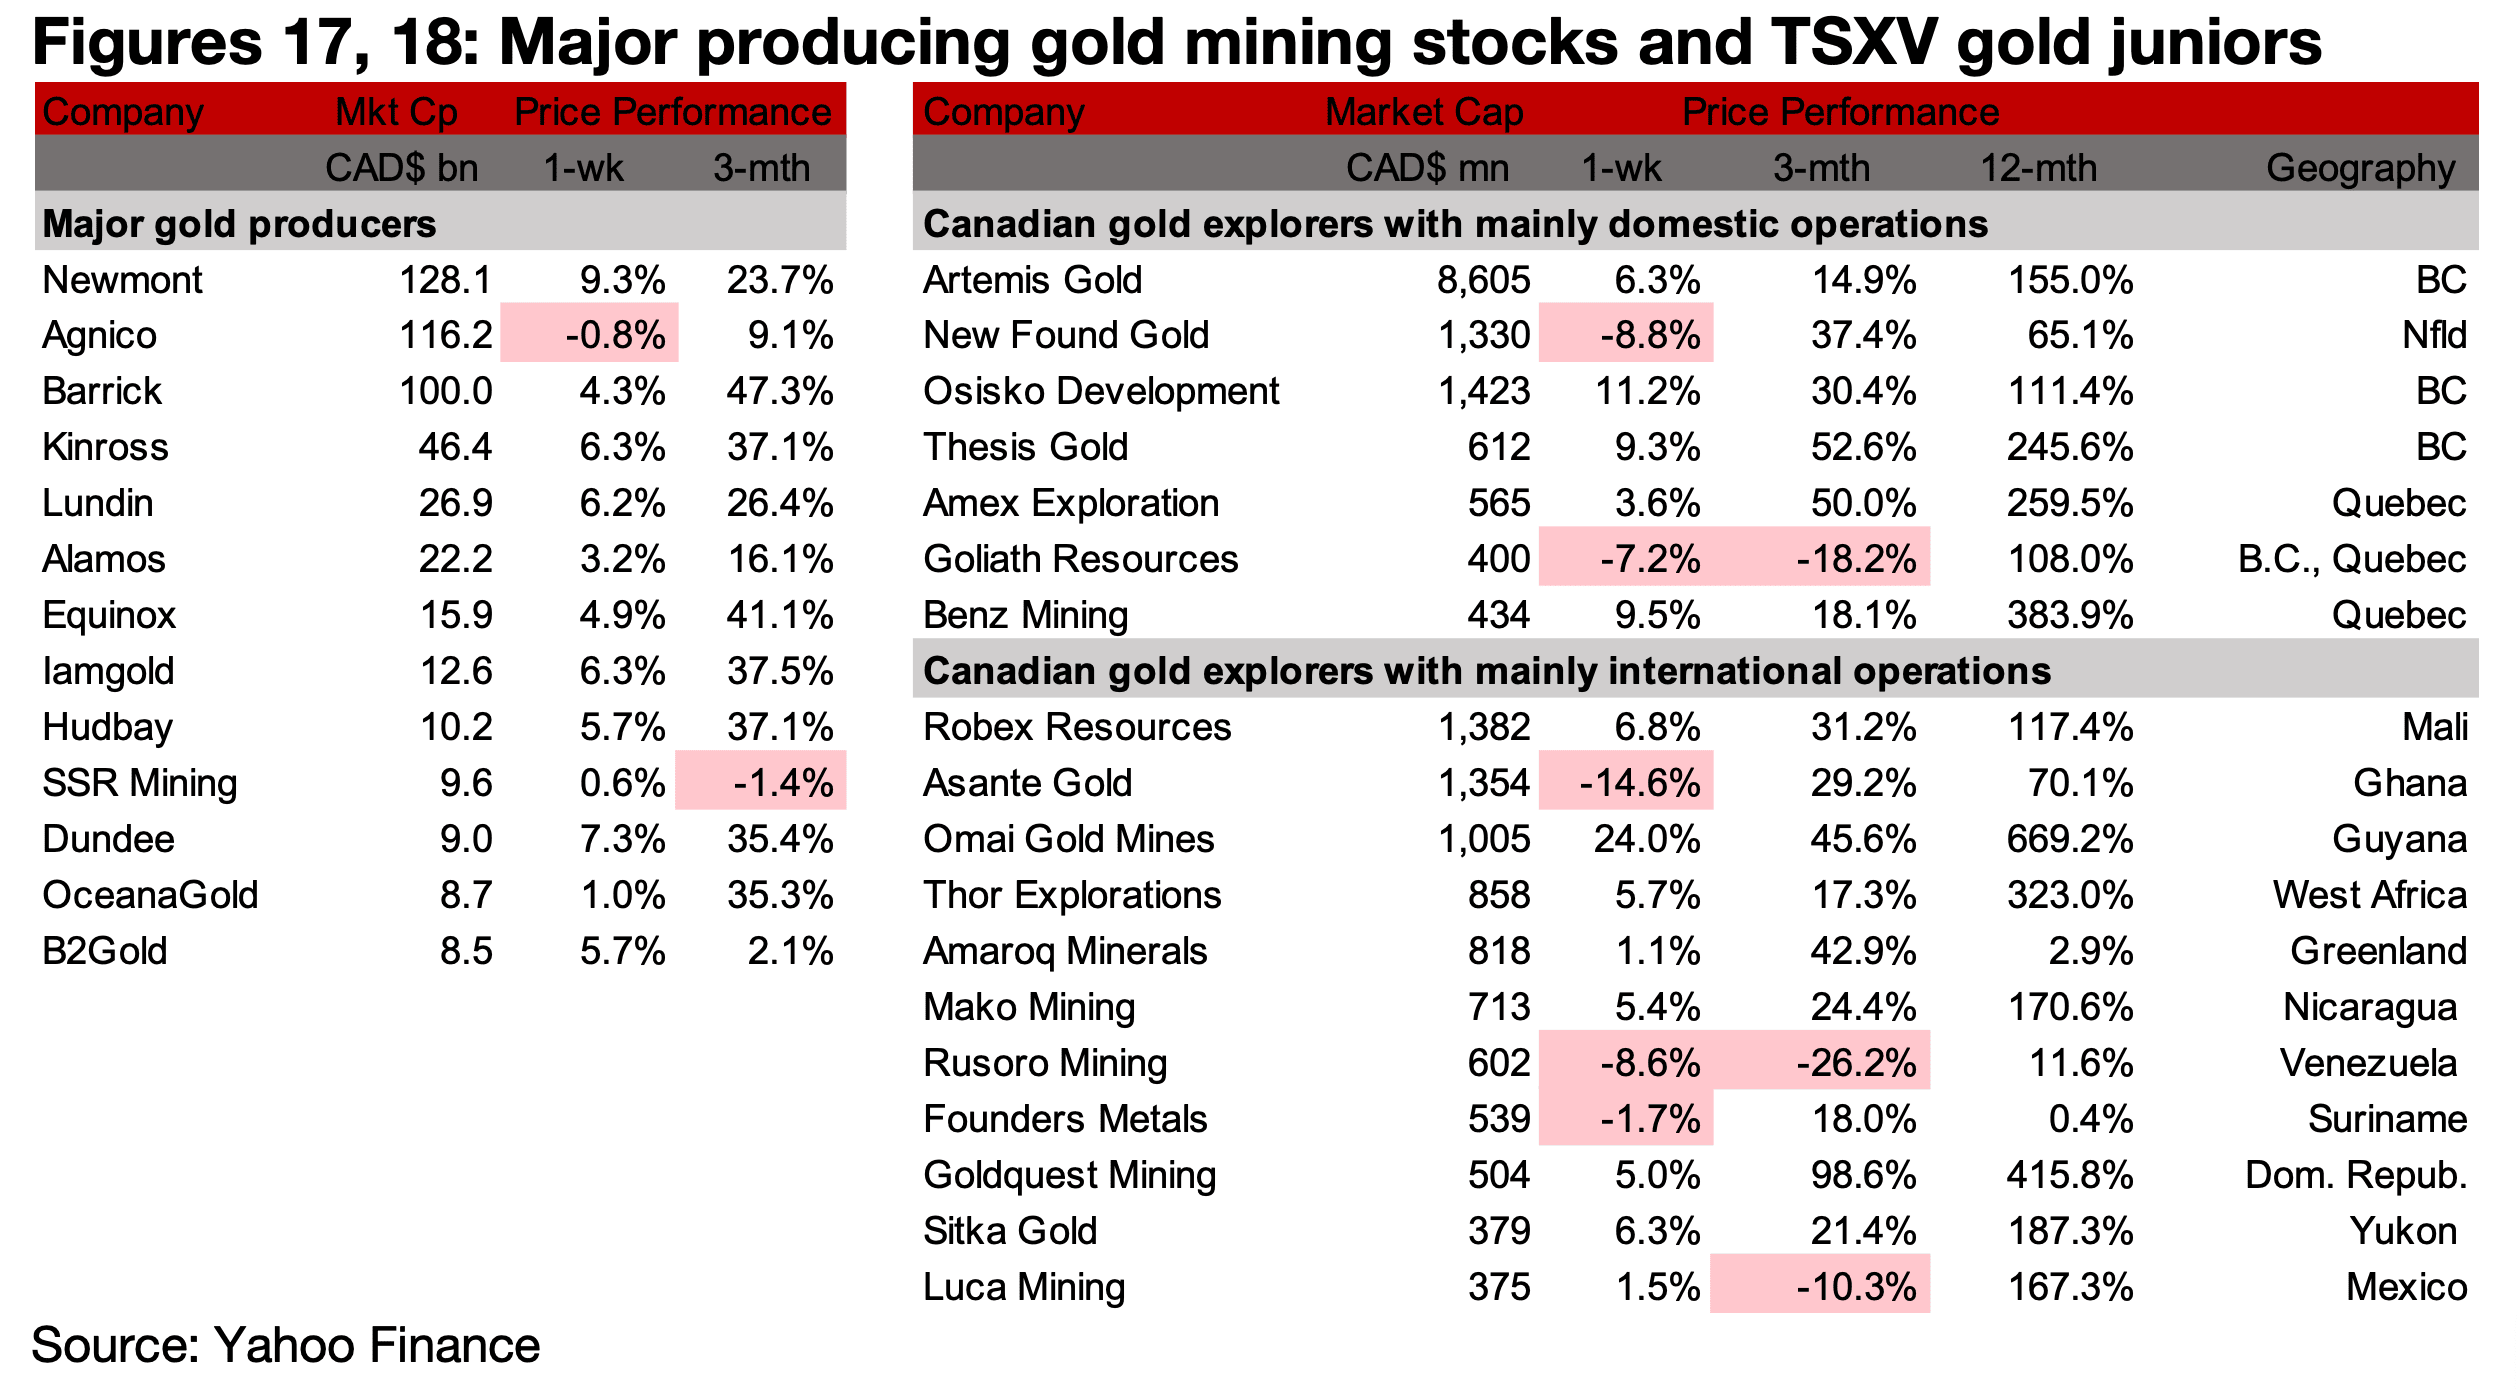
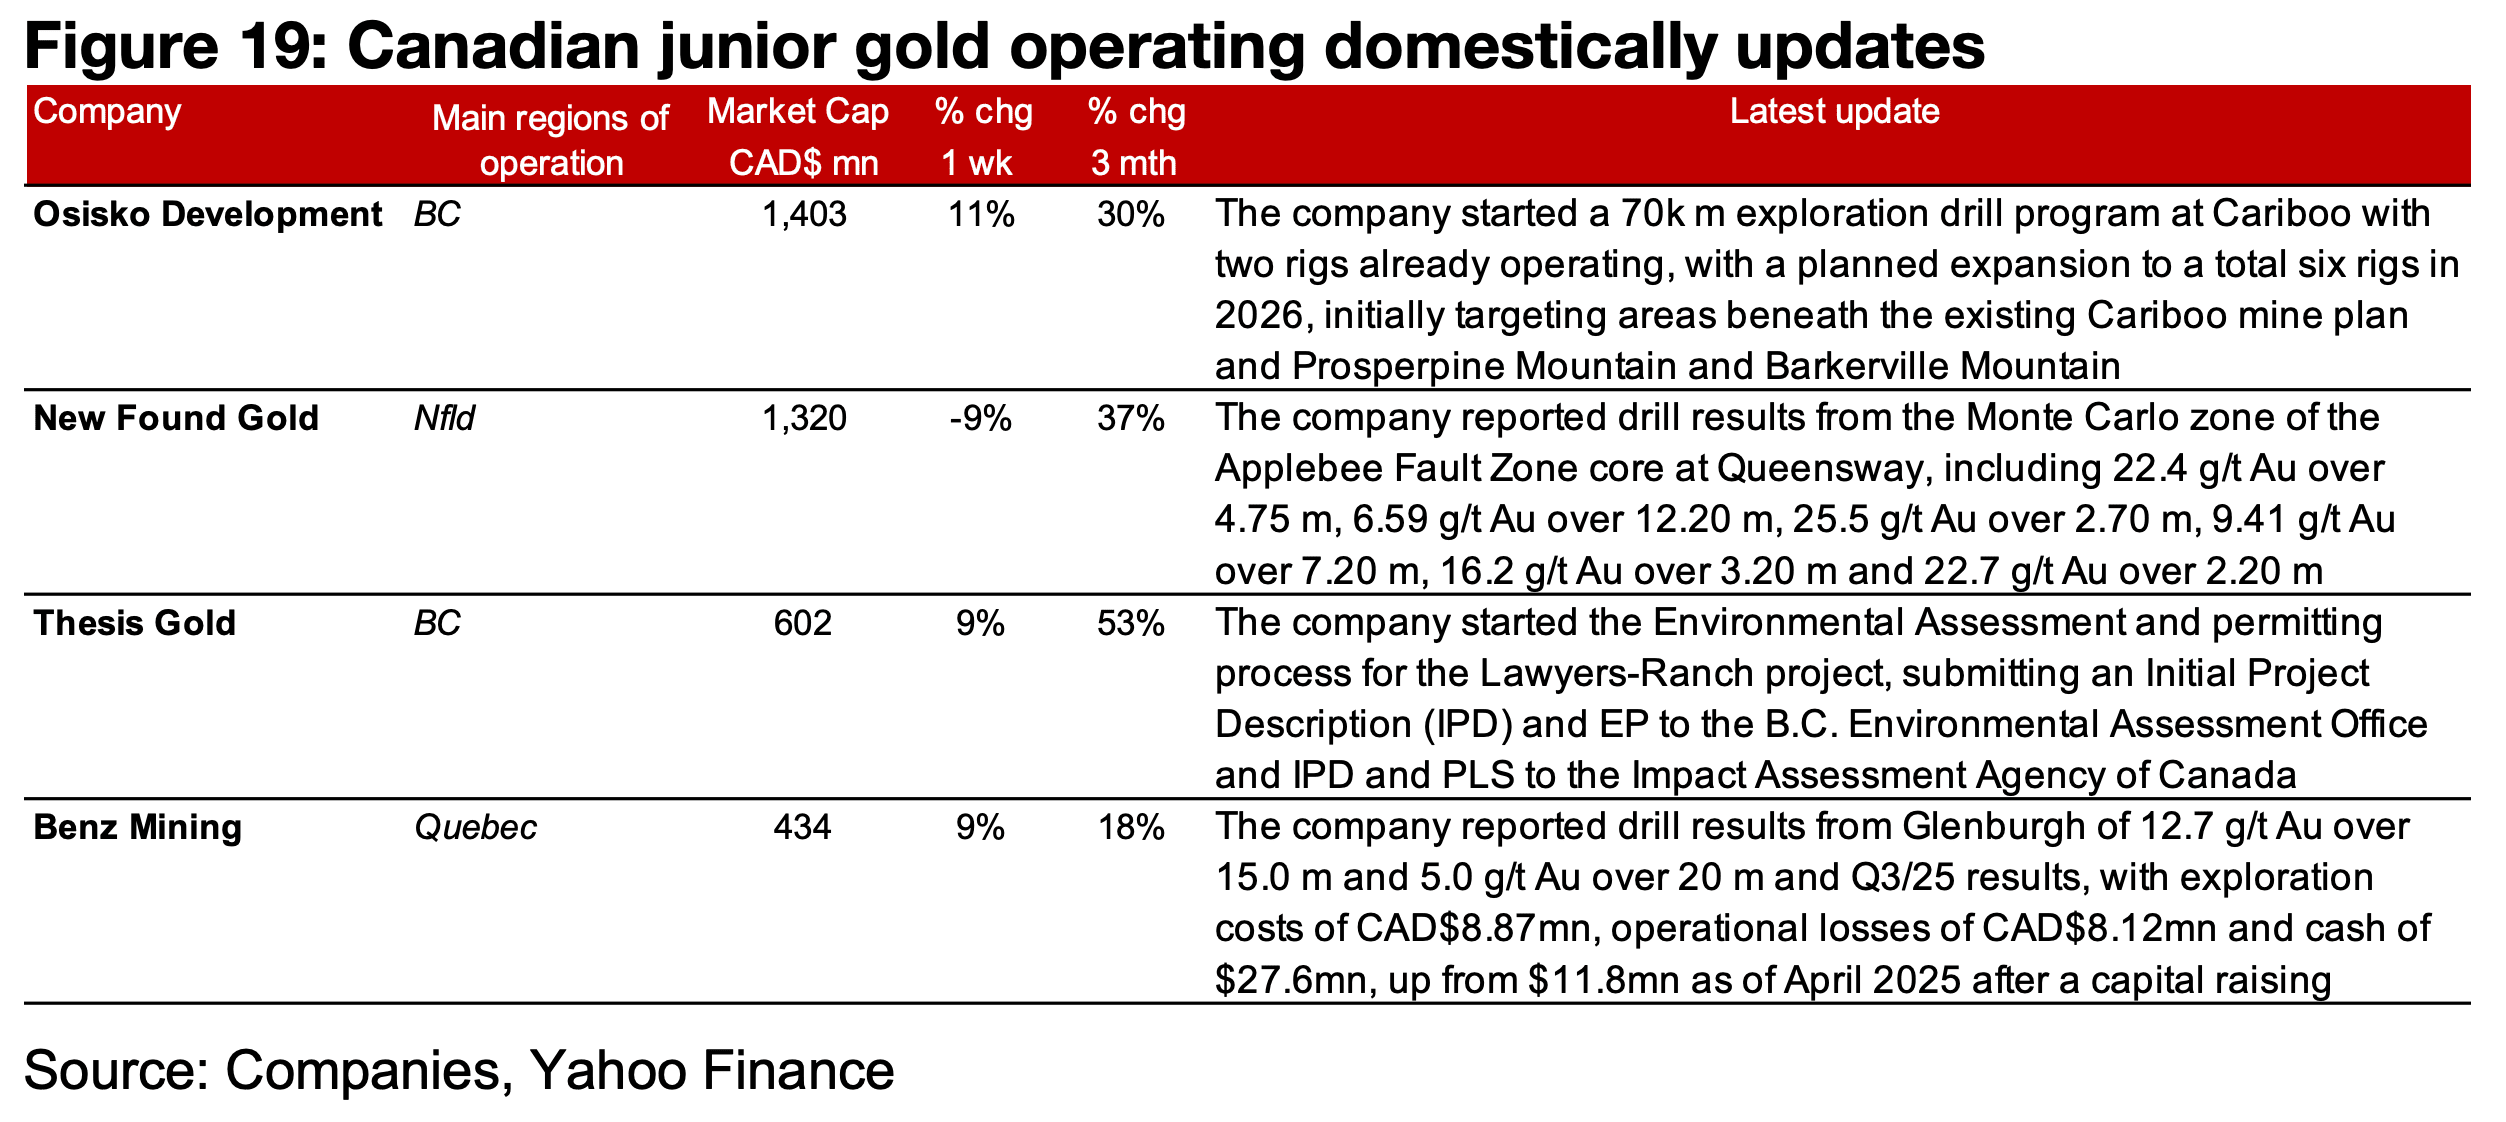
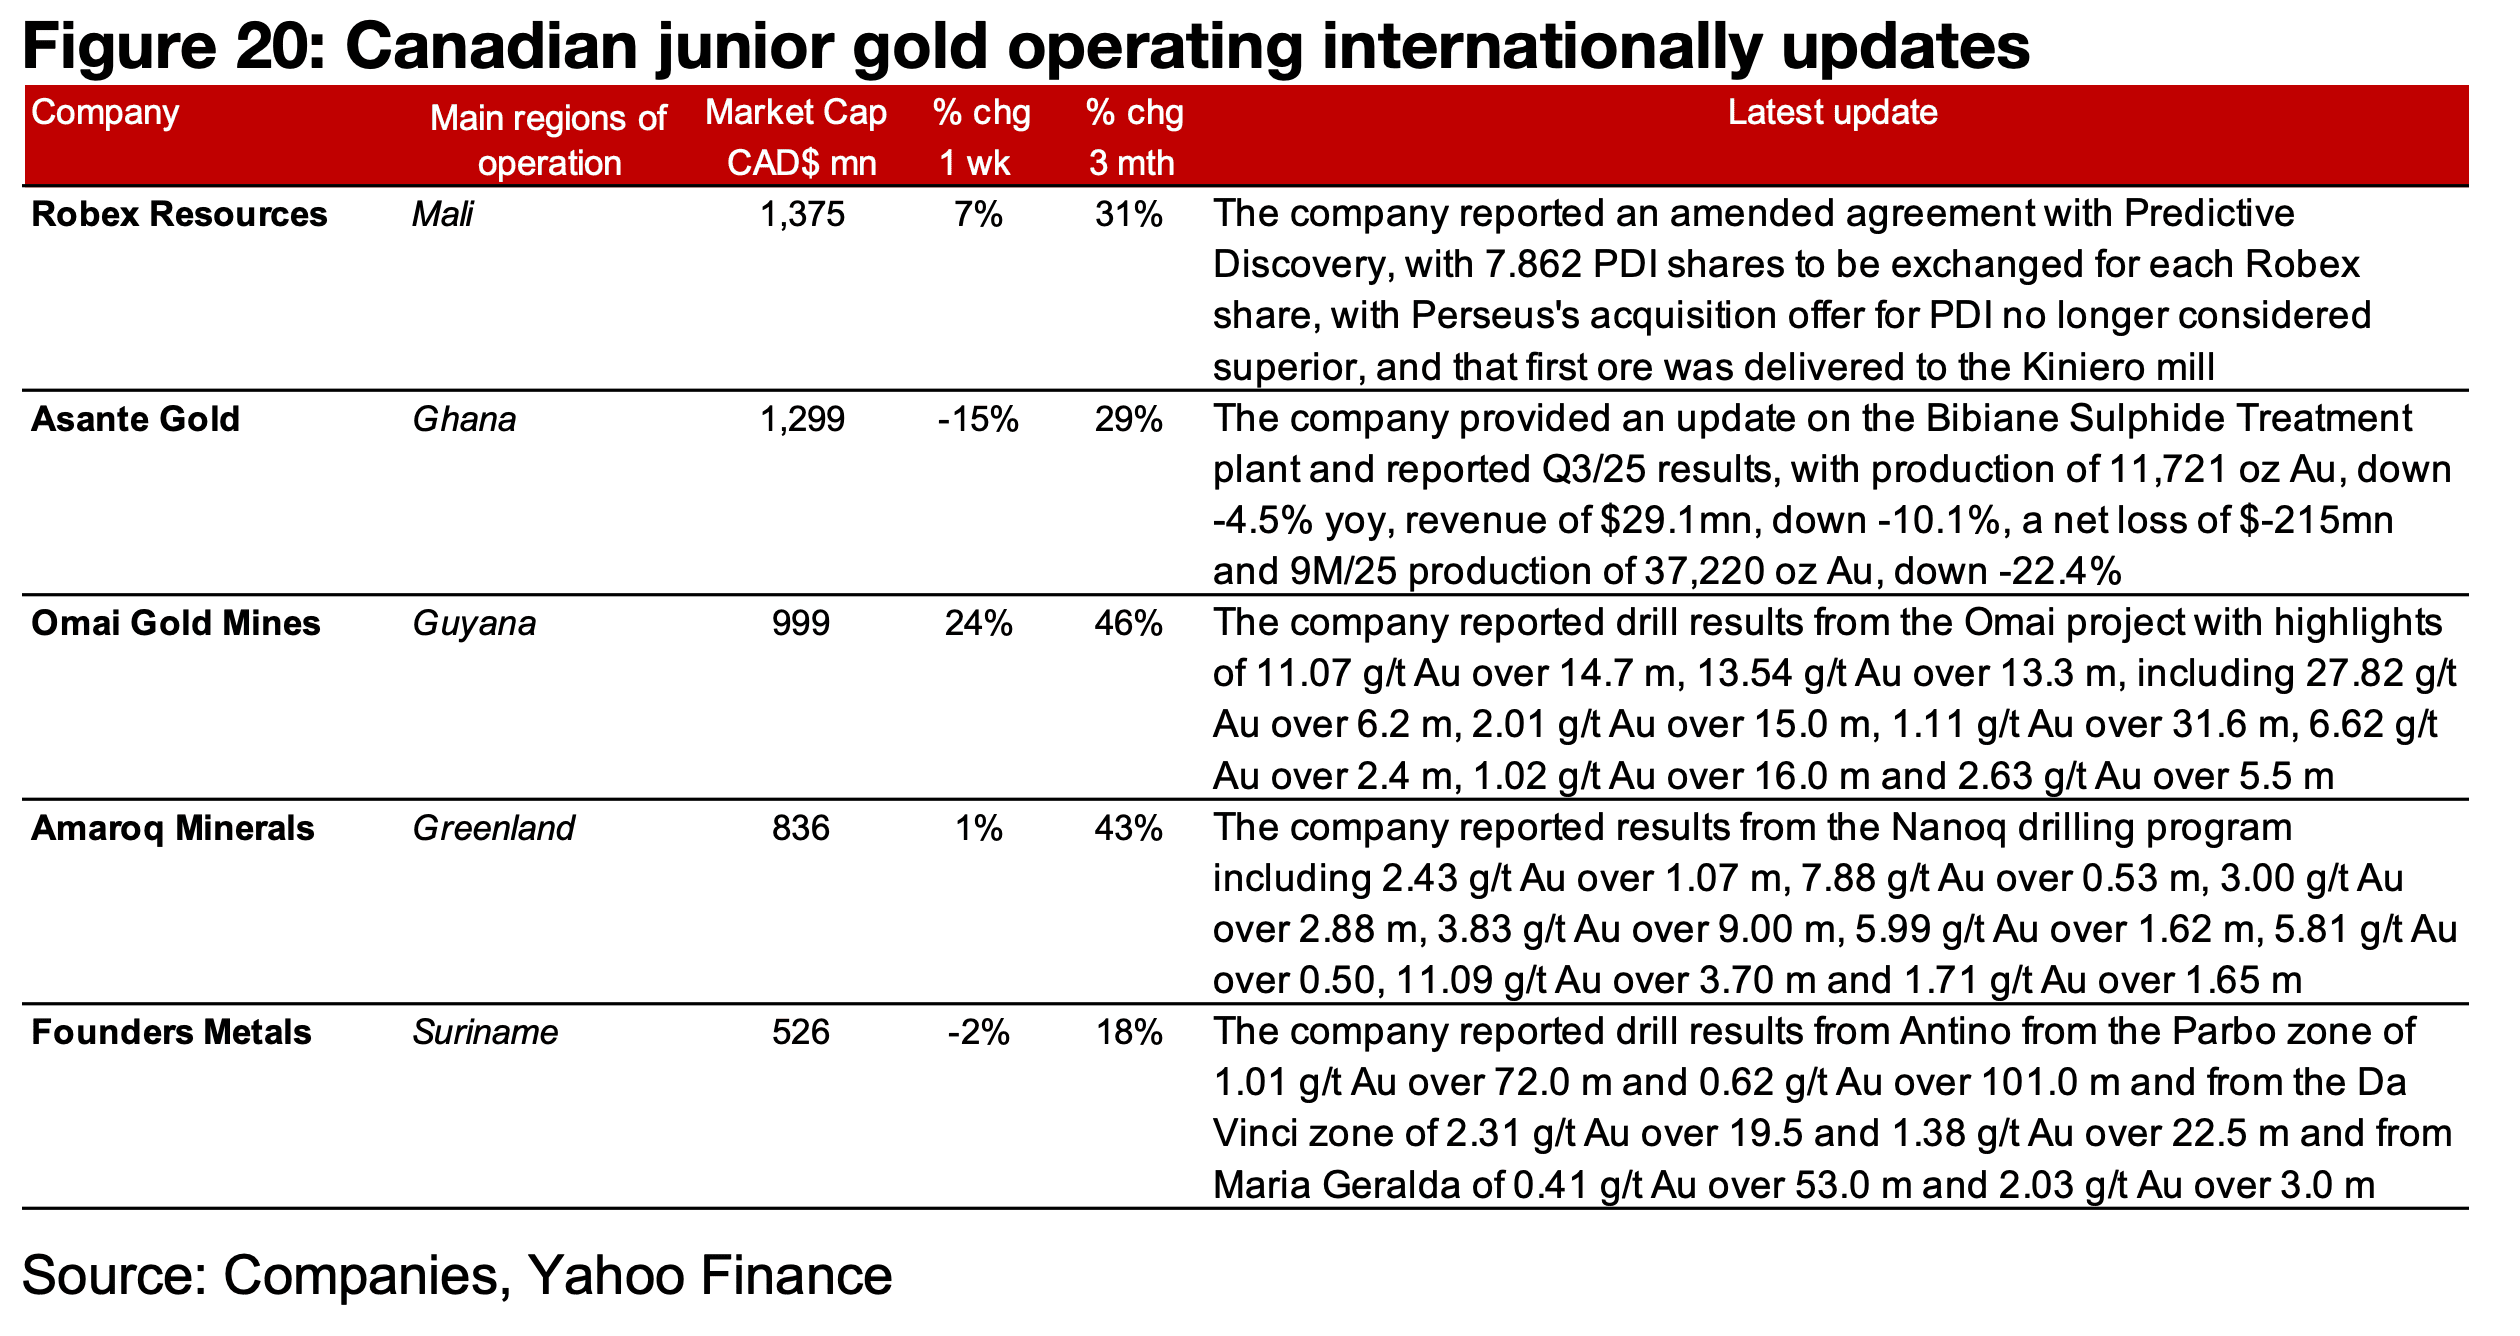
The major producers mostly saw large gains, with only Agnico Eagle down, and TSXV gold mainly rose (Figures 17, 18). For the TSXV gold companies operating mainly domestically, Osisko Dev. started 70k m of drilling at Cariboo, New Found reported drill results from Monte Carlo Queensway, Thesis started the EA for Lawyers-Ranch and Benz announced drill results from Glenburgh and Q3/25 results (Figure 19). For the TSXV gold companies operating mainly internationally, Robex amended its merger agreement with PDI and first ore was delivered to Kiniero, Asante gave an update on Bibiane and reported Q3/25 results and Omai, Amaroq and Founders announced drill results from the Omai, Nanoq and Antino projects (Figure 20).
Disclaimer: This report is for informational use only and should not be used an alternative to the financial and legal advice of a qualified professional in business planning and investment. We do not represent that forecasts in this report will lead to a specific outcome or result, and are not liable in the event of any business action taken in whole or in part as a result of the contents of this report.
Author
Ben McGregor authors the Weekly Roundup at CanadianMiningReport.com, providing sharp analysis of the metals and mining sector. With a talent for spotting trends, Ben distills complex market shifts into clear, engaging insights on TSXV junior miners. His weekly updates cover gold, copper, uranium, and more, blending data-driven perspectives with a knack for identifying opportunities. A vital resource for investors, Ben’s work navigates the dynamic junior mining landscape with precision.