January 19, 2026
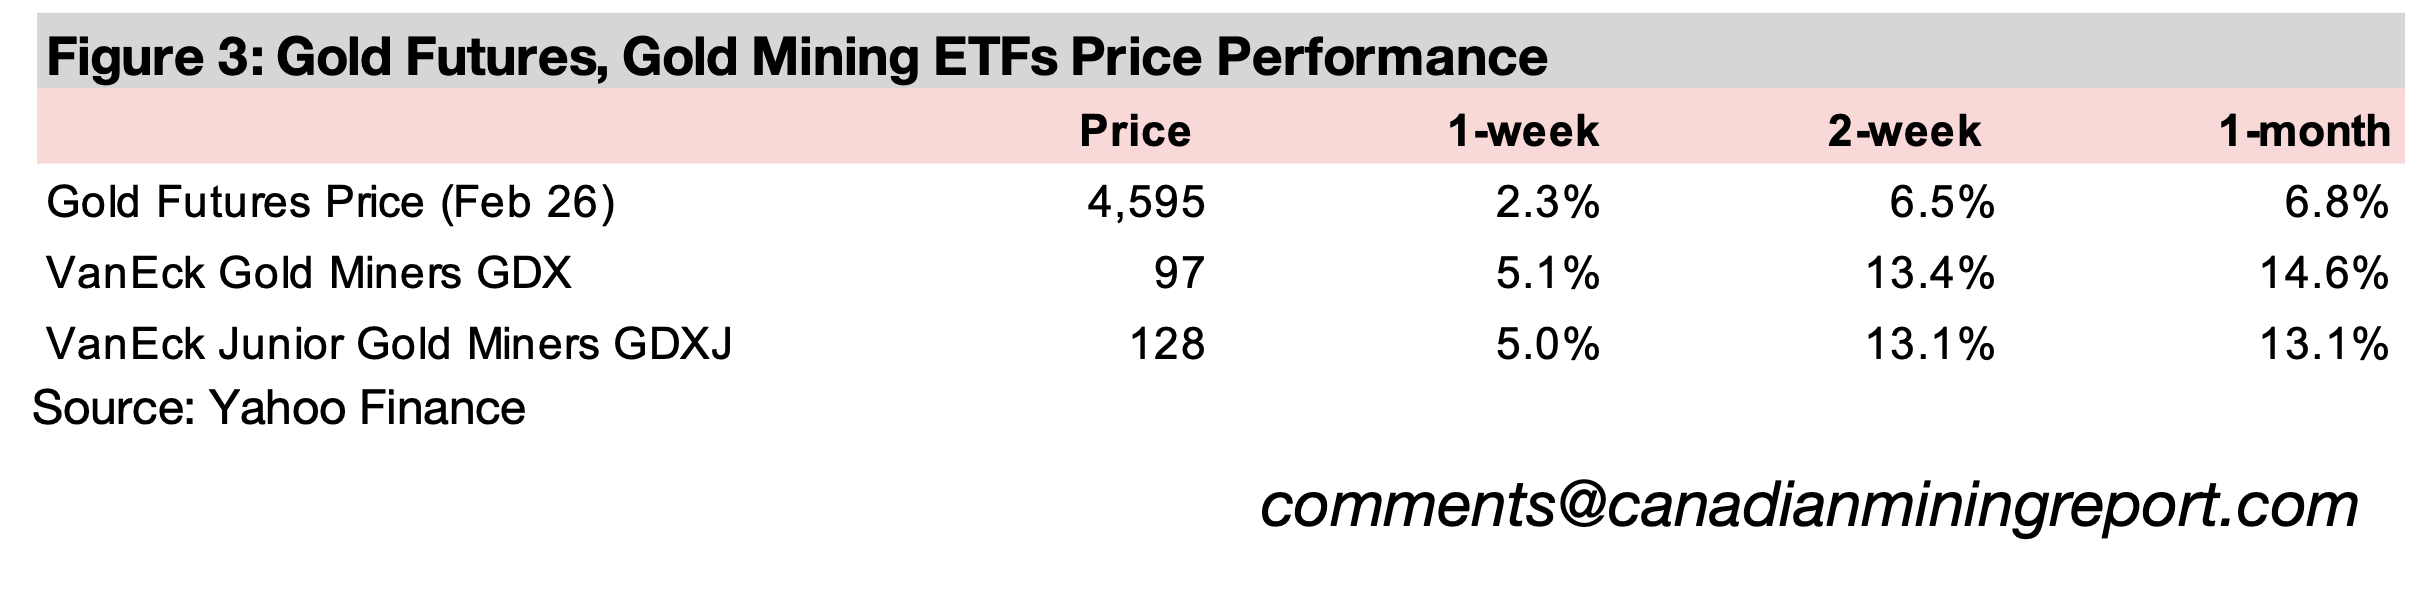
Gold rose 2.3% to US$4,595/oz, gaining for a second week on limited major economic news, with a broader macro driver being a continued deterioration in the global fiscal outlook with government debt expected to rise and deficits widen.
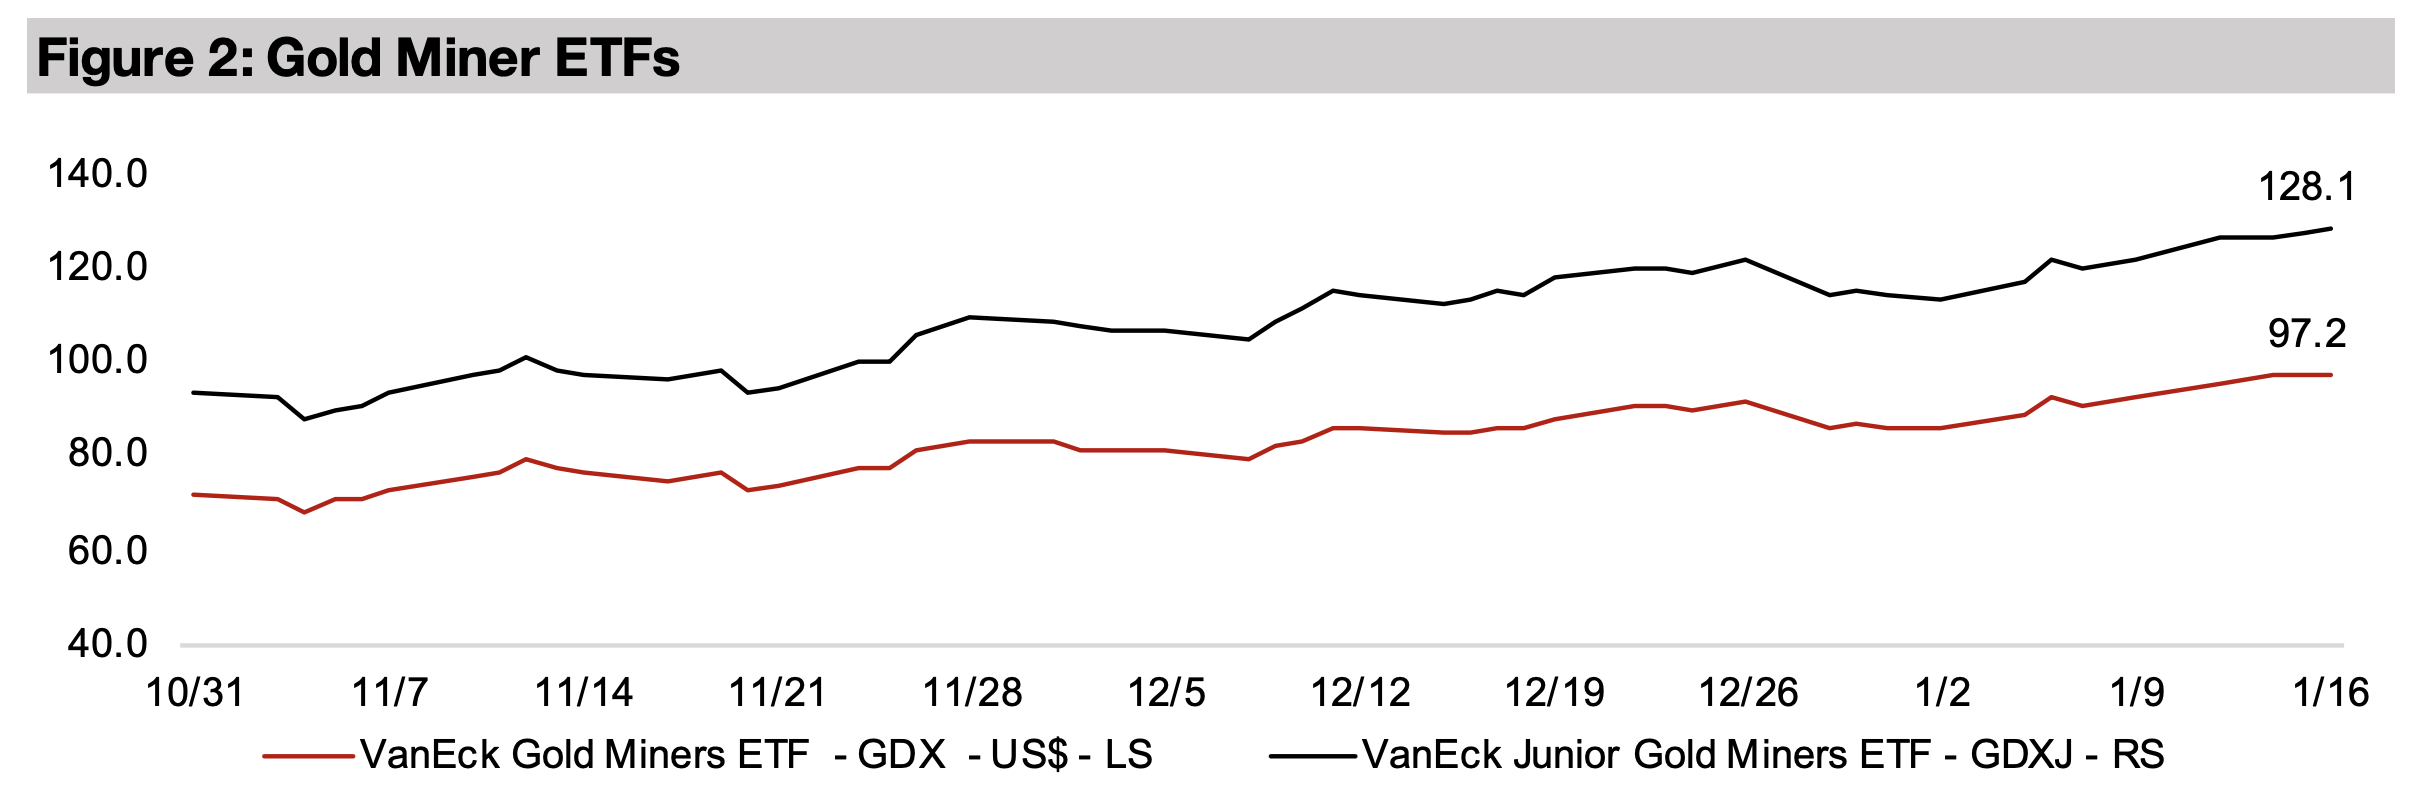
The gold stocks rose on the increase in the metal price, with the GDX up 5.0% and GDXJ adding 5.1%, far outpacing nearly flat large caps, with the S&P 500 down - 0.1%, and Nasdaq off -0.3%, while small caps rose with the Russell 2000 up 2.4%.


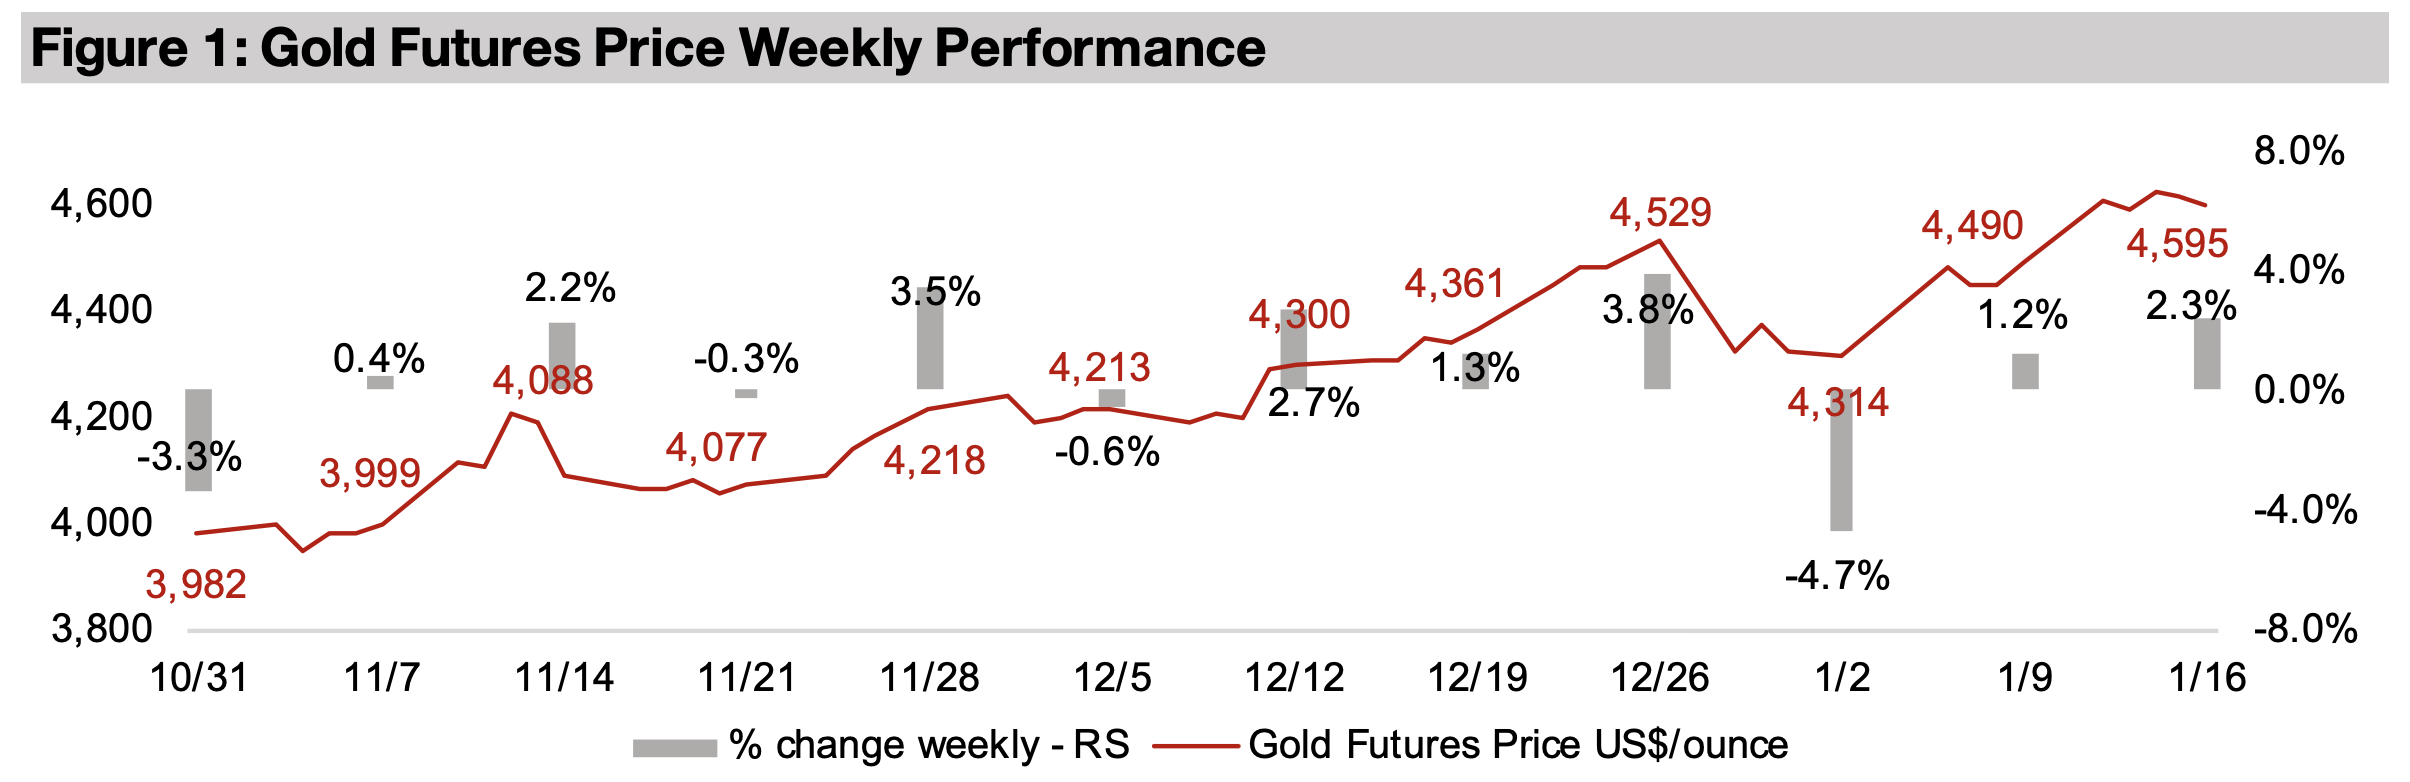
The gold price rose 2.3% to US$4,595/oz on limited major economic news, which
looked moderate in the context of the continued explosion of the silver price, which
had risen 11.6% through to end of last week, but jumped further over the weekend,
and is now up 17.5% since January 9, 2025. The moves in palladium and platinum
were also far more subdued than silver, up 1.1% and down -2.6%, respectively, while
copper declined -2.1% and both the iron ore and aluminum prices were flat. The gold
stocks rose, with the GDX up 5.1% and GDXJ rising 5.0%, outpacing almost flat large
caps, with the S&P 500 down -0.1%, the Nasdaq off -0.3%, although small caps
increased, with the Russell 2000 jumping 2.4%.
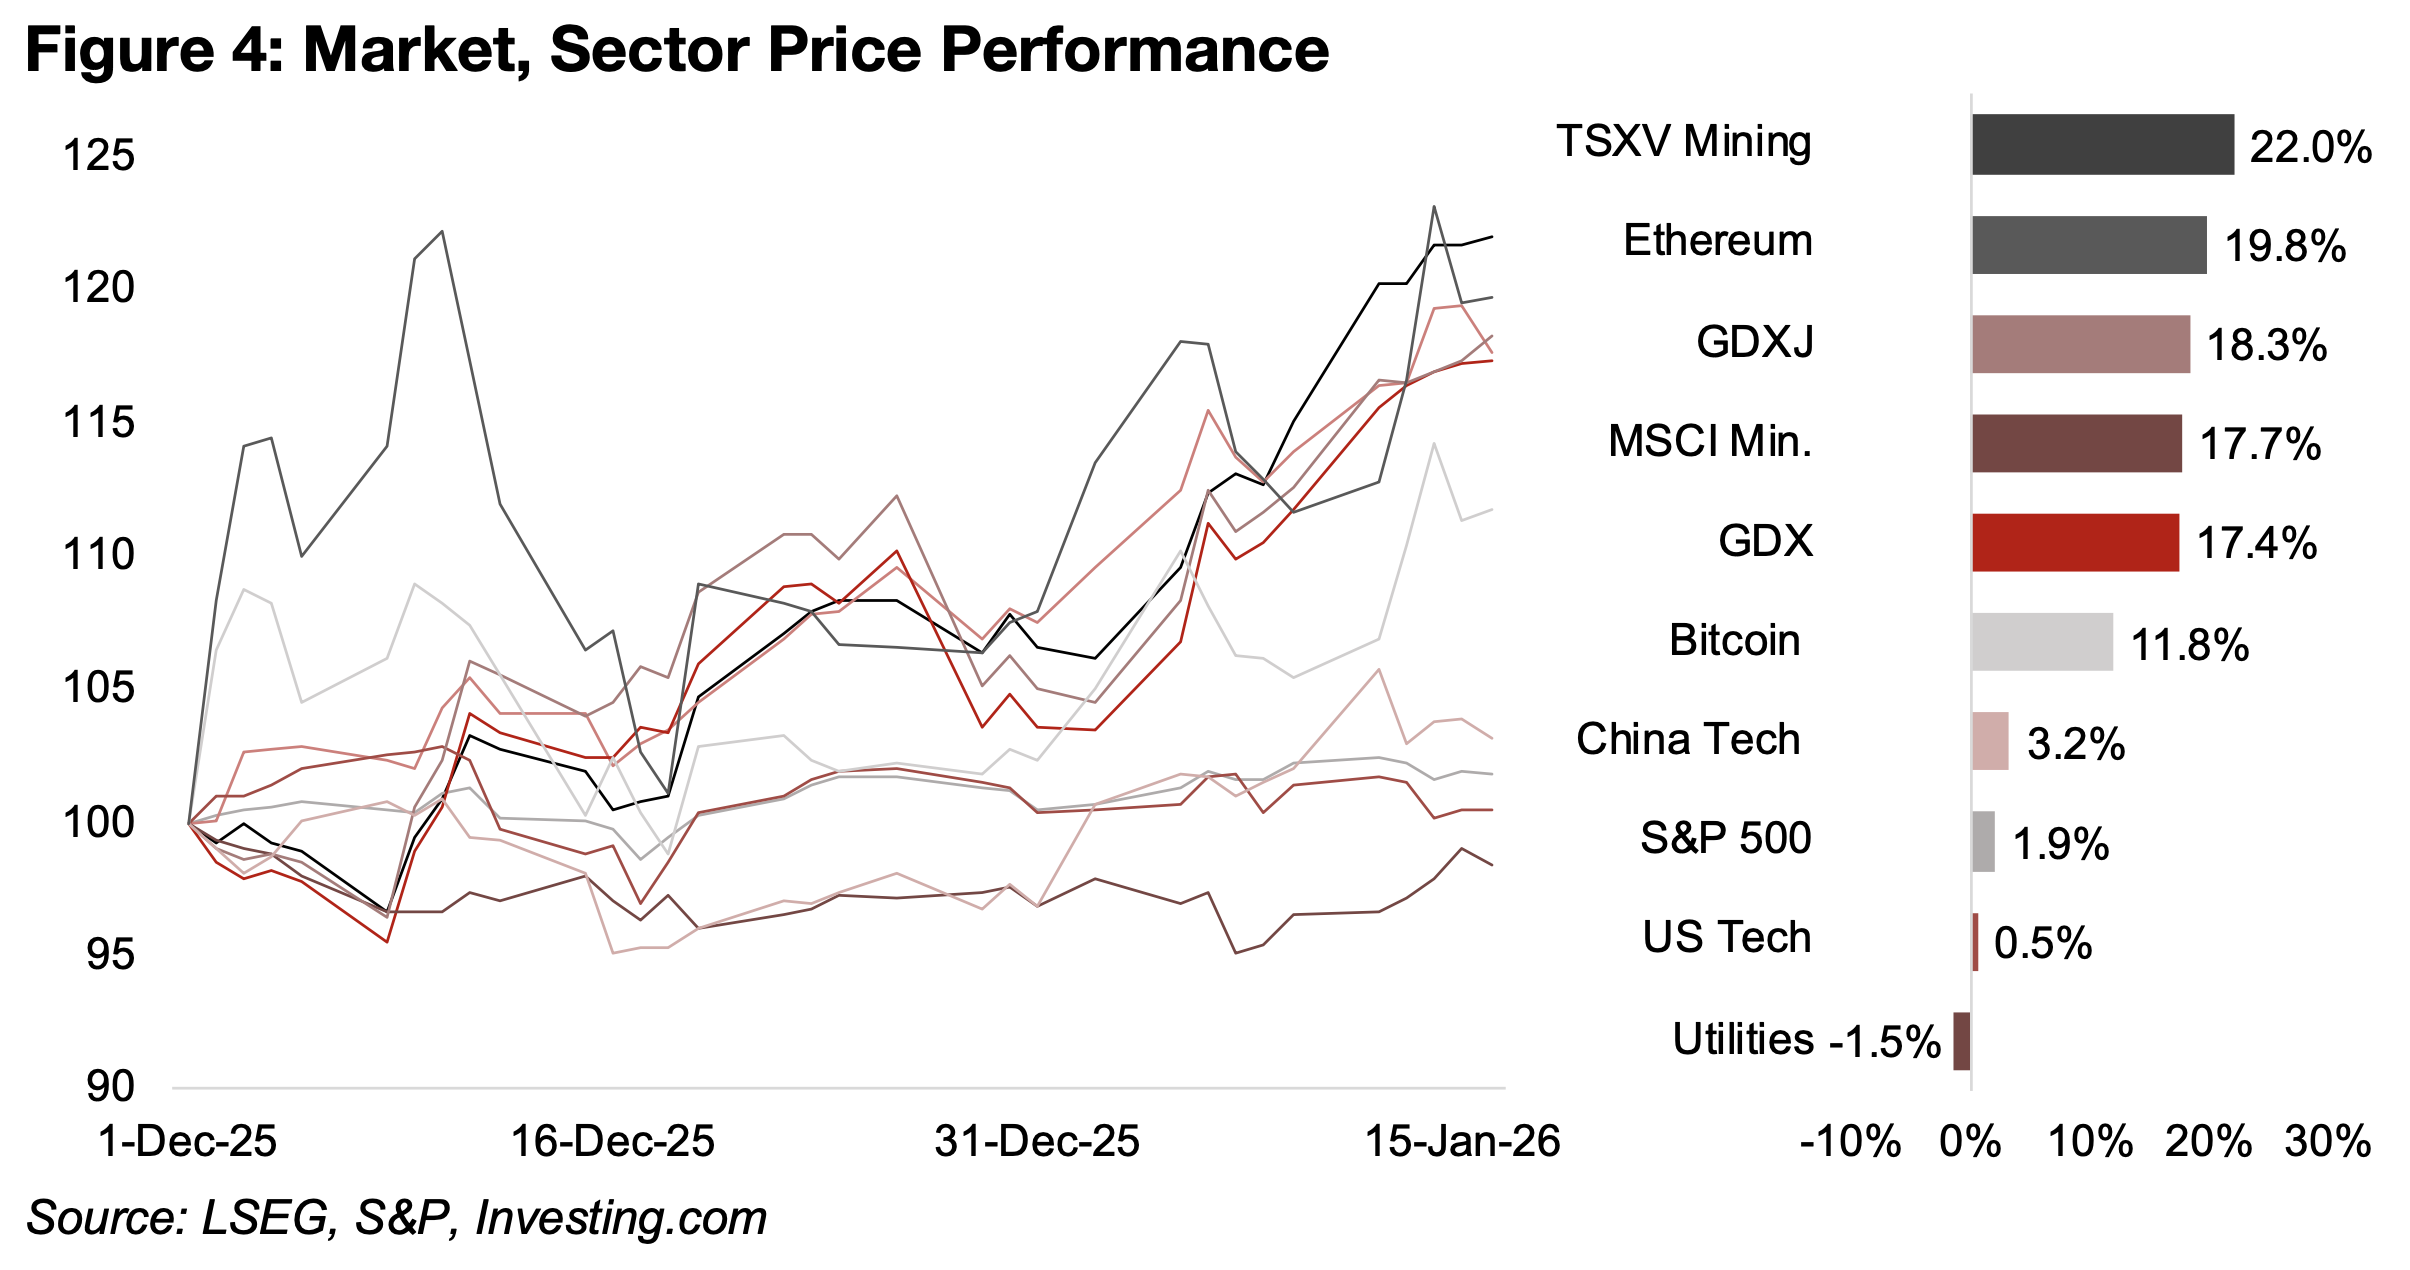
This indicates that while markets are shifting into risk sectors, including crypto, with
Ethereum jumping 19.8% and Bitcoin up 11.8%, this has not included major moves
into big cap tech, with the sector in the US gaining just 0.5% since December 2025,
and 3.2% in China (Figure 4). The mining sector continues to dramatically outperform,
and while this has partly been from markets hedging risk, especially in the gold sector,
other major defensives have underperformed, with utilities down -1.5%.
There is likely a rising speculative component in the mining sector gains, especially
the parabolic rise in silver. TSXV Mining has been one of the strongest performers
since December 2025, up 22.0%, and is comprised of higher risk firms, while the
GDXJ of juniors, up 18.3% has outperformed the 17.4% gain in the GDX, also
implying a shift towards riskier stocks in the sector. The MSCI Metals and Mining
index has also been strong, given a large weighting to iron ore and copper producers,
with the prices of these two metals rising considerably over the past two months.
A weakening of the global fiscal situation has likely been a key driver for gold over the
past few years, and International Monetary Fund (IMF) forecasts indicate a further
decline in government finances over the next two years. This has included continued
high deficits, with expenditure considerably above taxes, which drives an increase in
government borrowing and typically causes a rise in the money supply. This indicates
an eventual rise in inflation and tends to support the gold price as a hedge against
rising prices. Gold can also be protection against a default by some governments if
their debts get so high that they can no longer be serviced. However, this risk is lower
overall, as governments tend to monetize the debt, printing money to cover the
obligations, rather than outright default, which can eventually lead to hyperinflation.
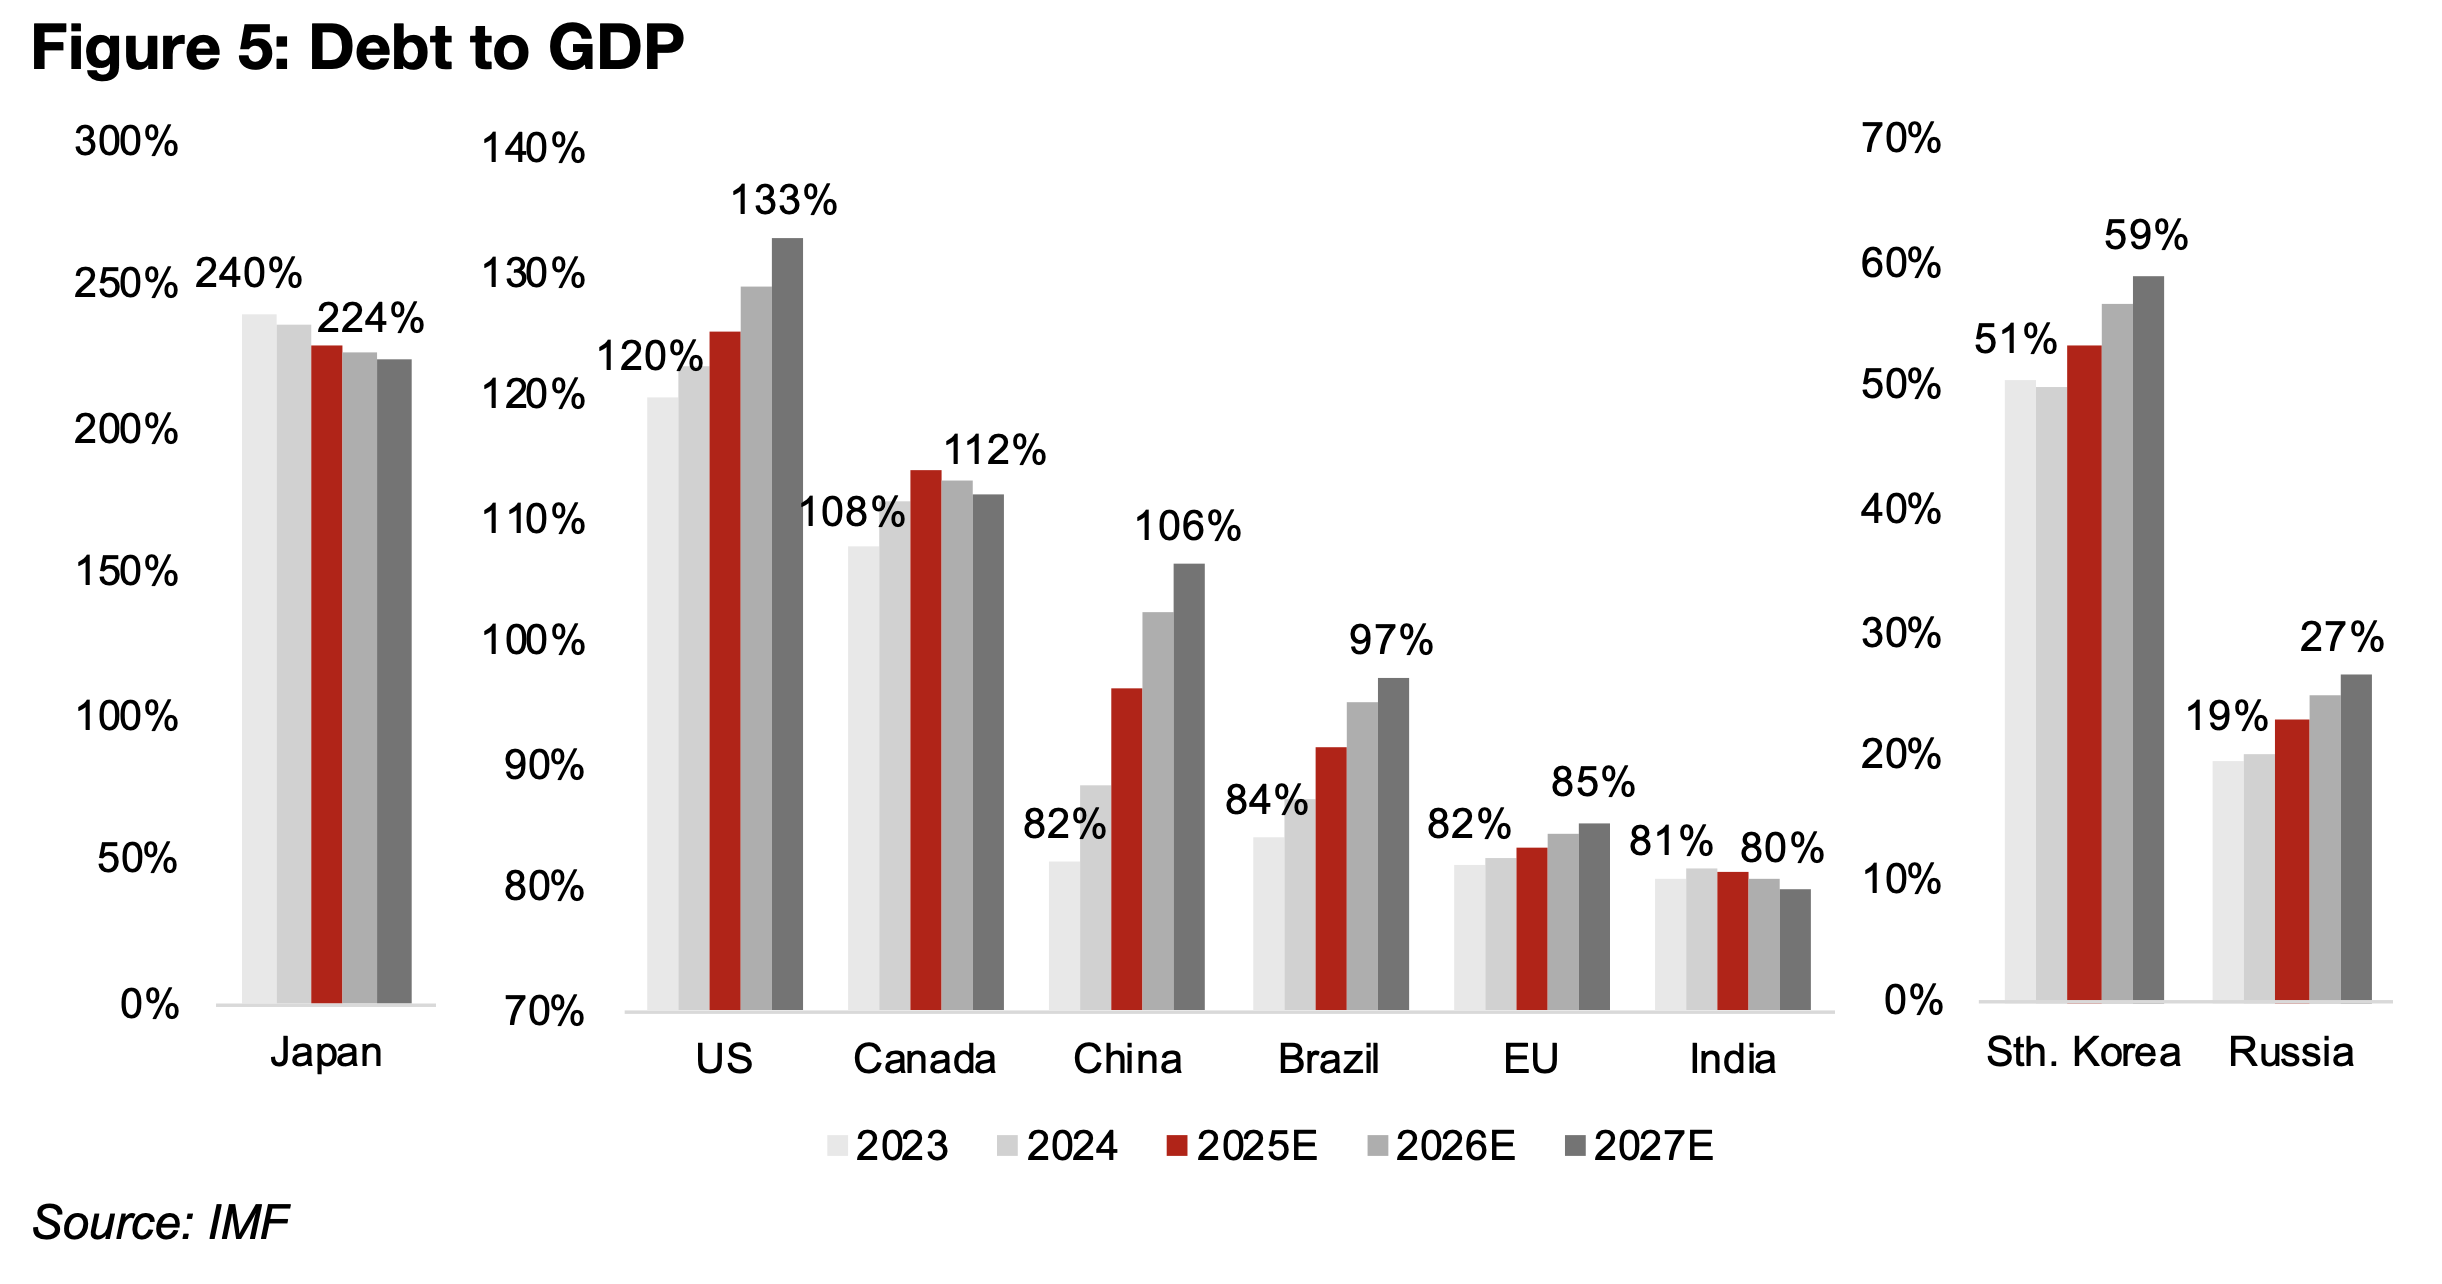
Global debt to GDP has risen for most of the major global economies from 2023 to
2025 and is expected to increase further from 2026E to 2027E. In the US, the level
was already high 2023 at 120% of GDP and by 2027E is expected to reach 133%,
with only Japan higher among the major developed nations, at 240% in 2023,
although this is expected to decline to 224% by 2027E (Figure 5). China has seen a
major shift in debt to GDP from just 82% in 2023 to around 100% currently, with 106%
expected by 2027E. The European Union has maintained a debt/GDP well below 100%
in recent years, but it is expected to rise gradually from 82% in 2023 to 85% in 2027E.
Brazil, South Korea and Russia are expected to have substantial increases in debt/
GDP from 2023 to 2027E, although for the last two, this is off far lower bases than for
the largest economies. Canada’s debt/GDP is expected to peak in 2025 and then
decline but will be over 100% from 2023-2027E. India is expected to have a limited
change in its debt/GDP ratio, which will be between 80%-81% from 2023 to 2027E.
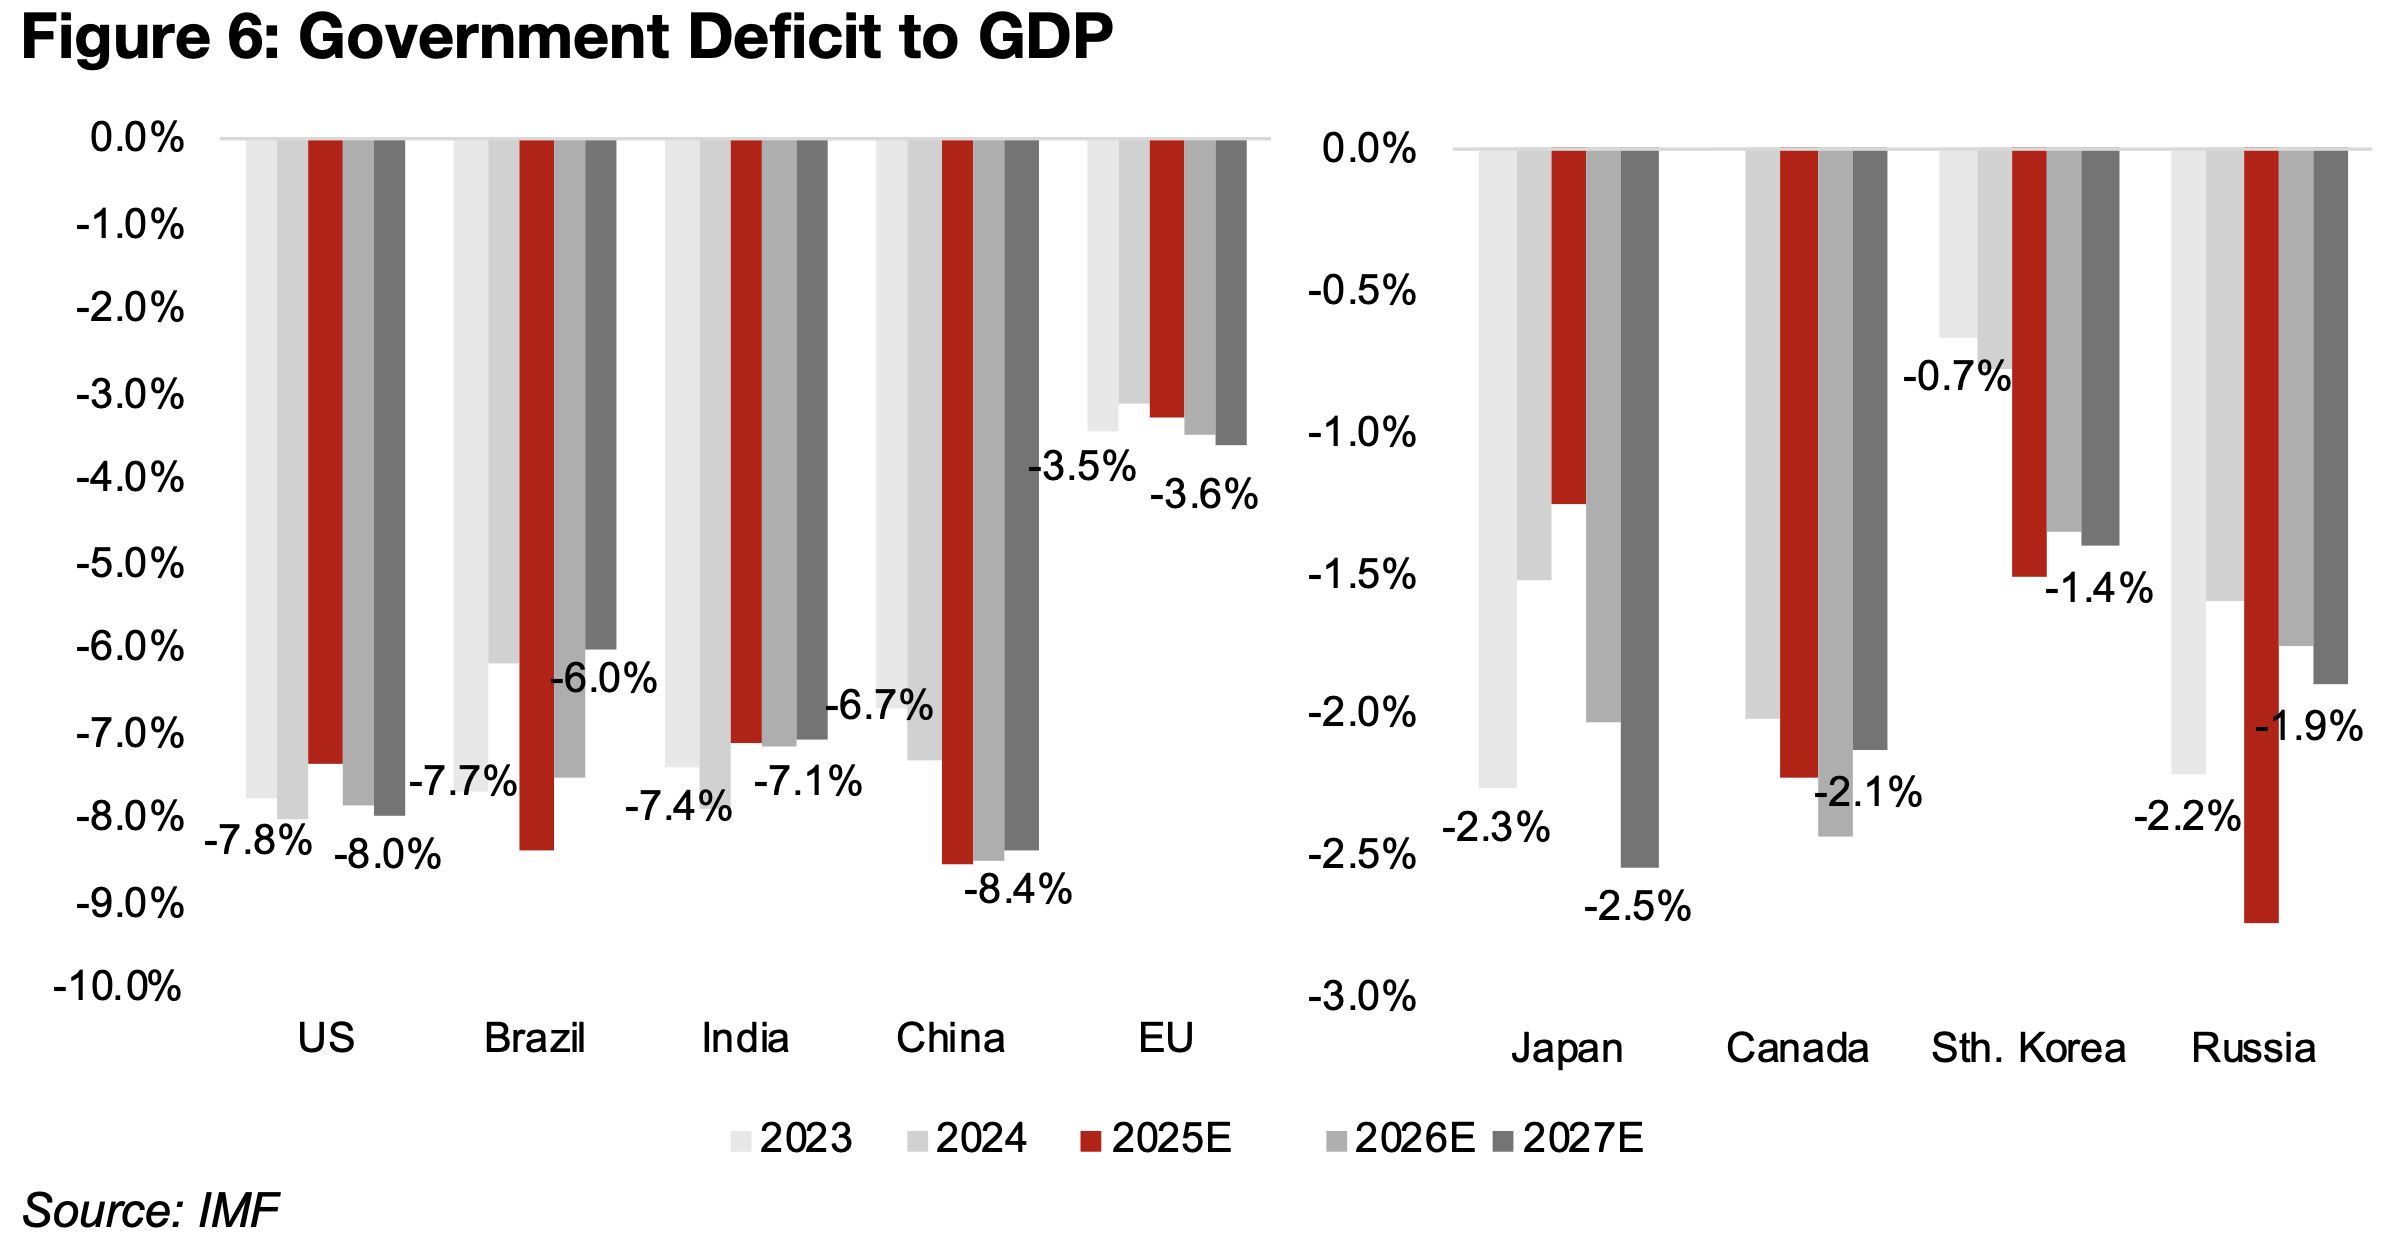
This rise in borrowing will be driven by continued deficits by all the major governments
over the next two years. For the US deficits to GDP have been extremely high in
recent years, at nearly 8.0%, and are expected to remain around this level for 2026E-
2027E (Figure 6). China’s deficit/GDP has also been high, at around 7.0% from 2023
and 2025, and is forecast to jump to well over 8.0% from 2025E to 2027E, the highest
of the major economies. Brazil and India have had high deficits, but they are expected
to improve, to 6.0% and around 7.0% by 2027E, respectively, off lows in 2025E and
2024. The EU has by far lowest deficit/GDP of the major economies, which has risen
from 3.5% in 2023 through to 2025E, but is expected to decline to 3.6% by 2027E.
The deficit/GDP of other major economies are much smaller, with none above 3.0%.
In Japan the deficit/GDP is expected to decline over the next two years to 2.5%, after
reaching less than 1.5% for 2025E, while Canada actually had a slight surplus in 2023,
and its deficit is expected to trough at 2.4% in 2026E, before rising to 2.1% for 2027E.
South Korea has the lowest deficit/GDP of the major economies, although it also
expected to deteriorate from 0.7%-0.8% from 2023-2024 to 1.4%-1.5% from 2025E-
2027E. Russia’s deficit/GDP is estimated to have hit a low of -2.7% in 2025E, but it
is expected to rise to 1.9% by 2027E.
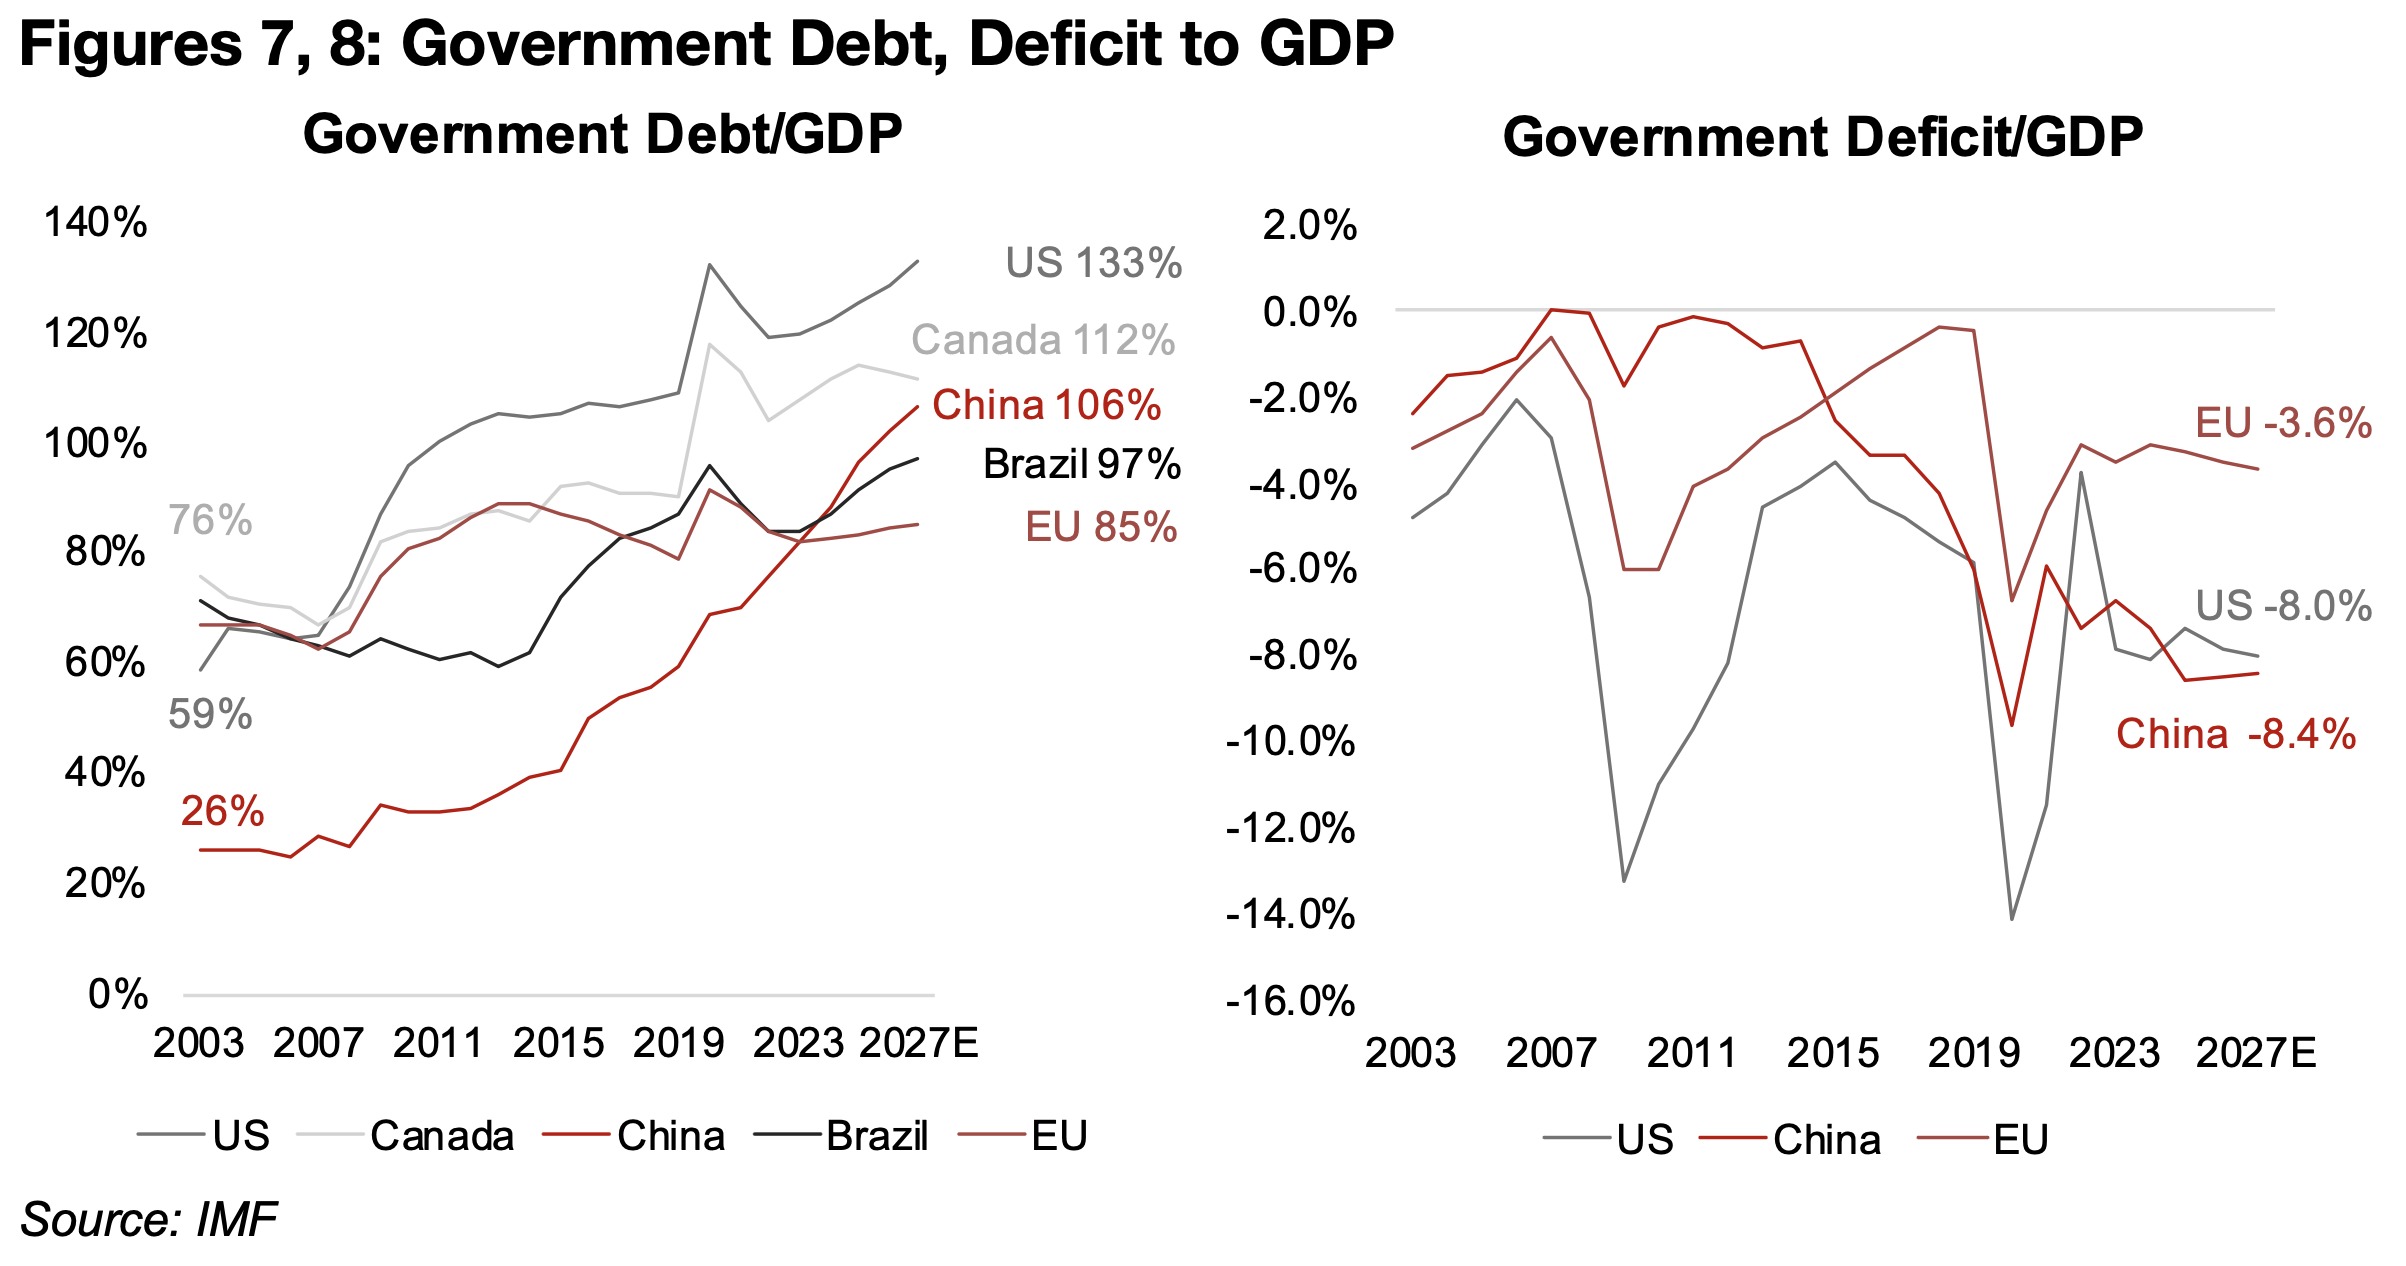
The longer-term government debt and deficit to GDP ratios show that this
deteriorating global fiscal situation has not only been because of distortions following
the global health crisis, but has been a trend for over twenty years. The debt/GDP for
the US, EU, Canada, China and Brazil were all well below 80% in 2003, and the big
increases for the three former occurred after the global financial crisis (Figure 7). Only
Europe has seen the debt/GDP ratio relatively flat since, with forecasts for around 85%
from 2025E-2027E, while the ratio for the other four has continued to rise, with the
US, Canada and China now above 100%, and Brazil almost at this level.
The deficit to GDP trends look quite volatile over the past twenty years, especially
because of the extreme deficits during the financial crisis and the global health crisis
(Figure 8). However, there is a downtrend overall for the US and China, with the latter
having a near zero deficit/GDP for most of the decade from the mid-2000s to mid-
2010s. The deficit/GDP for European Union has been much lower, only getting
significantly below 4.0% during the two major crises, with only a moderate overall
downtrend for the past two decades.
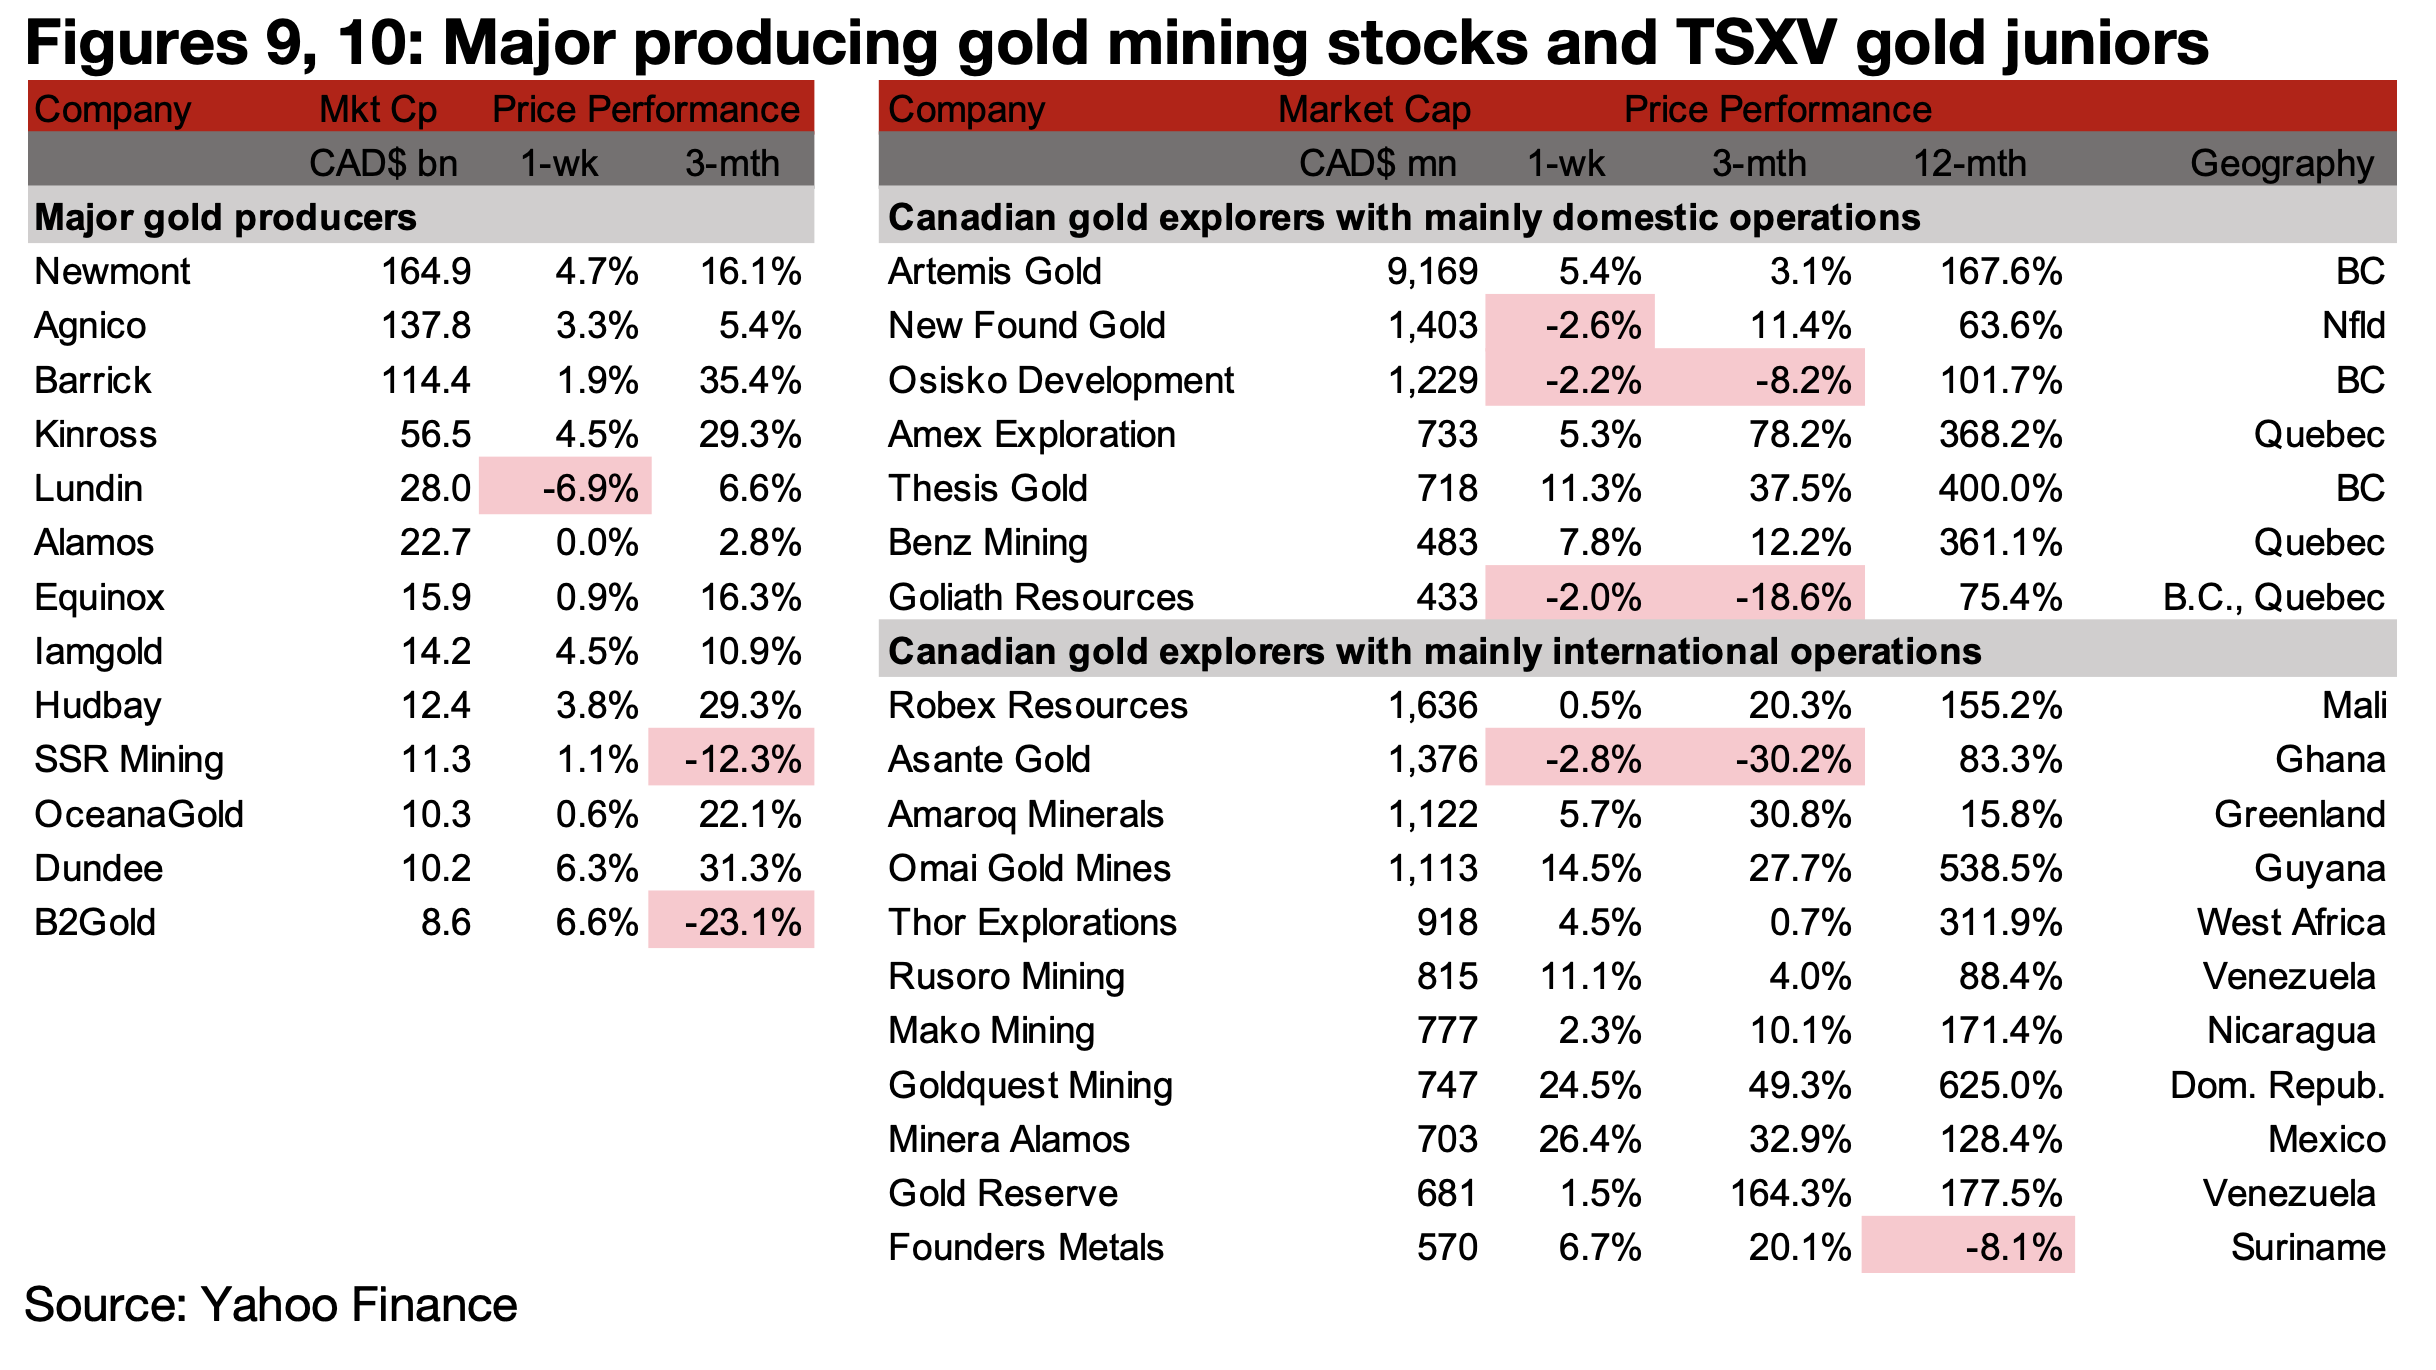
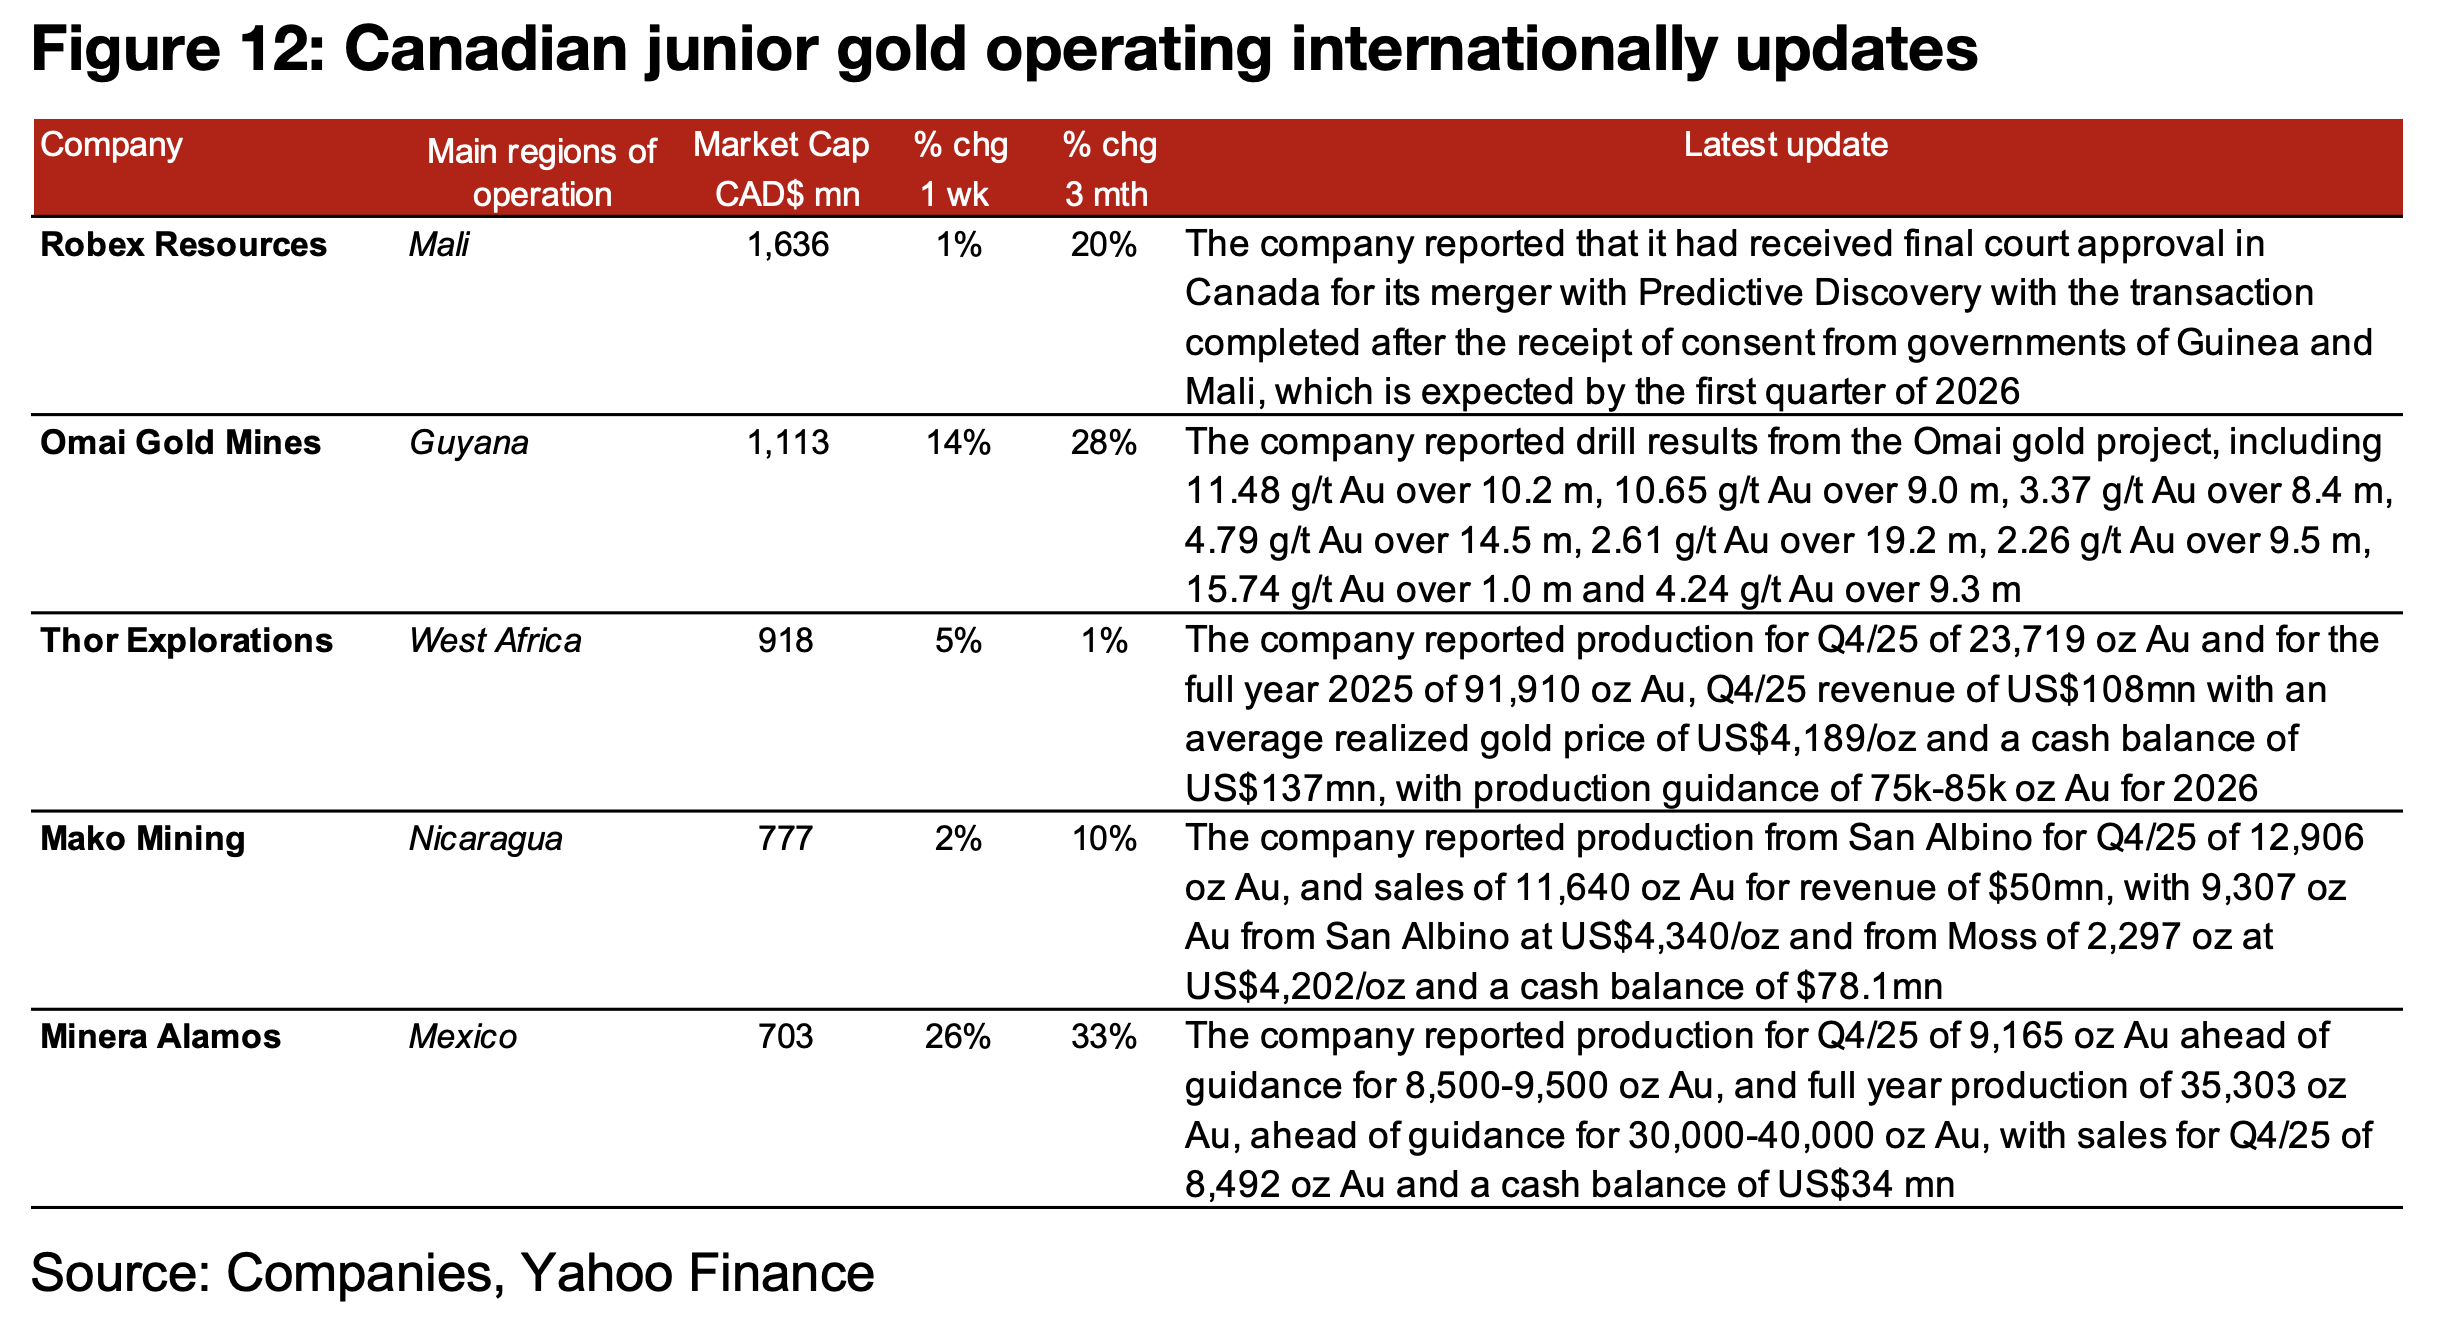
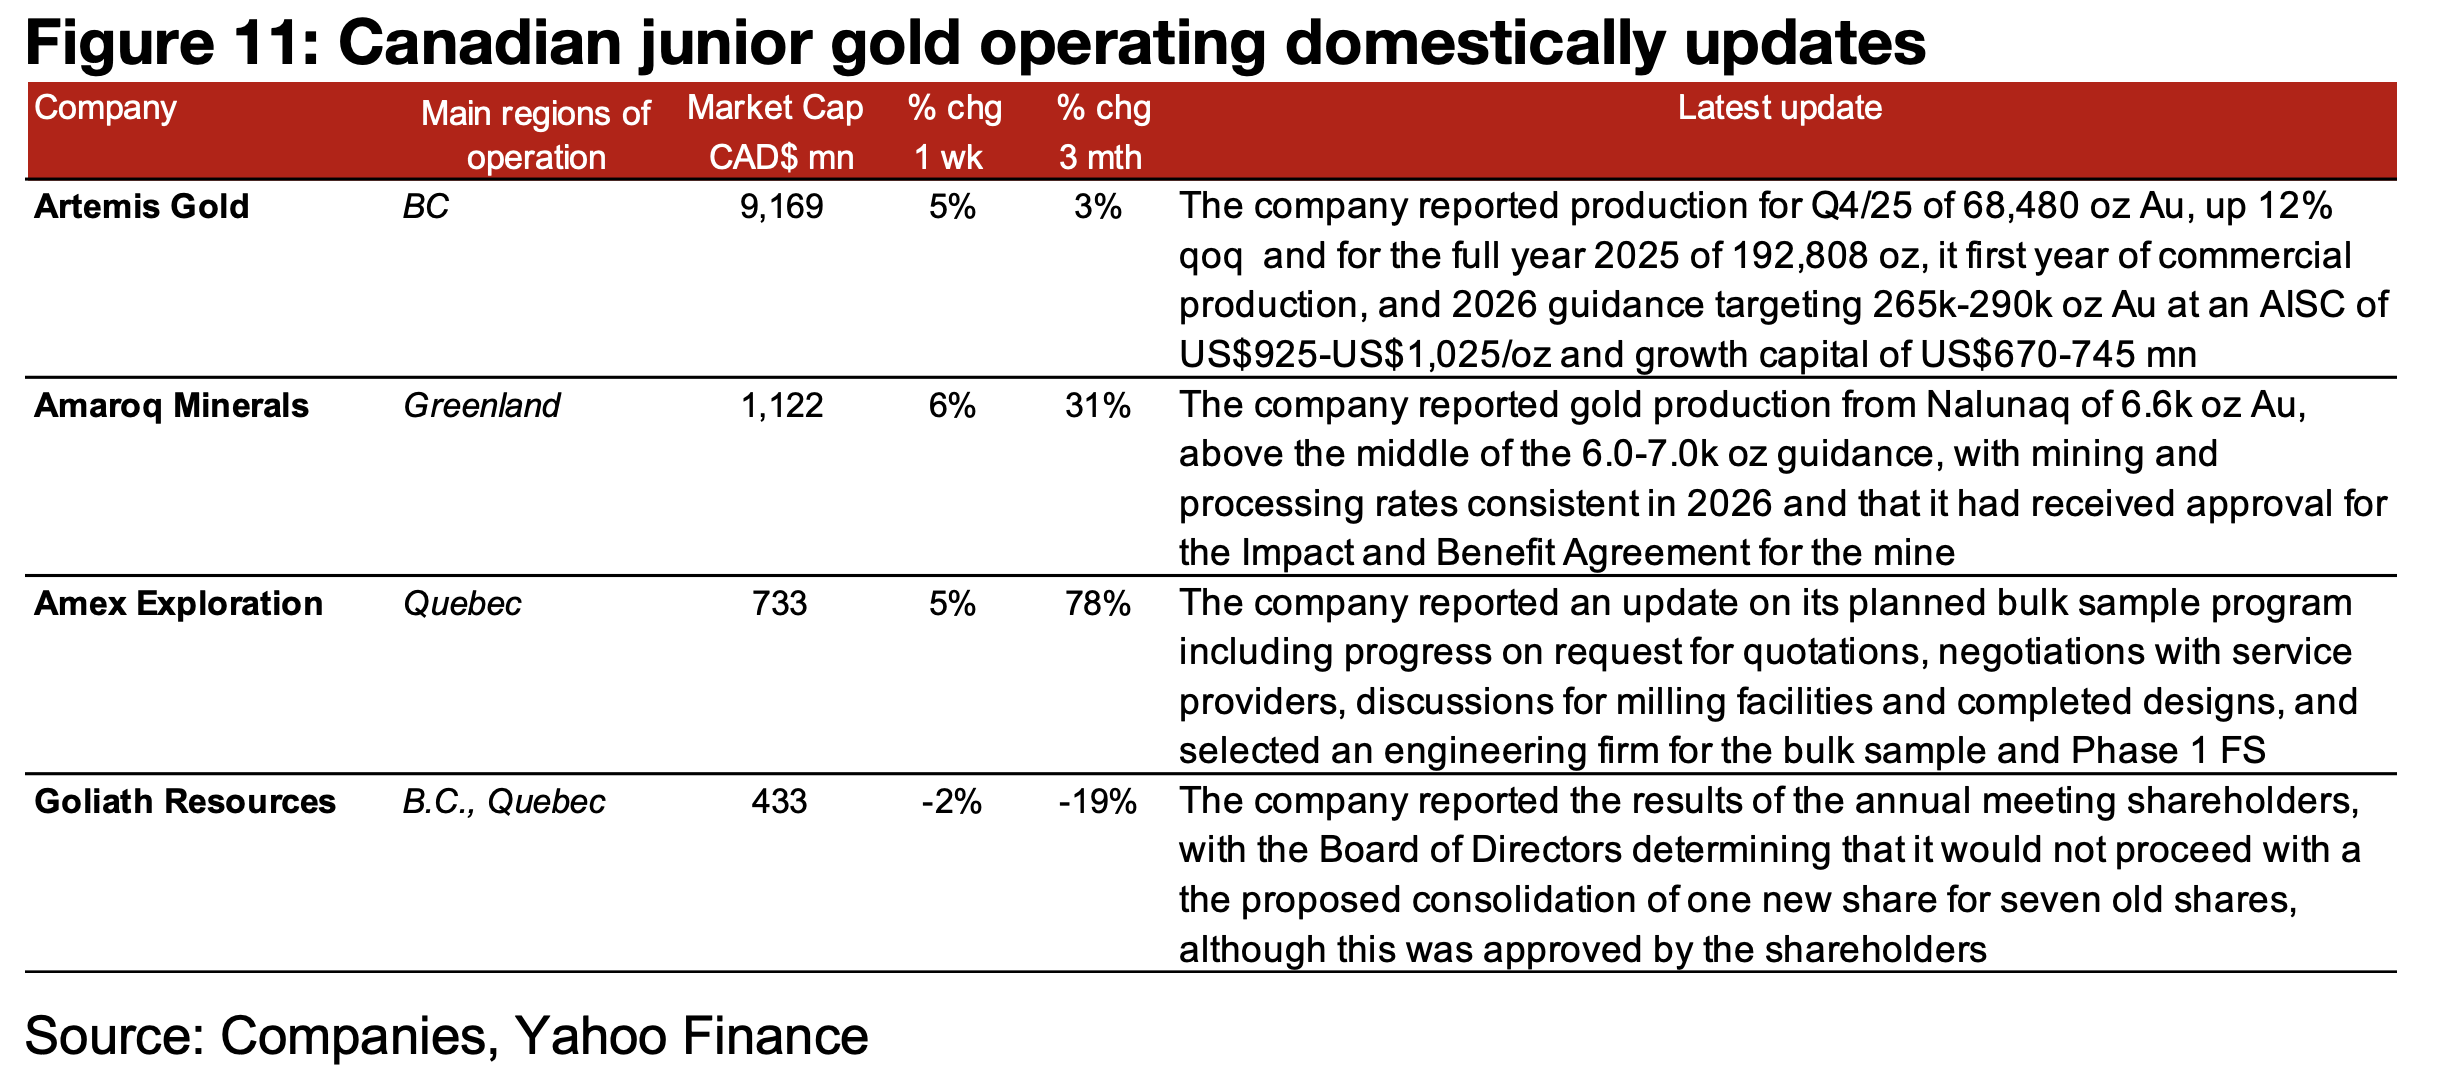
The major producers all rose expect for Lundin, and most of the large TSXV gold stocks increased on the gain in the metal (Figures 9, 10). For the TSXV gold companies operating mainly domestically, Artemis and Amaroq reported Q4/25 production, Amex reported an update on its planned bulk sampling program and Goliath reported results from its annual shareholders meeting including the decision not to consolidate to consolidate its shares (Figure 11). For the TSXV gold companies operating mainly internationally, Robex received approval for its merger with Predictive Discovery from the court in Canada, Omai reported drill results from the Omai project, and Thor, Mako and Minera Alamos reported Q4/25 production (Figure 12).
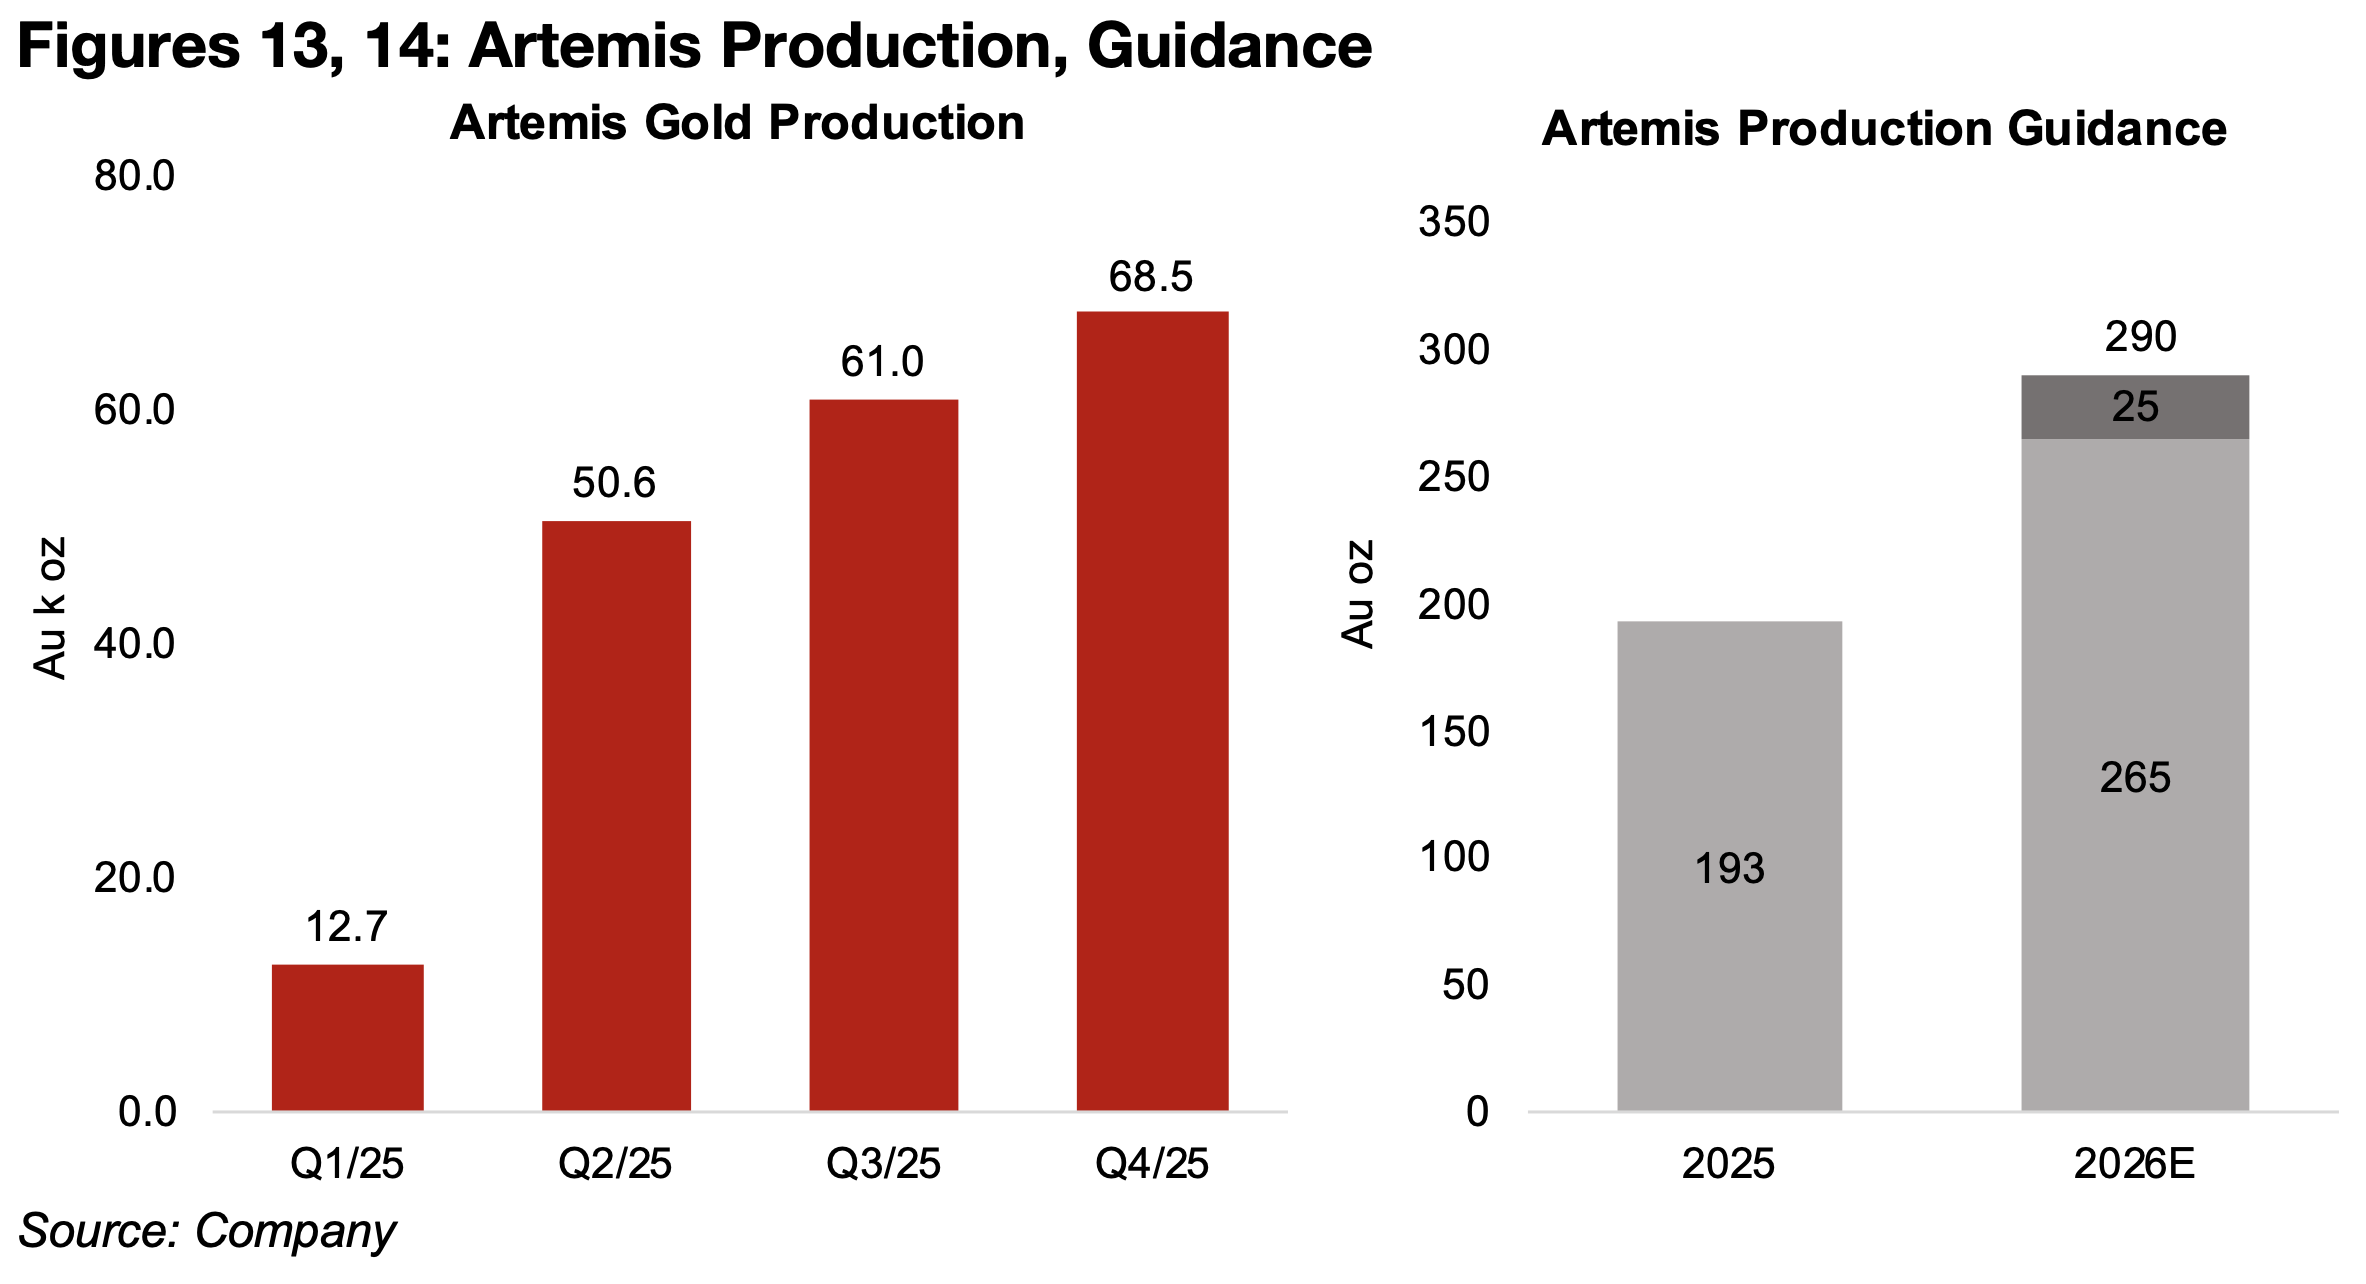
Artemis Gold, by far the largest market cap stock in the TSXV Mining sector, reported a continued ramp up in production in Q4/25, after commercial production started in May 2025. The output was 68.5 k oz Au, up from 61.0 k oz Au in Q3/25, up from just 12.7 k oz Au in Q1/25 during the pre-commercial production period. The company also issued guidance for 265k-290k oz Au for 2026E, up 50.3% yoy from production of 193k oz Au in 2025 (Figures 13, 14). The company expects an AISC of US$925/oz- US$1,025/oz for 2026E and estimates an investment of US$670mn-US$745mn for the year, comprising US$95mn-US$100mn for the Phase 1A expansion, US$385- US$534mn for the Phase 2 expansion, and US$190mn-US$210mn for other expansion capital.
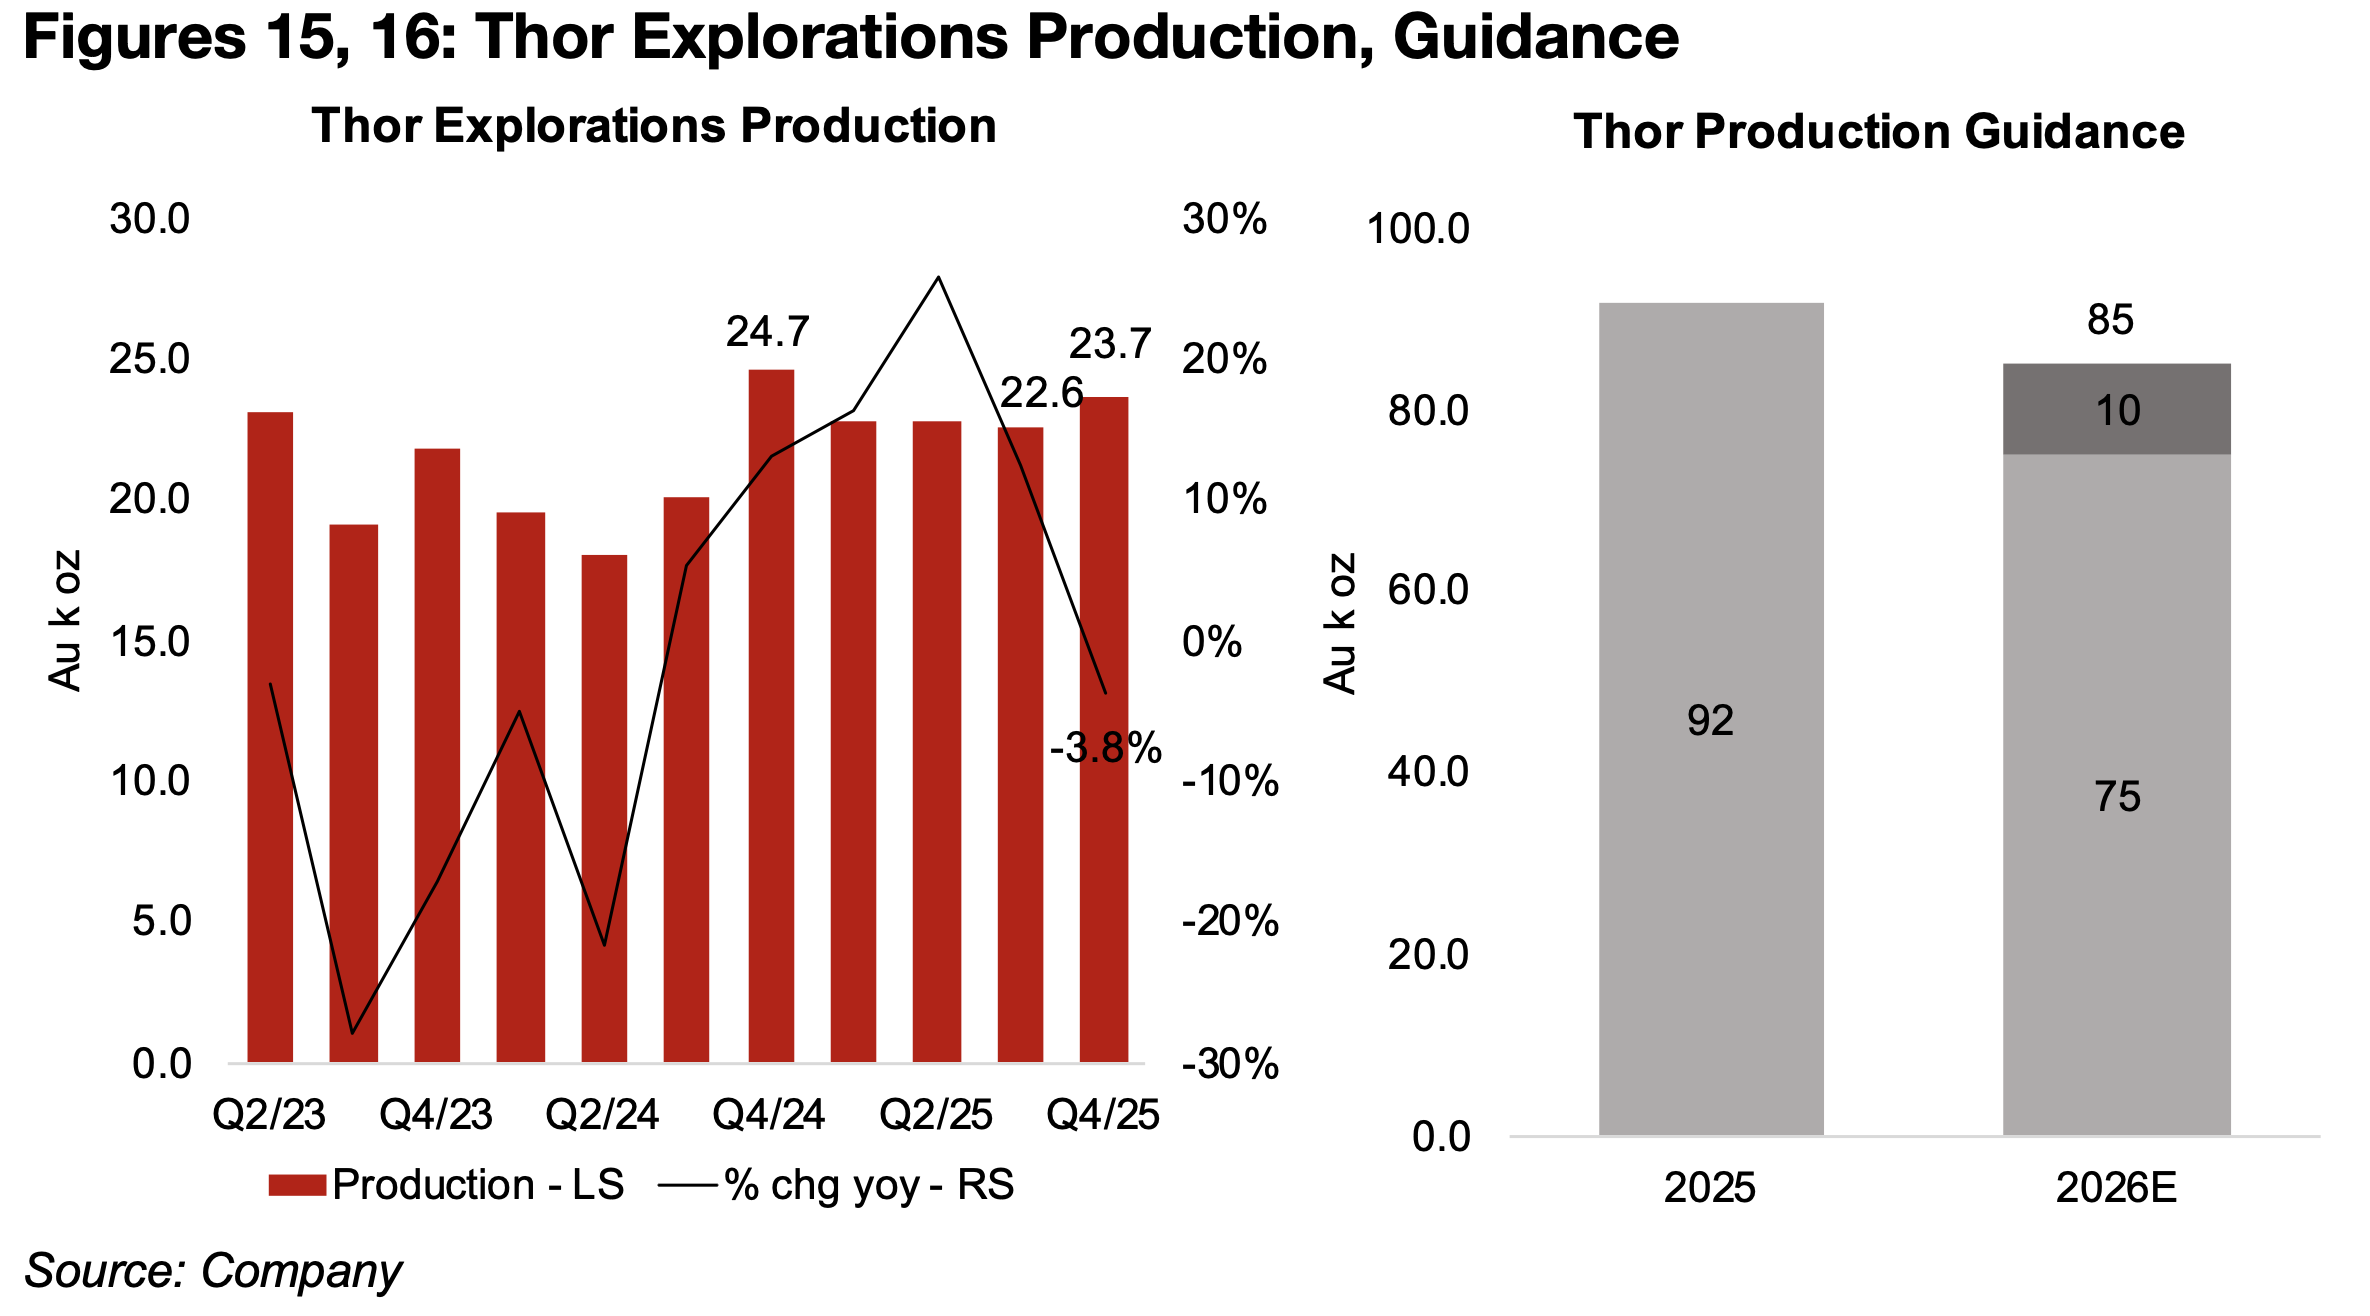
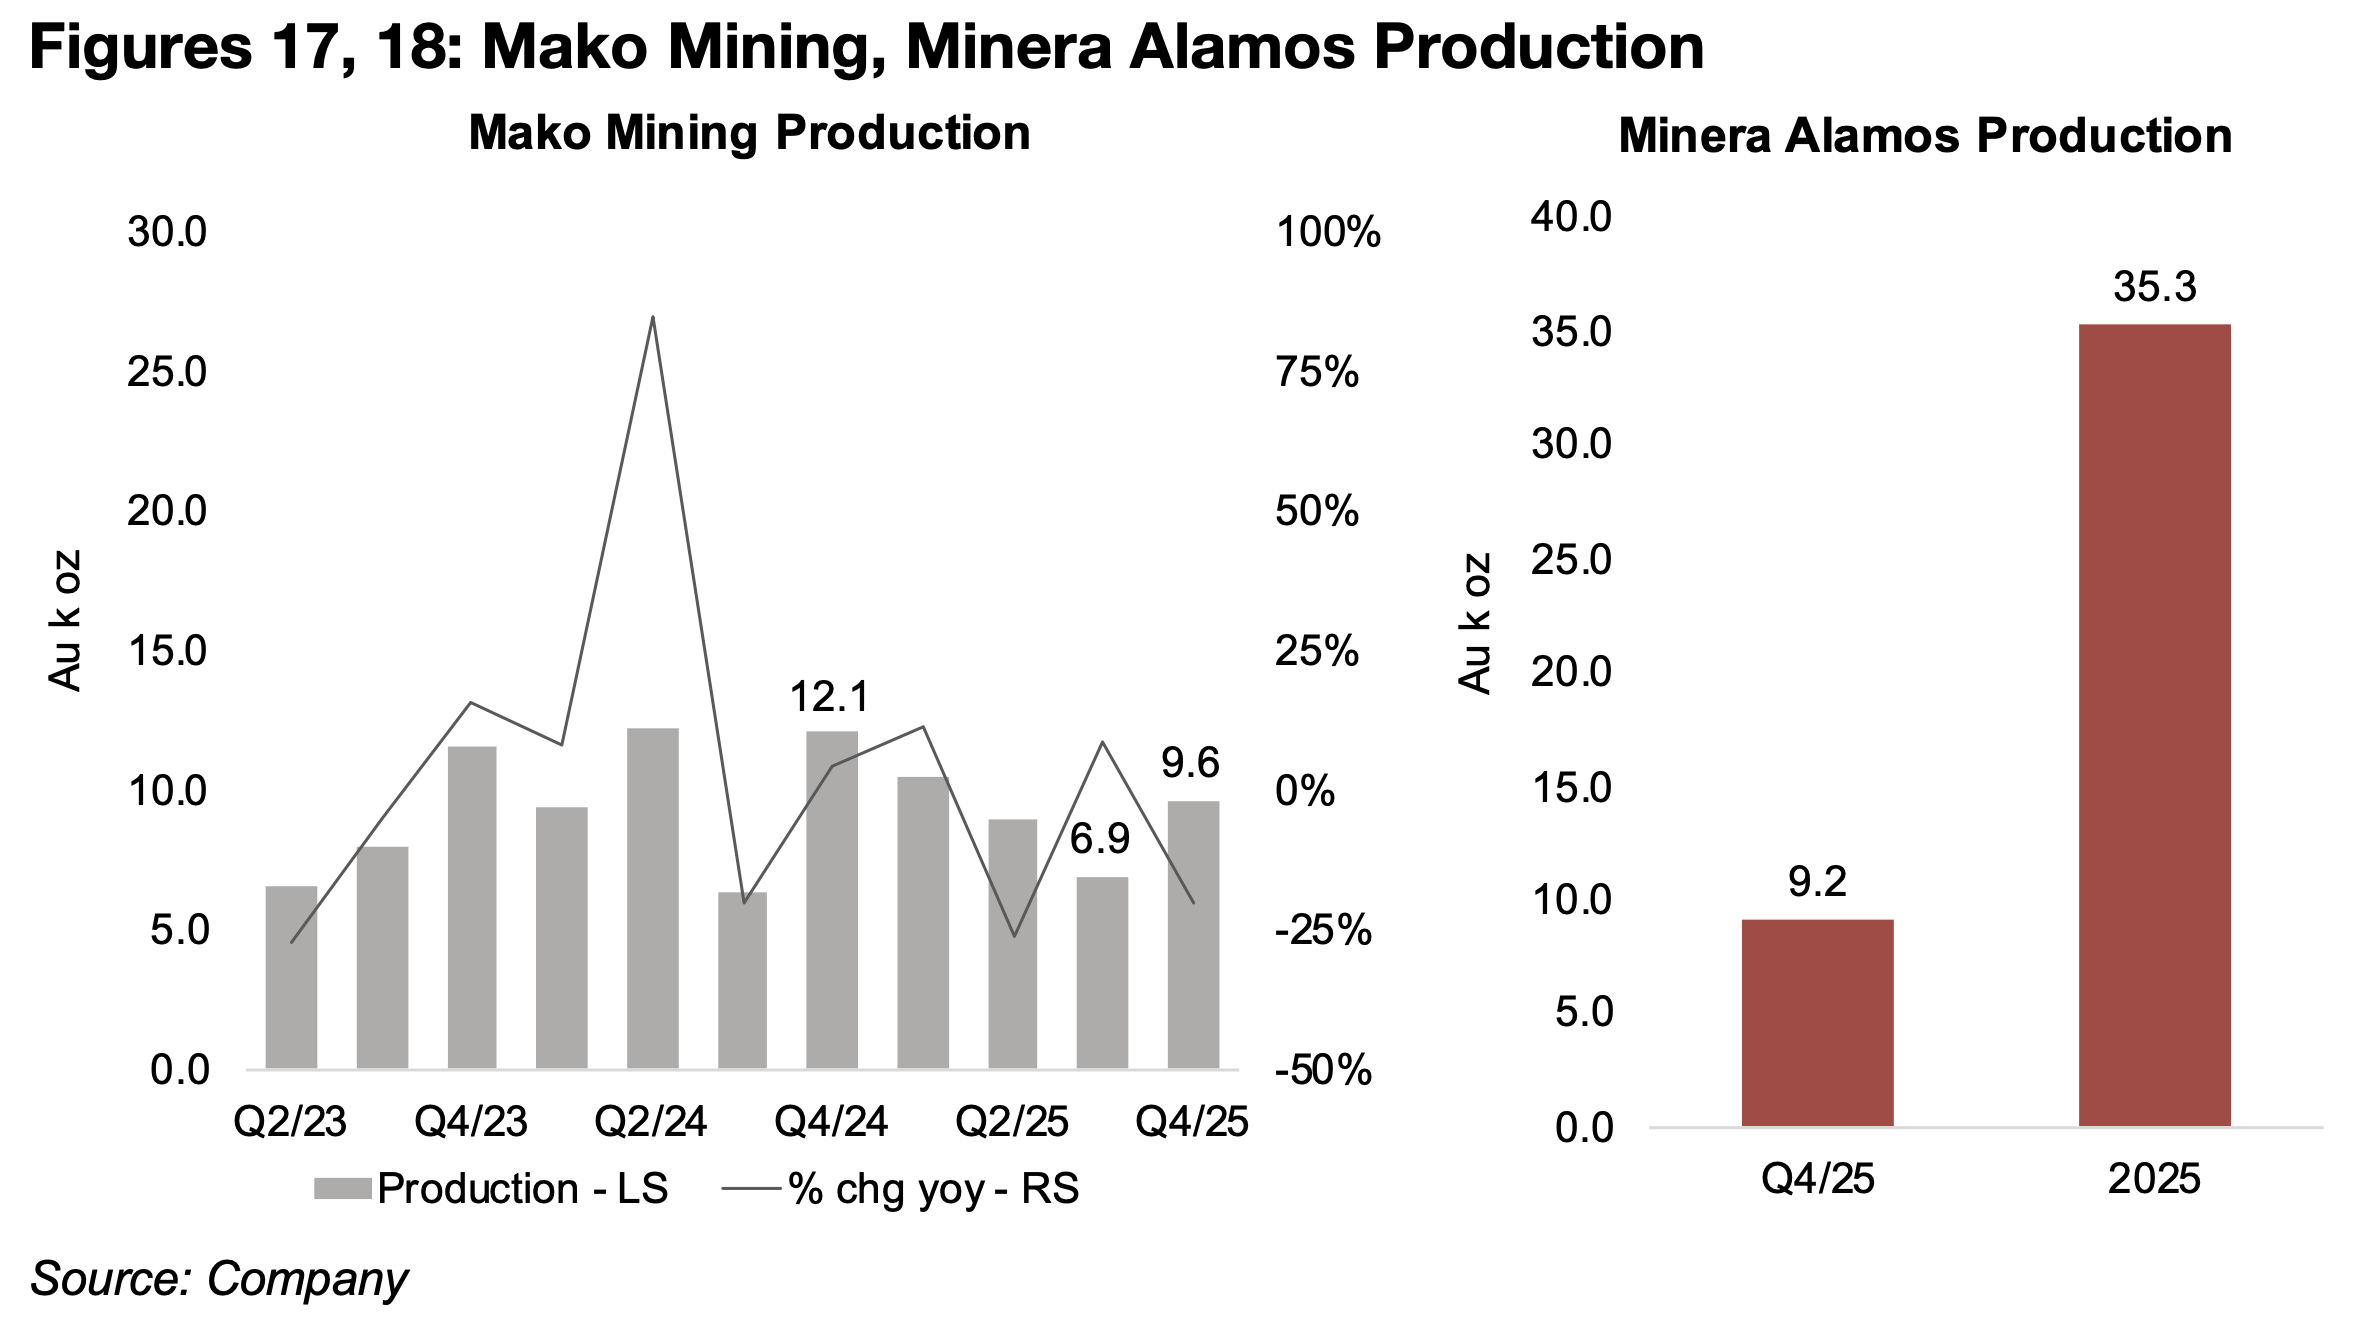
Thor Exploration’s production from the Segilola mine declined -3.8% yoy to 23.7k oz, although it increased 4.9% qoq, and there is expected to be a decline in 2026E, with guidance of 75k-85k oz Au, down -7.6% at the high end of the estimate (Figures 15, 16). The Segilola mine is planned to produce until 2027, with the company expecting to complete a Feasibility Study for Douta, its second major project, by January 2026, with output to shift to this mine over the next two years. Mako Mining reported production of 9.6k oz Au, down -21% yoy, but up 39.1% qoq, with the Q4/24 output one of the company’s highest ever (Figure 17). Minera Alamos reported Q4/25 production of 9.2k oz and full year output of 35.3k oz Au from the Pan Operating Complex, considerably above consensus of 8.5k-9.5k oz Au and 30k-40k oz Au, respectively (Figure 18).
Disclaimer: This report is for informational use only and should not be used an alternative to the financial and legal advice of a qualified professional in business planning and investment. We do not represent that forecasts in this report will lead to a specific outcome or result, and are not liable in the event of any business action taken in whole or in part as a result of the contents of this report.
Author
Ben McGregor authors the Weekly Roundup at CanadianMiningReport.com, providing sharp analysis of the metals and mining sector. With a talent for spotting trends, Ben distills complex market shifts into clear, engaging insights on TSXV junior miners. His weekly updates cover gold, copper, uranium, and more, blending data-driven perspectives with a knack for identifying opportunities. A vital resource for investors, Ben’s work navigates the dynamic junior mining landscape with precision.