December 08, 2025
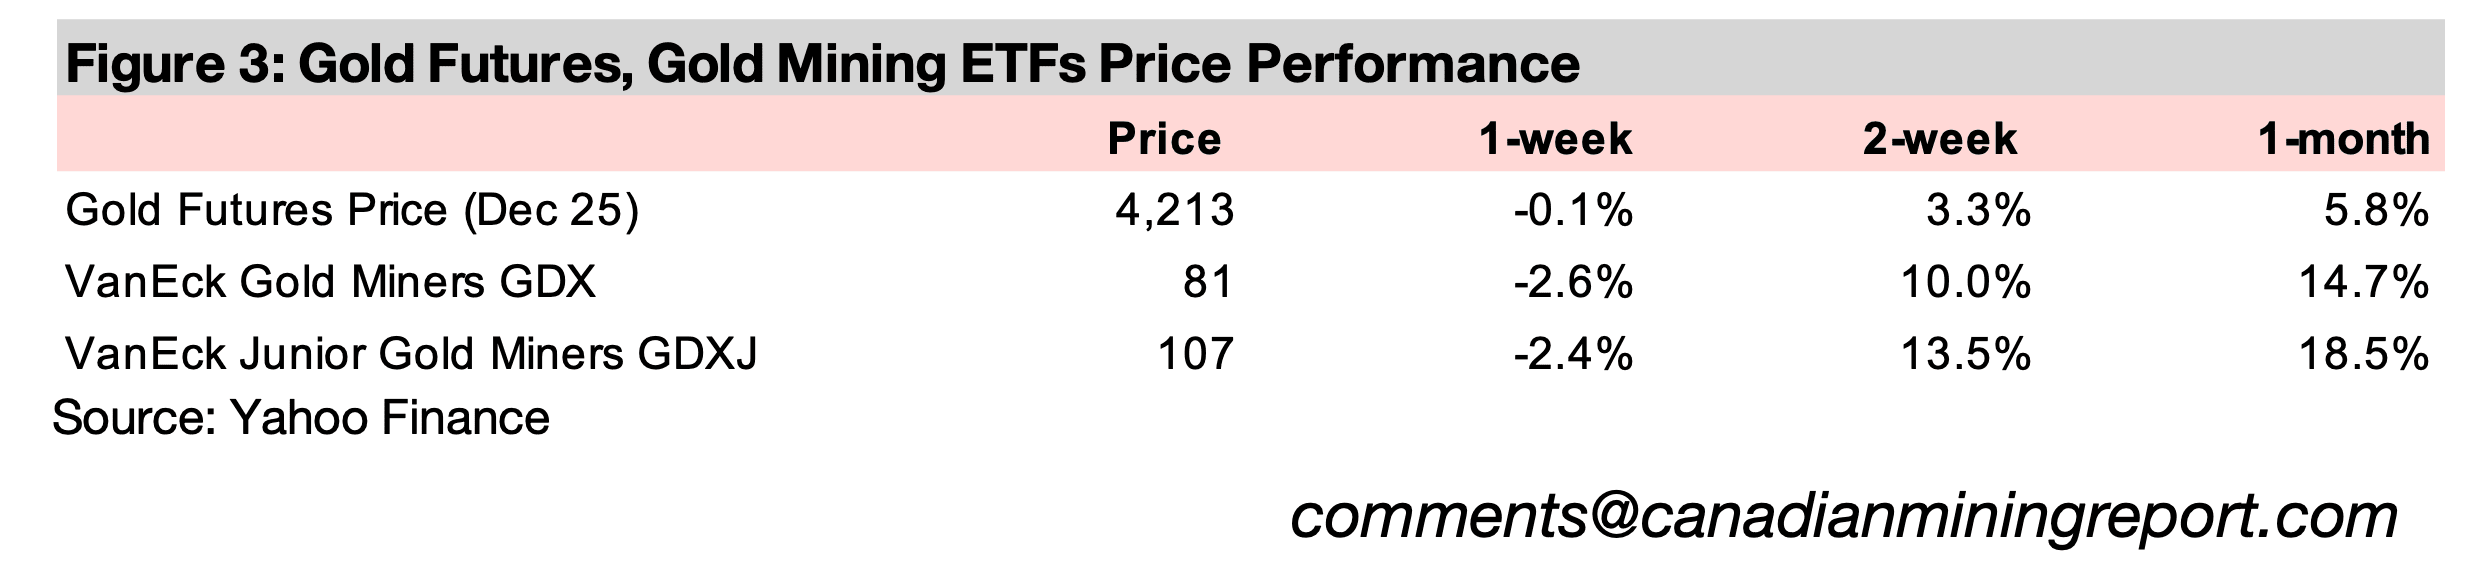
Gold declined -0.6% to US$4,213/oz, down from mid-week highs of US$4,239/oz, even as weak US jobs data provided more justification for a rate cut, although this may have been priced in already by a US$200 rise in the metal over the past month.
A disruption of the typical proportions of silver and copper stocks between regions continues, with inventories of the latter surging in the US on tariffs and for the former shifting to the UK to offset shortfalls, with holdings of both metals in China depleted.
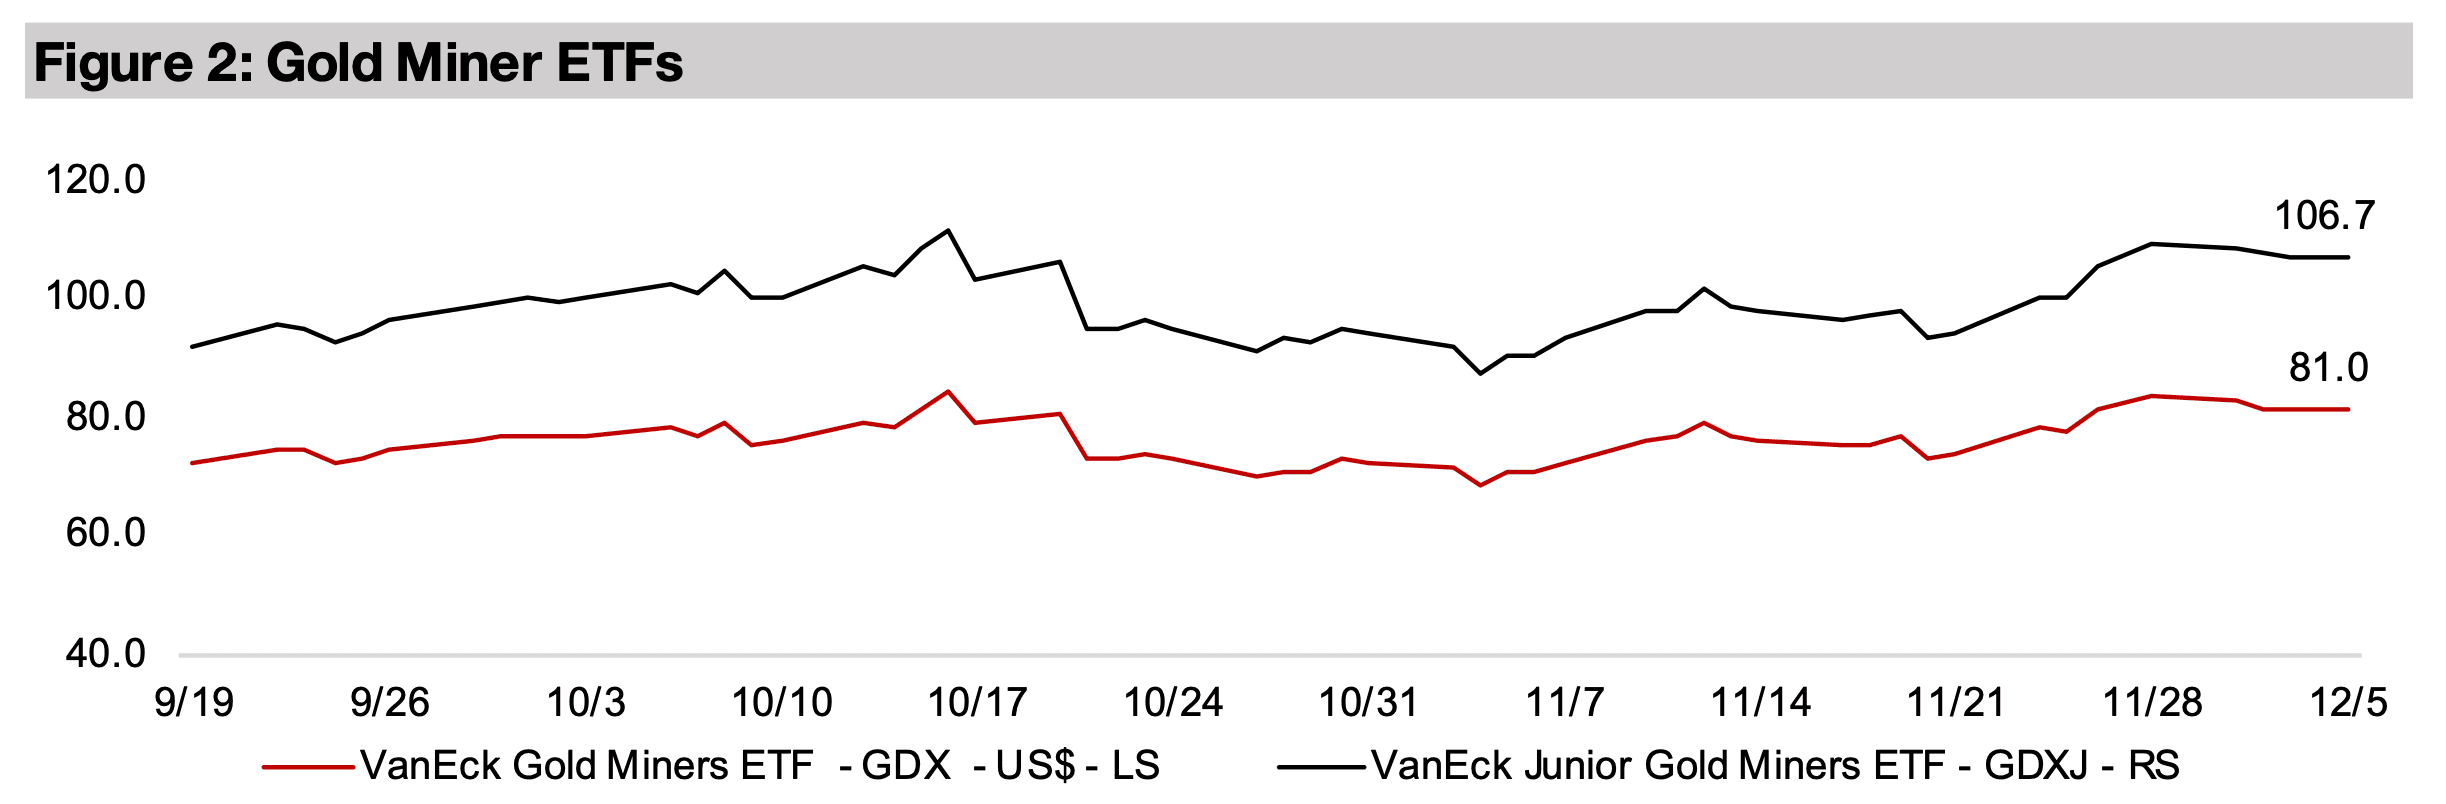
The gold stocks declined with the GDX down -2.6% and GDXJ off 2.4% on a risk-on shift in markets, with S&P 500 up 0.9% and Nasdaq gaining 1.8% as global tech rose, while the defensive utilities and consumer staples sectors slumped -3.5% and -3.7%.


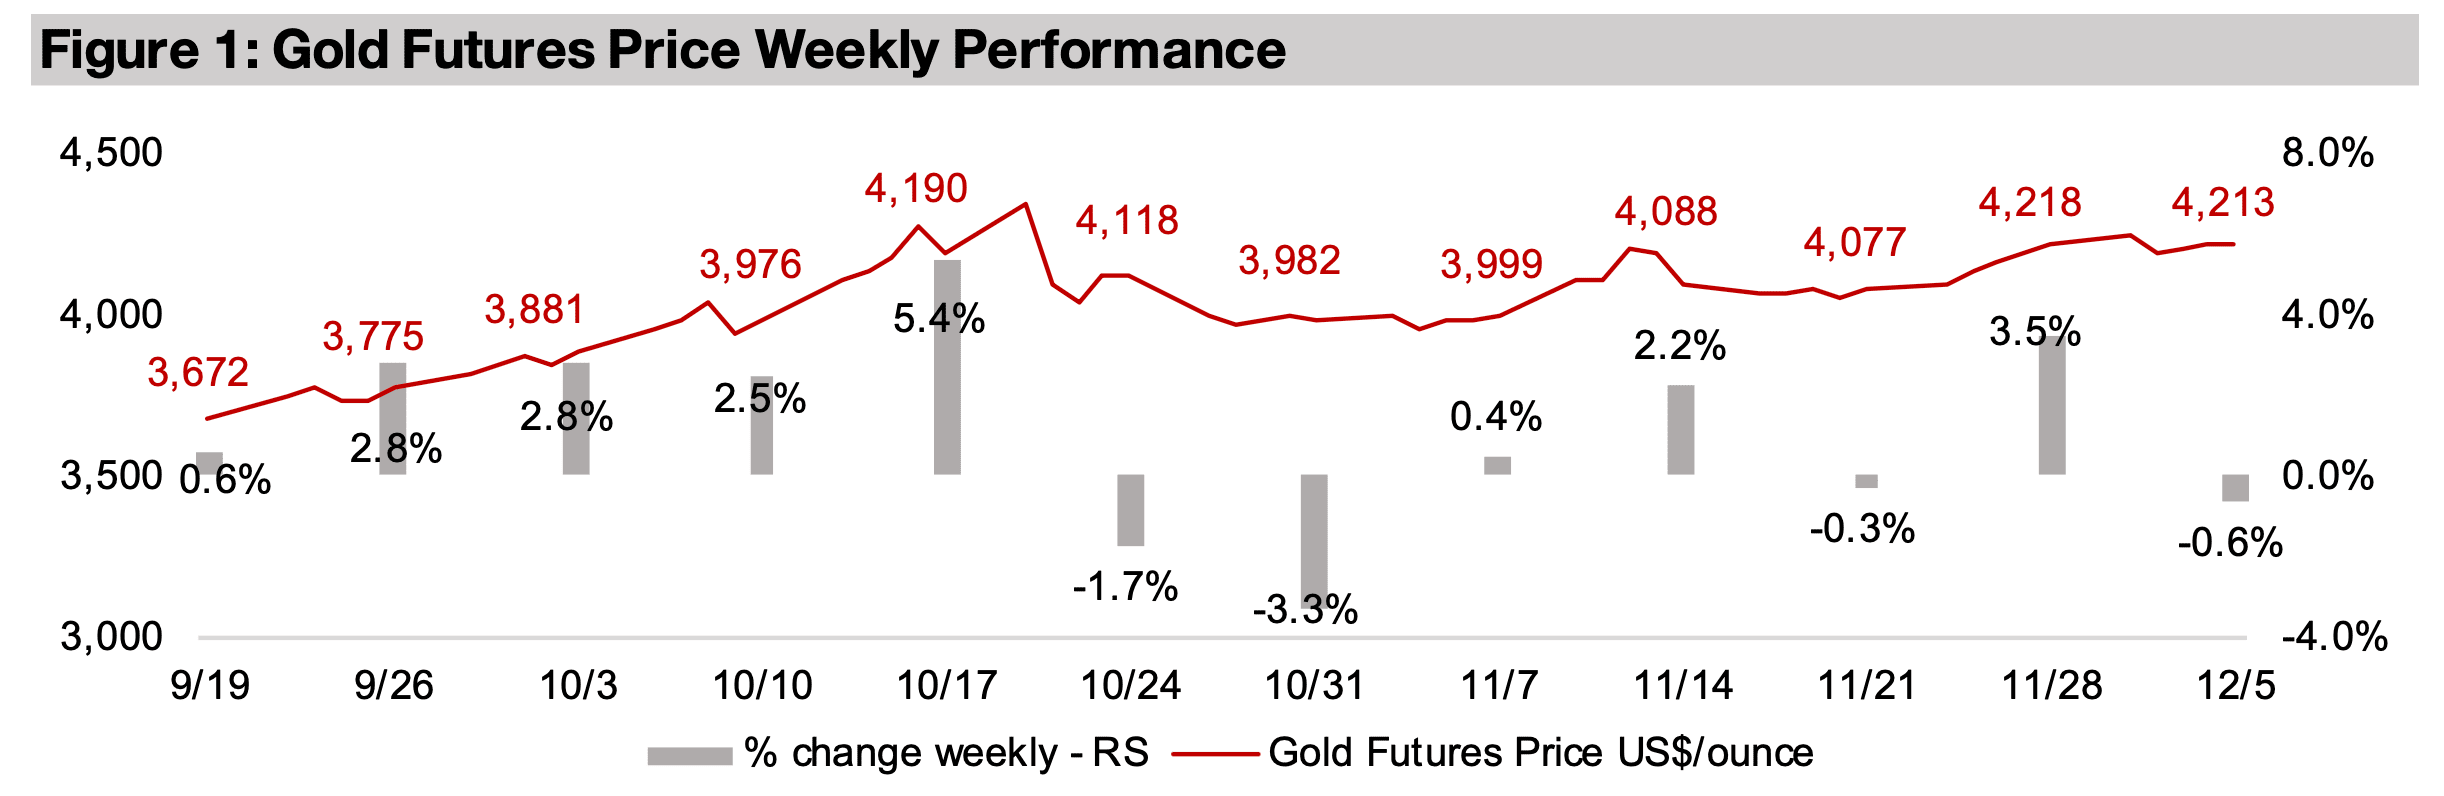
The gold price edged down -0.6% to US$4,213/oz, pulling back from highs of
US$4,239/oz reached mid-week, even as relatively weak US economic data
appeared to give the Fed justification for a December 2025 rate cut, which would
likely be supportive of the metal. However, an over US$200/oz gain in the metal over
the past month may have already priced in the upside from the potential rate cut. The
US Personal Consumption Expenditure (PCE) price index, a key inflation measure
tracked by the Fed, was reported for September 2025 after a delay from government
shutdown. The PCE Index rose 2.8% yoy, which was below market expectations,
although this still remains far above the central bank’s 2.0% inflation target. US
employment data continued to indicate a jobs slowdown, with November 2025 ADP
payrolls down -32k, well below the 40k gain forecast by the market, and down from
a strong 47k increase in October 2025, after the figure was revised upwards. Data on
expected US layoffs reported this week also remained high.
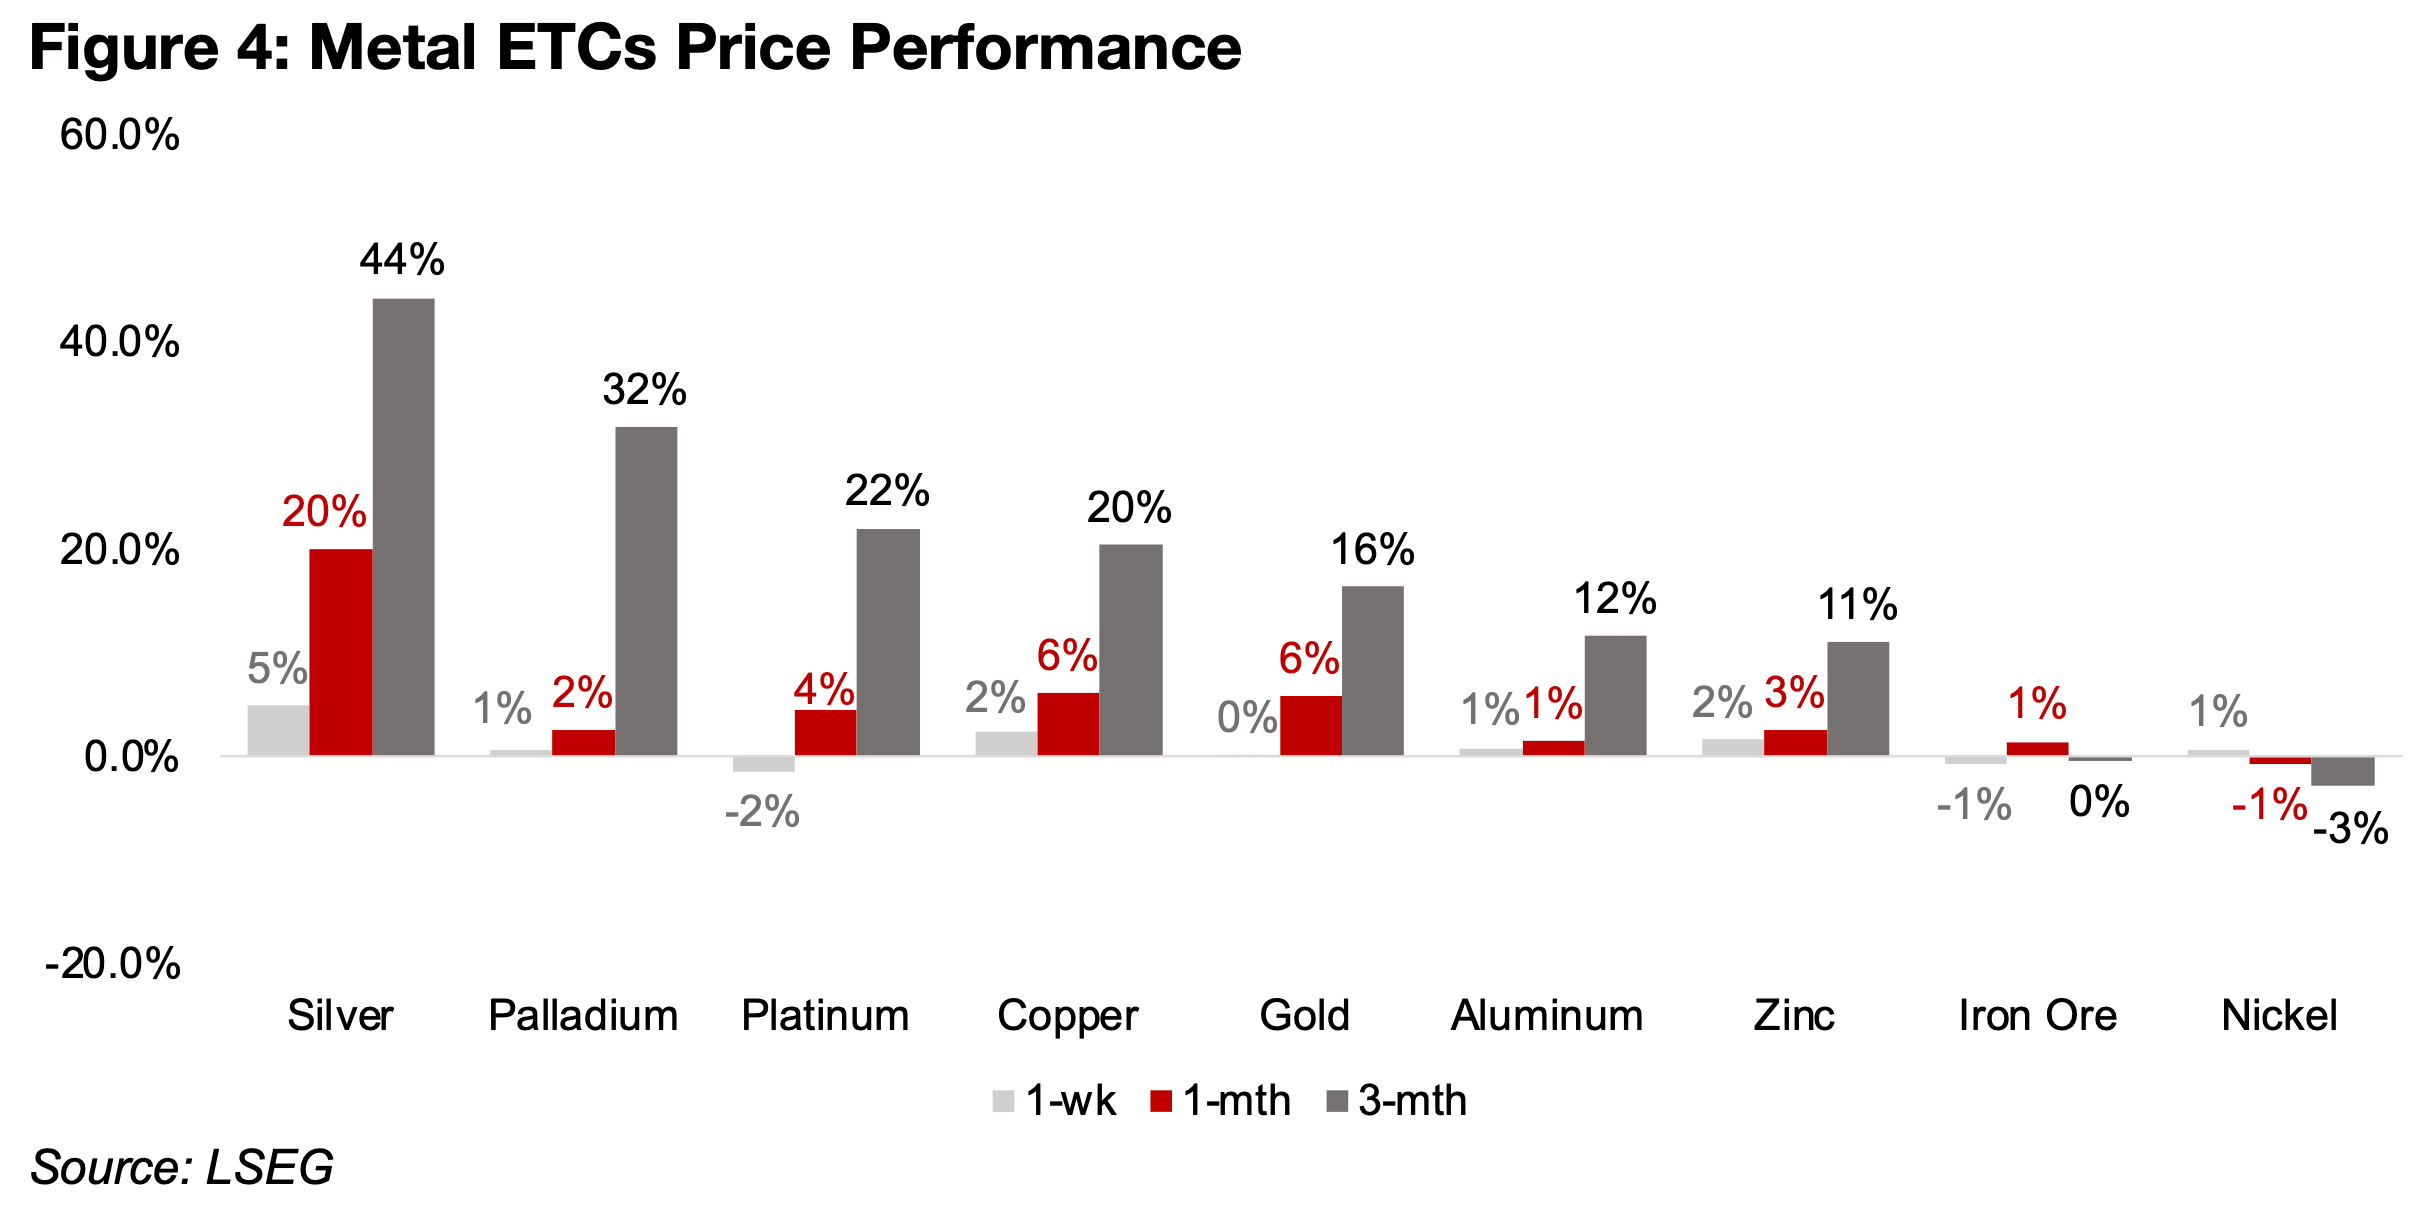
The gold price ETC was near flat, up just 0.1%, whlie the silver price continued to
outperform, rising 4.8%, with copper and zinc also strong, up 2.3% and 1.6%
respectively (Figure 4). Platinum was relatively weak, down -1.6% and the other
metals saw moves of under a percent. Silver has by far led the metals over the past
one and three months, rising 20% and 44%, with previous rally in the platinum and
palladium cooling over the past month, and the two metals up only 2% and 4%,
respectively. However, with gains of 32% and 22% over the past three months they
are still ahead of the 16% rise in gold. Copper has actually outperformed gold over
the past one and three months, with gains of 6.1% and 20% versus 5.8% and 16.4%.
The strength in both silver and copper have been driven by major distortions of the
proportions of physical stocks of the metals typically held in different regions globally.
The gold stocks declined, with the GDX down -2.6% and GDXJ off -2.4% on the drop in the metal, underperforming the gain in equities, with the S&P 500 up 0.9%, the Nasdaq gaining 1.8% and the Russell 2000 increasing 1.6%. This was driven in part by a pickup in global tech, with the sector ETF up 3.1%, while another sign of a general risk on shift by markets this week, likely on the expected Fed rate hike, was a rise in the Bitcoin IBIT ETF, gaining 3.6%. The key defensive sectors in addition to gold were also relatively weak, with global utilities down -3.7% and global consumer staples down -3.5%, showing less hedging by markets this week.
The distortion in the typical proportions of copper stocks held globally has been from
a shift in the metal clearly towards the US CME. This came from concerns over
potential US tariffs on the metal that could increase the cost for US buyers and
therefore encourage stockpiling in advance of any price hikes. This started in March
2025 when an investigation into tariffs for the metal by the US was announced, which
was eventually followed by the implementation of tariffs on some copper products in
August 2025. While the tariffs in August were not as wide in scope as had been
expected by the market, and only covered a relatively small proportion of US copper
exports, concerns over securing copper supply in the US remain, driving the build up.
The proportion of global copper stocks held at the CME has risen from just 17.7% of
the combined holdings of the CME, UK’s LME and China’s SHFE in March 2025 to
62.5% as of November 2025 (Figure 5). Historically the LME been the main global
trading hub for the metal and held by far the largest proportion of copper inventory,
averaging 50.9% from 2014 to 2024, with only 28.0% at the SHFE and with the CME
with the smallest share at 21.2%.
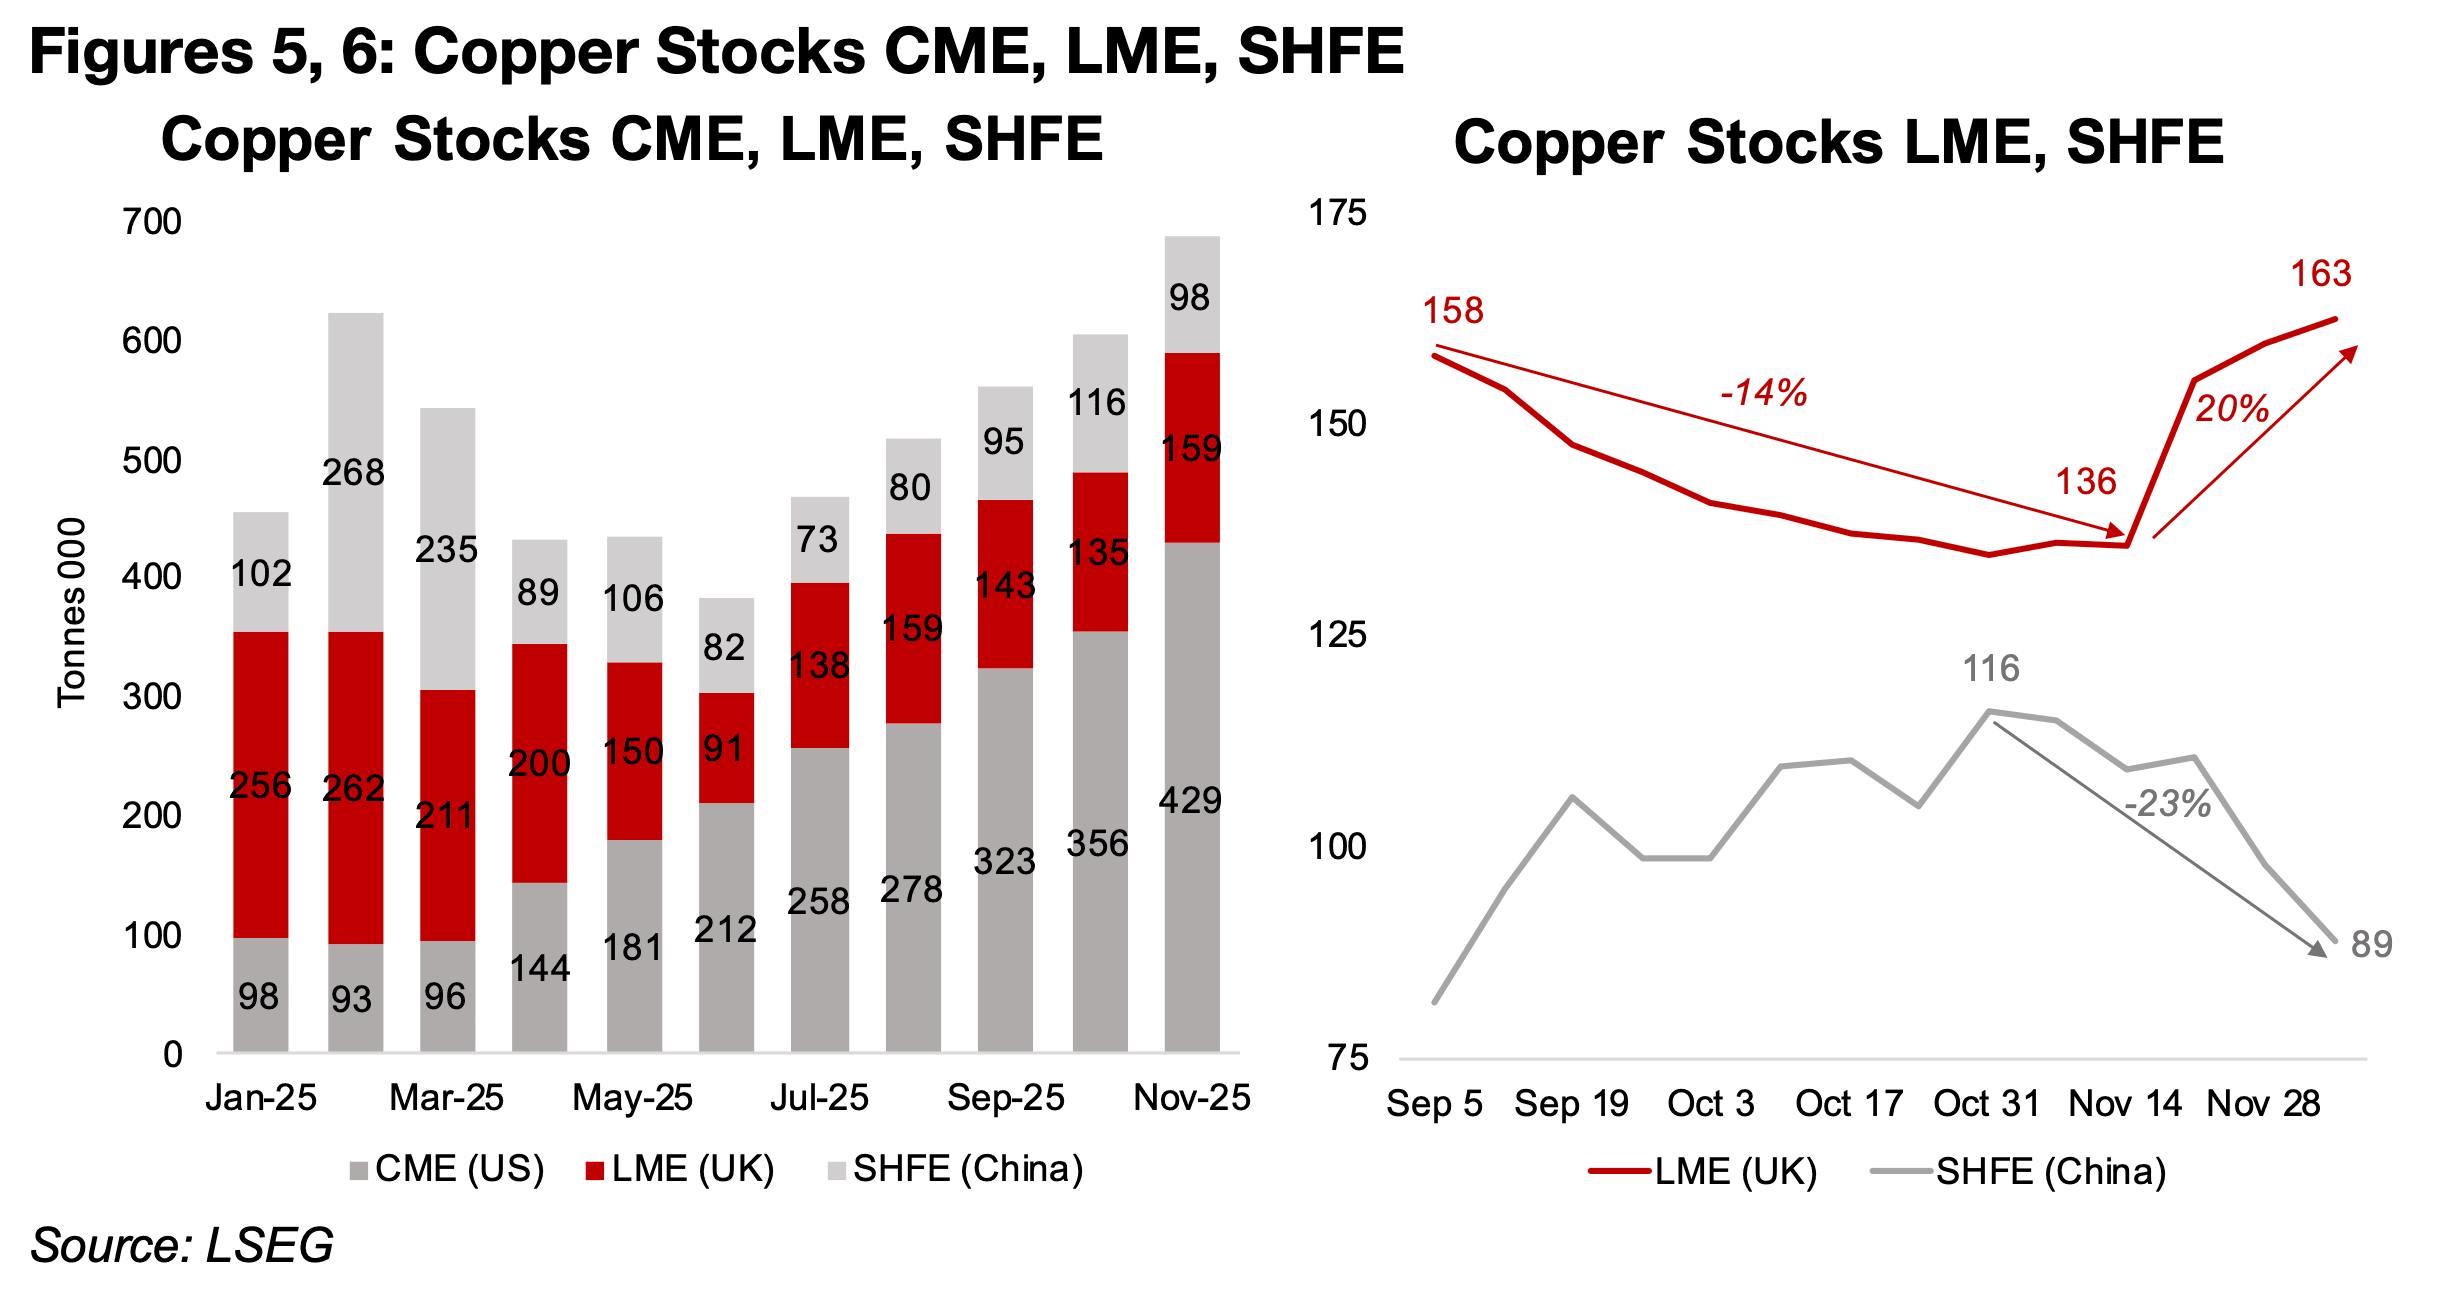
Over the past two months, the shift towards the CME had depleted LME copper
inventories by -14%, to 136k tonnes as of October 24, 2025, from 158k on September
5, 2025, although they had rebounded to 20% to 163k as of December 5, 2025 (Figure
6). This appears to have been mainly on imports from China, with the SHFE
inventories slump -23% in just over a month from 116k tonnes as of October 31, 2025
to 89k tonnes as of December 5, 2025. The stock in China may also not be quickly
boosted, as the country is cutting smelter production with overcapacity in the sector
driving down treatment and refining charges to unprofitable levels. This could in turn
limit the ability of the country to export copper to offset shortfalls of the metal in the
UK and meet the surging demand in the US and could put continued upward pressure
on the price.
These supply issues have been exacerbated by a decline in production at Grasberg,
the second largest global copper mine, after a major mudslide in September caused
a shutdown of part of the mine. This shifted what was previously expected to be a
slight surplus for the market in 2025 and 2026 to forecasts for a balanced market, or
even a deficit, which could also drive up the price. Demand has also been robust for
the metal, and that it is now even outpacing gold in recent months seems to imply
that the market is shifting away from its stagflationary expectations earlier this year.
The major rise in the gold price but muted gain in copper had indicated that the
market was forecasting that higher inflation that would not necessarily translate to
strong economic growth. However, with these two metals now moving up in tandem
it suggests the market now expects that the monetary expansion could also drive a
rise in global GDP, as would generally be expected. Still, a significant component of
the strong copper demand appears to be related to AI, including data centers, and
there has been increased warnings raised about the sustainability of this trend.
There has also been an ongoing global silver shortage, which has caused two spikes
in the price over the past two months. Underlying this has been silver deficit in the
market for fifth consecutive year, with supply expected to rise moderately this year,
but still be outpaced by rising demand. This has put pressure on physical silver stocks
in the UK over the past year, and imports from China have been a major factor in
balancing this shortage, similarly to the recent situation for copper.
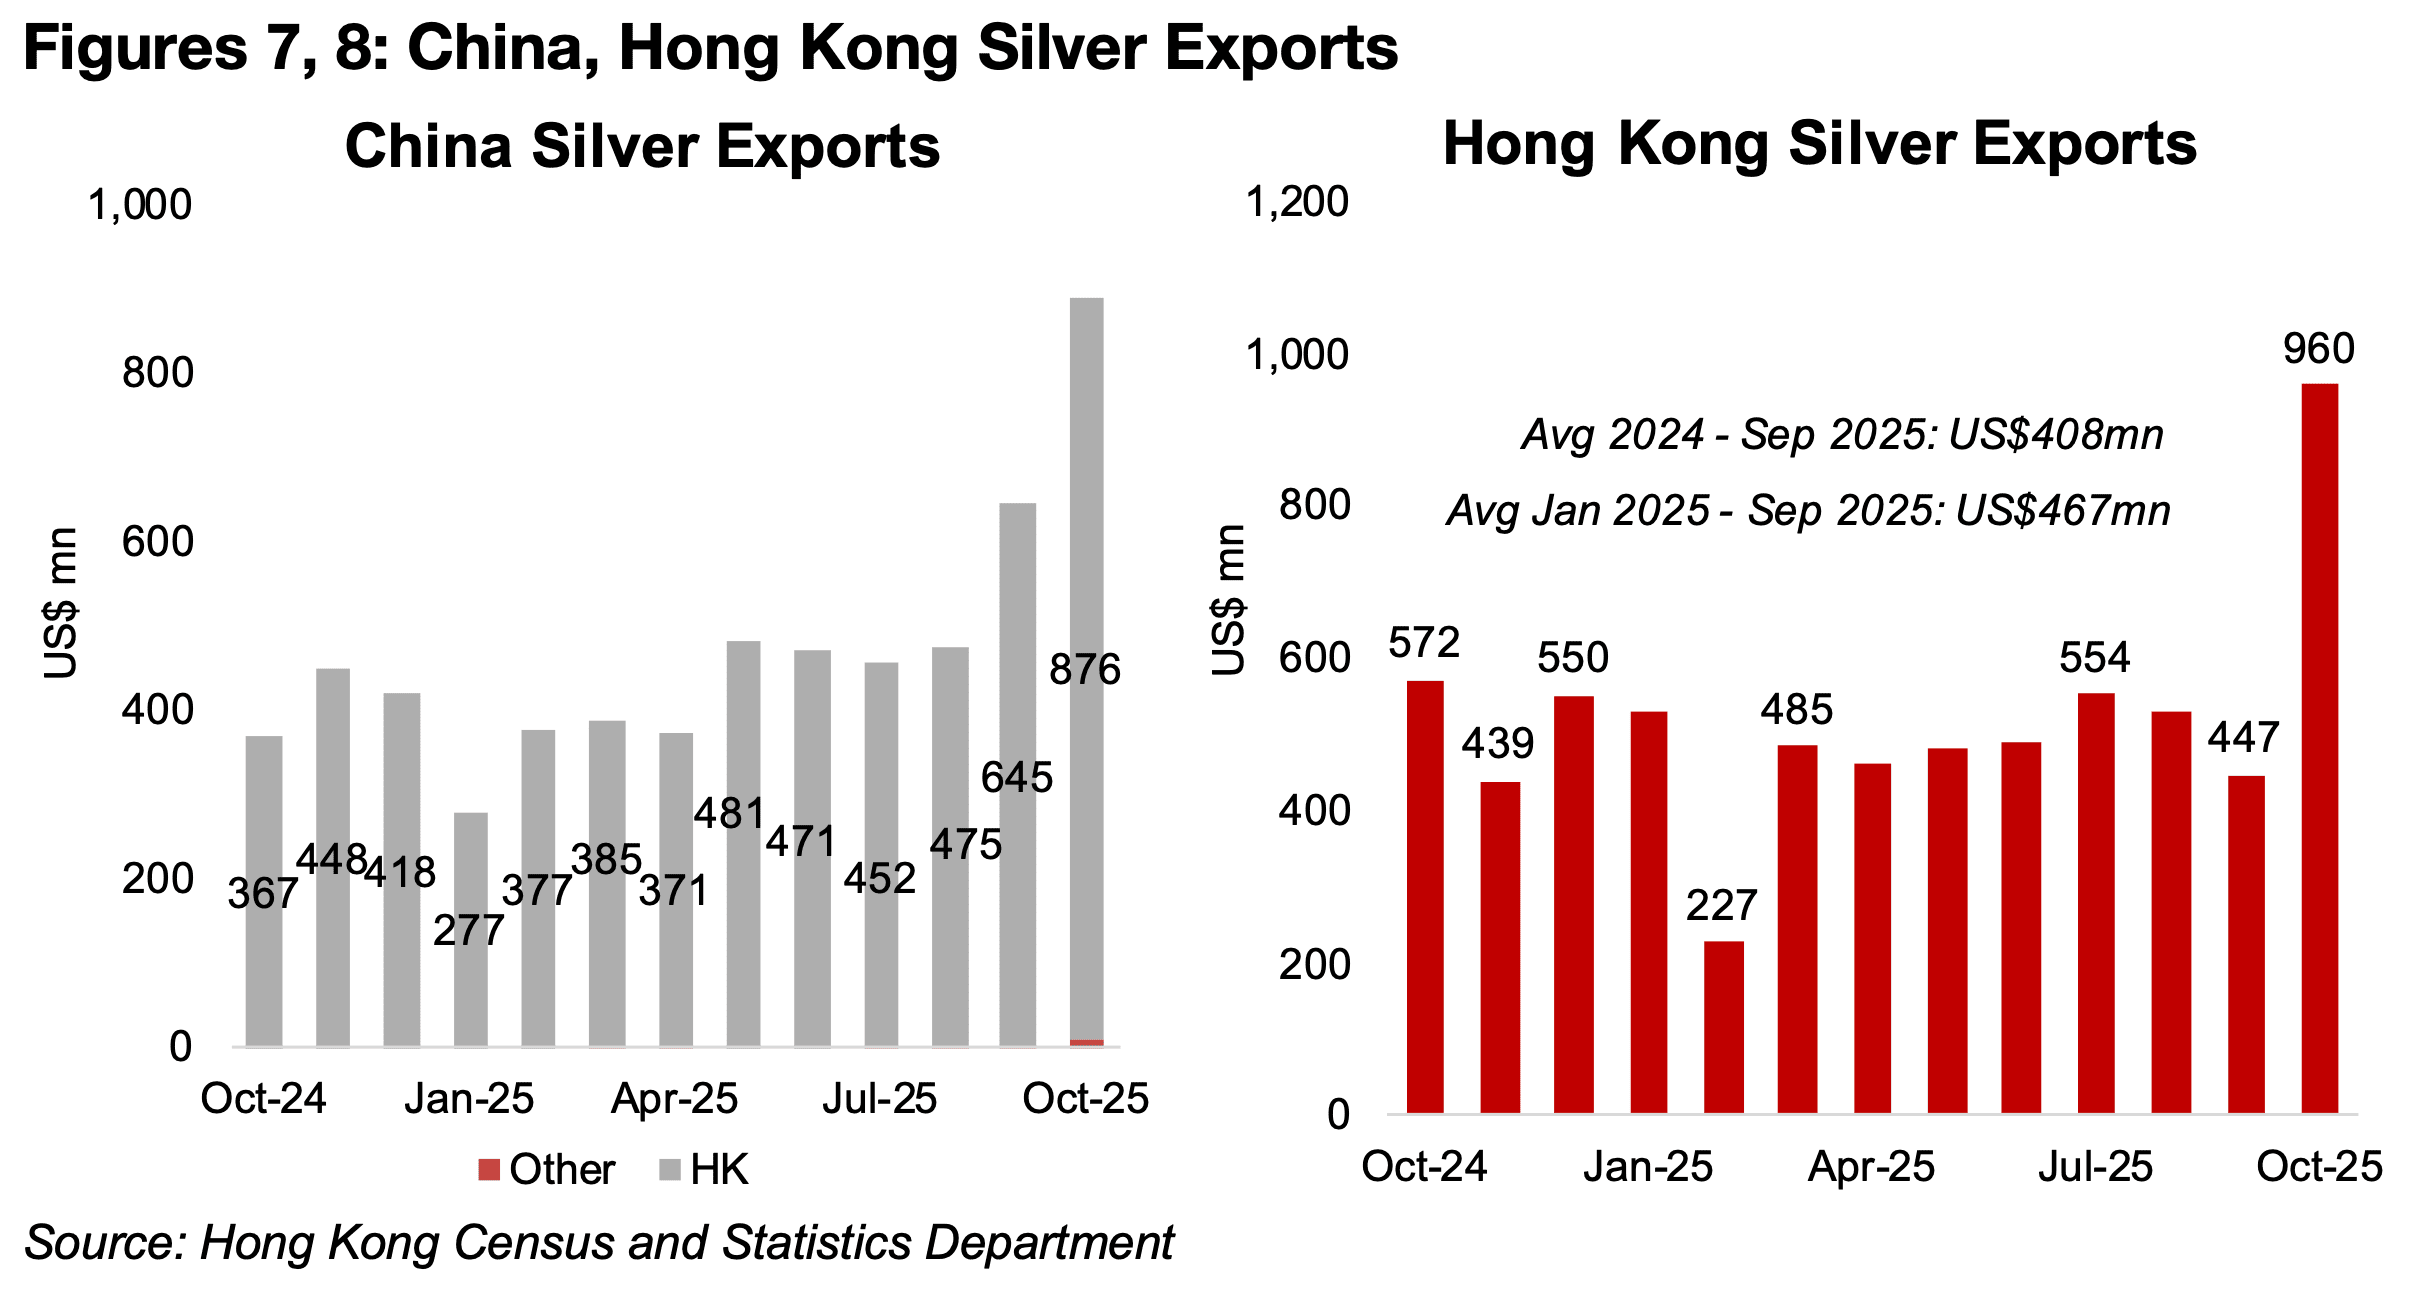
China actually only exports a tiny amount of silver directly from the mainland to global
markets, and over 99% goes first to Hong Kong, which is a major trading hub for the
metal (Figure 7). Signs of the market distortions for silver are seen in China’s silver
exports starting three months ago. After averaging just US$411mn per month from
October 2024 to August 2025, China’s silver exports to Hong Kong jumped 64%
above this average month on month in September to US$675mn, and by another 30%
month on month to US$876 mn in October 2025.
This was then passed through to a major rise in Hong Kong’s silver exports globally,
which jumped to US$960mn in October 2025, more than double the average of
US$408 mn from 2024 to September 2025 and the US$467mn average from January
2025 to September 2025 (Figure 8). Given the silver price spike in late November
2025 and early December 2025, which again were caused by major shortfalls in UK
inventories, we could again see high China and Hong Kong exports to the country in
November and December 2025.
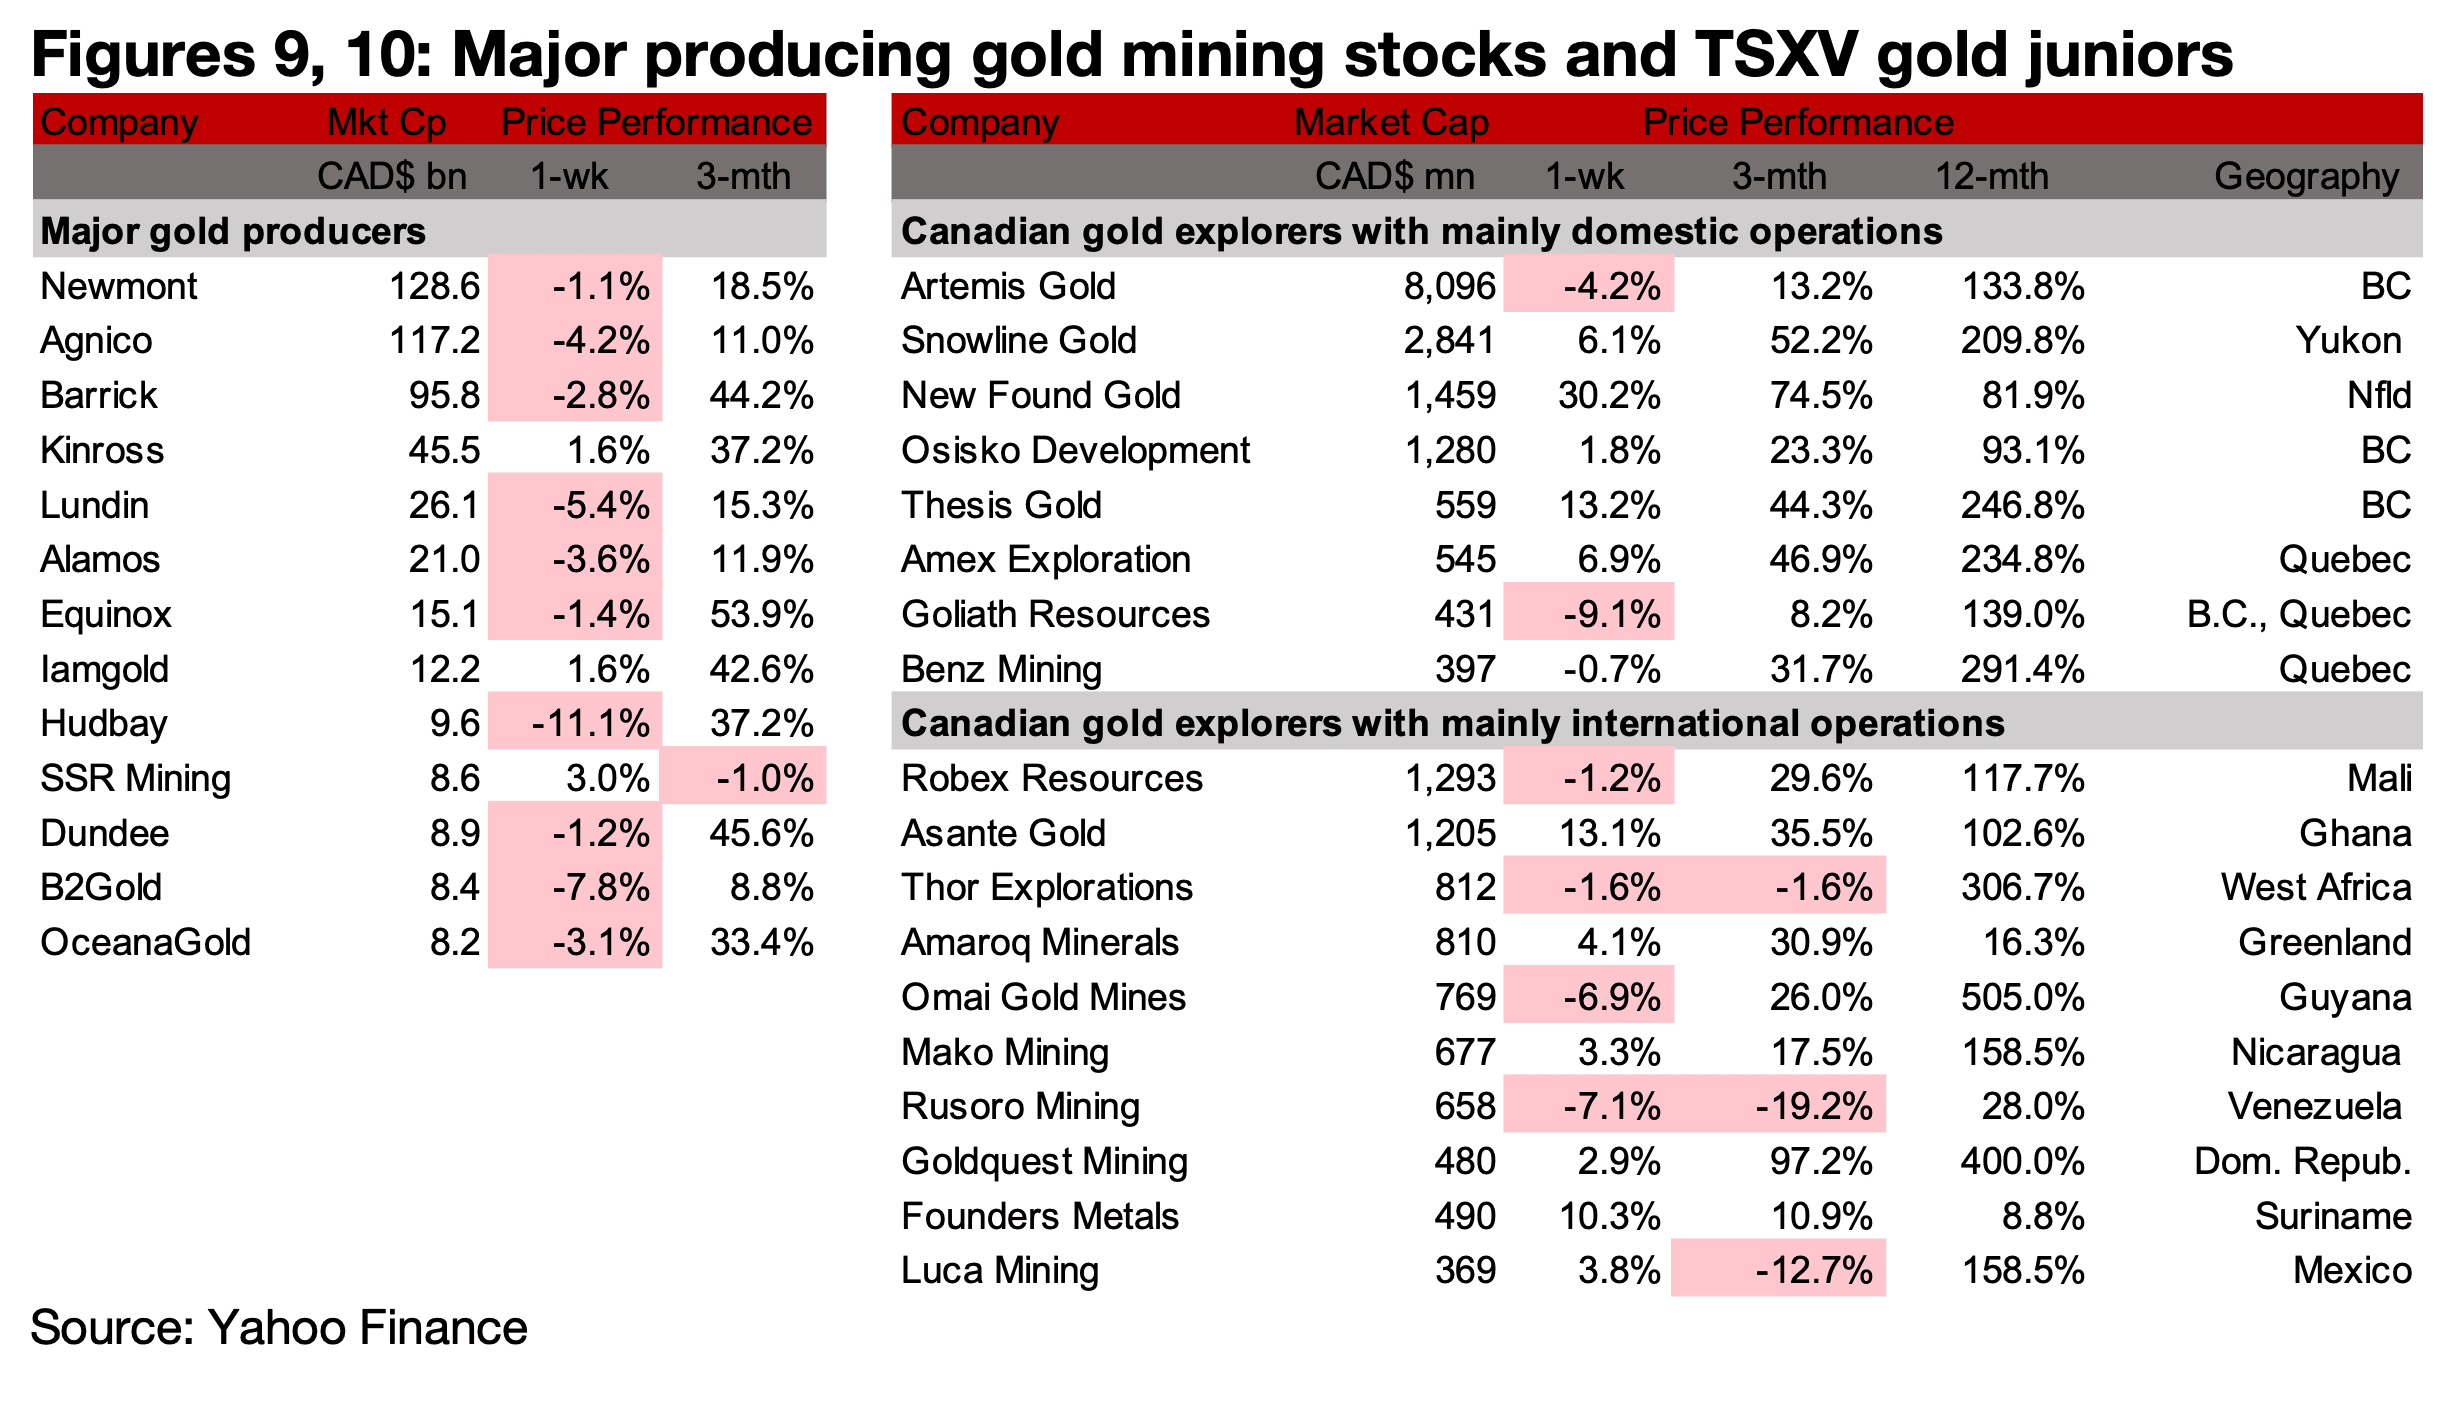
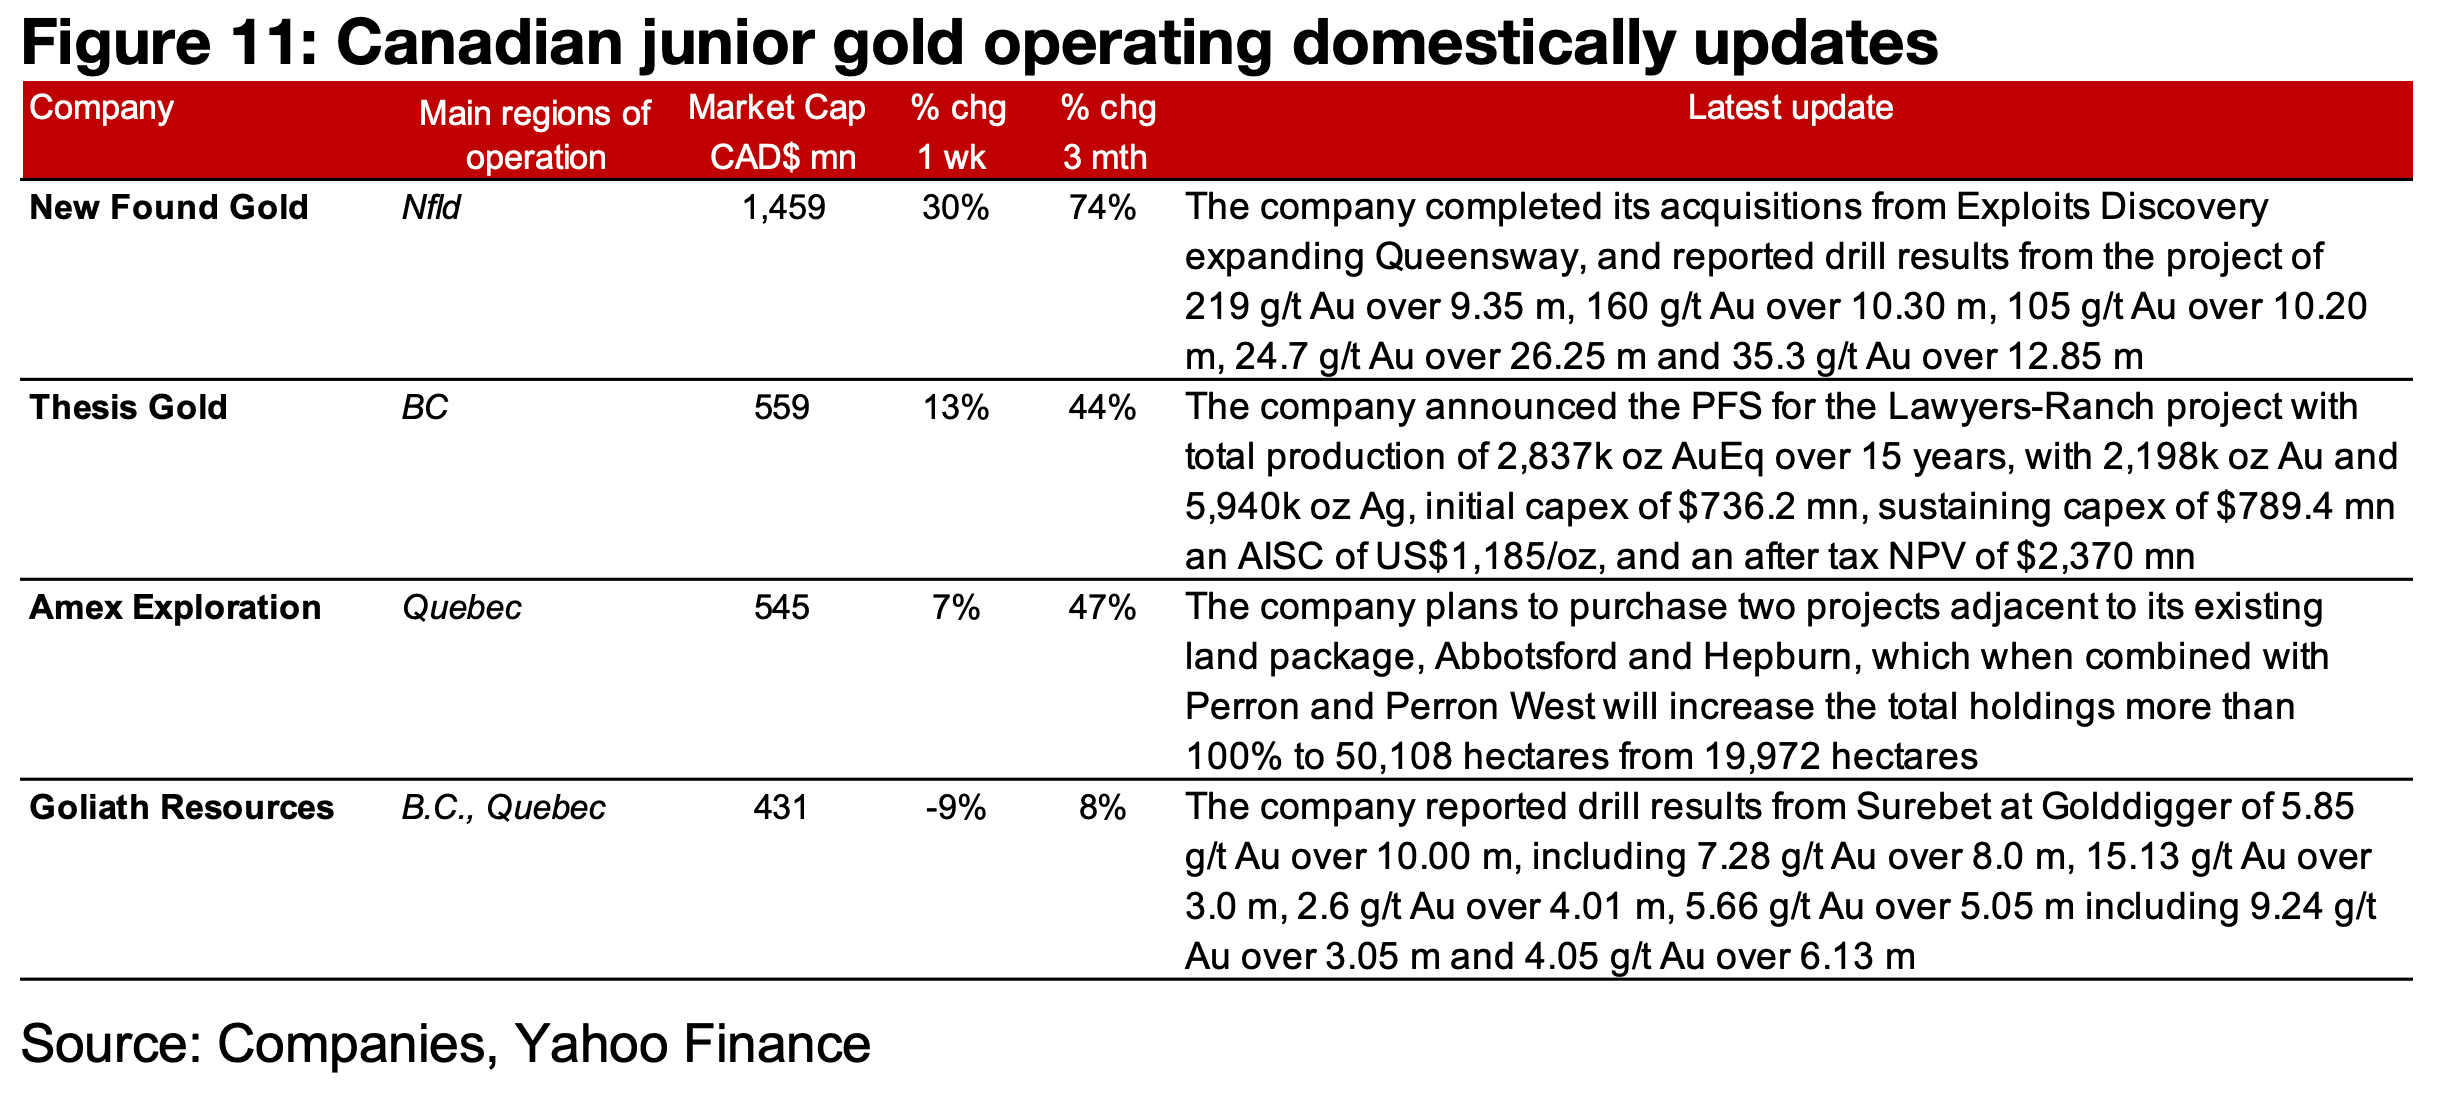
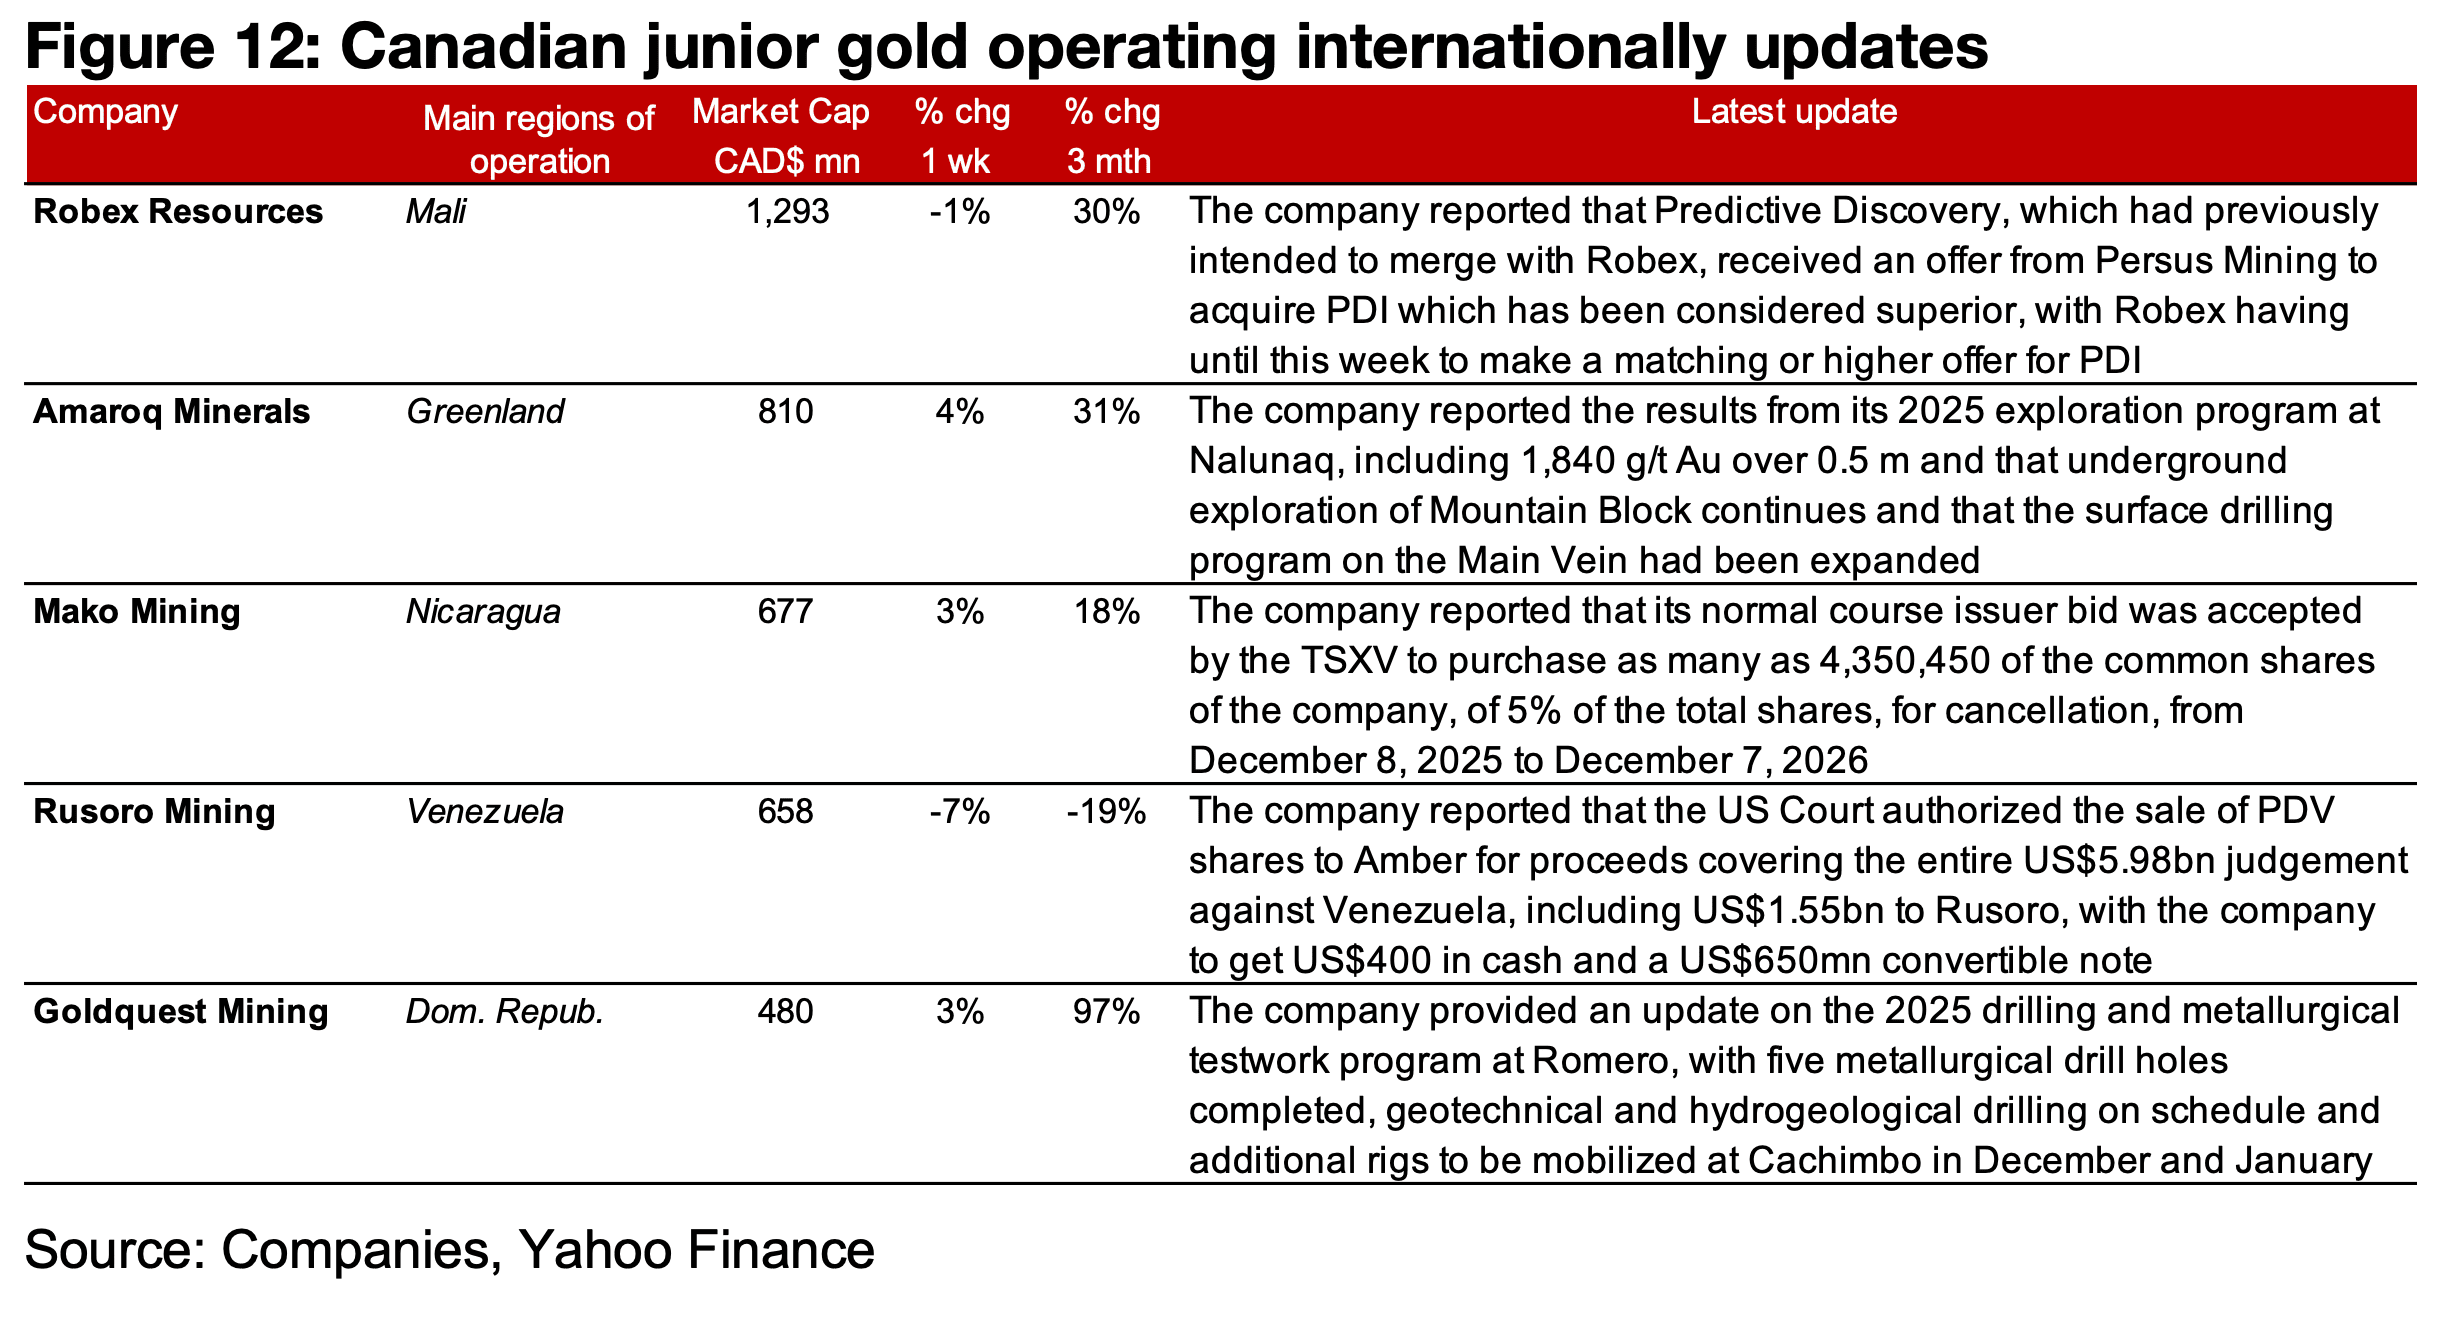
The major producers mostly declined and TSXV gold was mixed (Figures 9, 10). For the TSXV gold companies operating mainly domestically, New Found Gold completed acquisitions from Exploits Discovery, Thesis announced the PFS for Lawyers-Ranch, Amex plans to purchase two mineral claims and West and Goliath reported drill results from Surebet (Figure 11). For the TSXV gold companies operating mainly internationally, Robex reported that PDI, which it previously planned to merge with, has a bid from Perseus, Amaroq reported results from its 2025 exploration program, Mako’s normal course issuer bid was accepted, Rusoro announced its payout after the US court approved the sale of PDV, and Goldquest provided an update on its drilling and metallurgical testwork program (Figure 12).
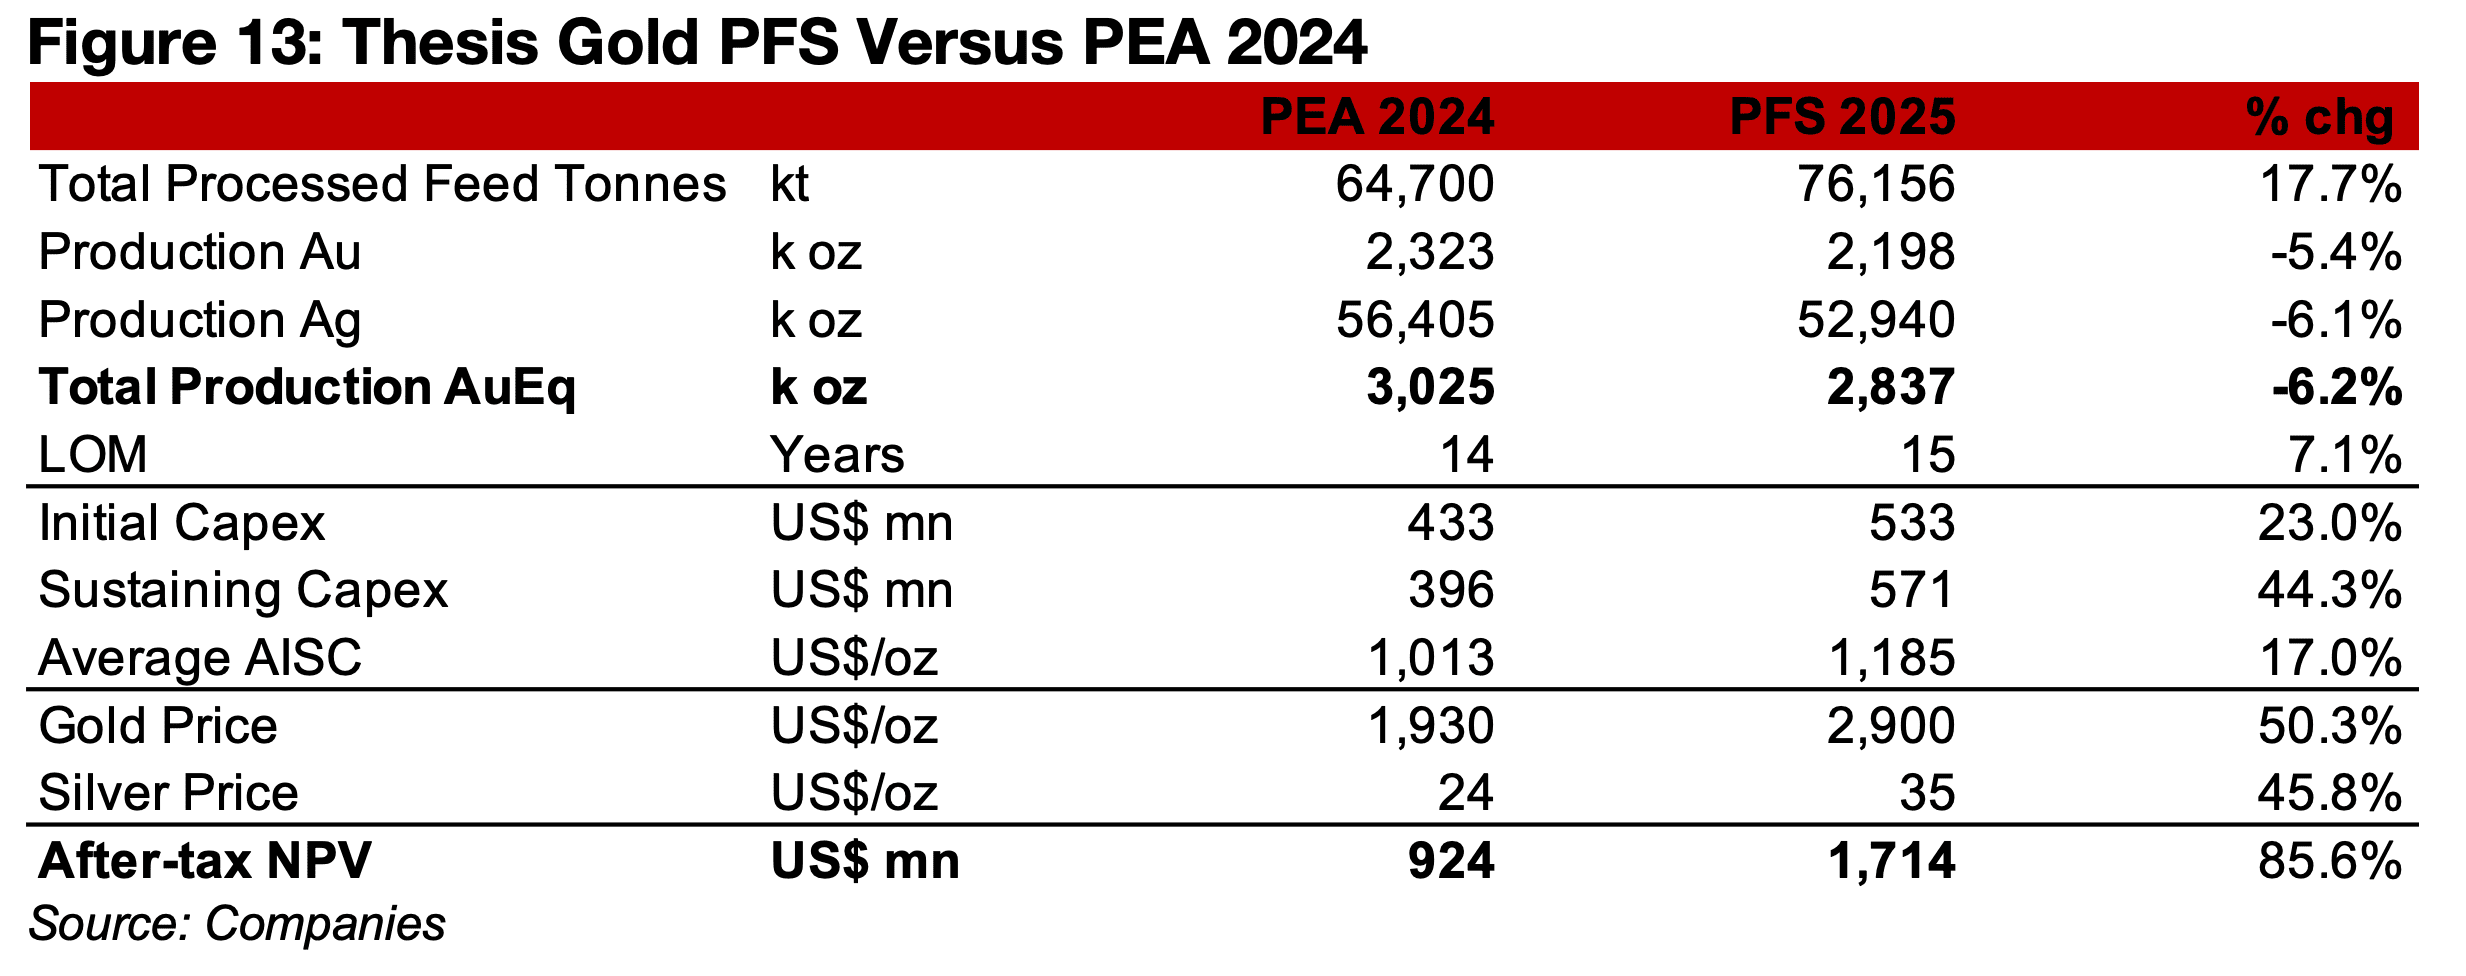
Thesis reported its Pre-Feasibility Study for the Lawyers-Ranch project, indicating a substantial 156.4% increase in its NPV to US$1,714mn, up 85.6% from the Preliminary Economic Assessment, which had an NPV of US$924mn (Figure 13). The increase has mainly been driven by a much higher metal price assumptions, with gold at US$2,900/oz, up 50.3% from the previous US$1,930/oz estimate, and silver up 45.8% to US$35/oz from US$24/oz. The total production has actually declined -6.2% to 2,837k oz AuEq, with 2,198k oz Au, down -5.4%, and 52,940k oz Ag, down -6.1%. The years of operation for the project have increased slightly to 15 from 14 years previously. Costs have also increased, with the initial capex up 23.0%, sustaining capex increased 44.3% and the AISC gaining 17.0%.
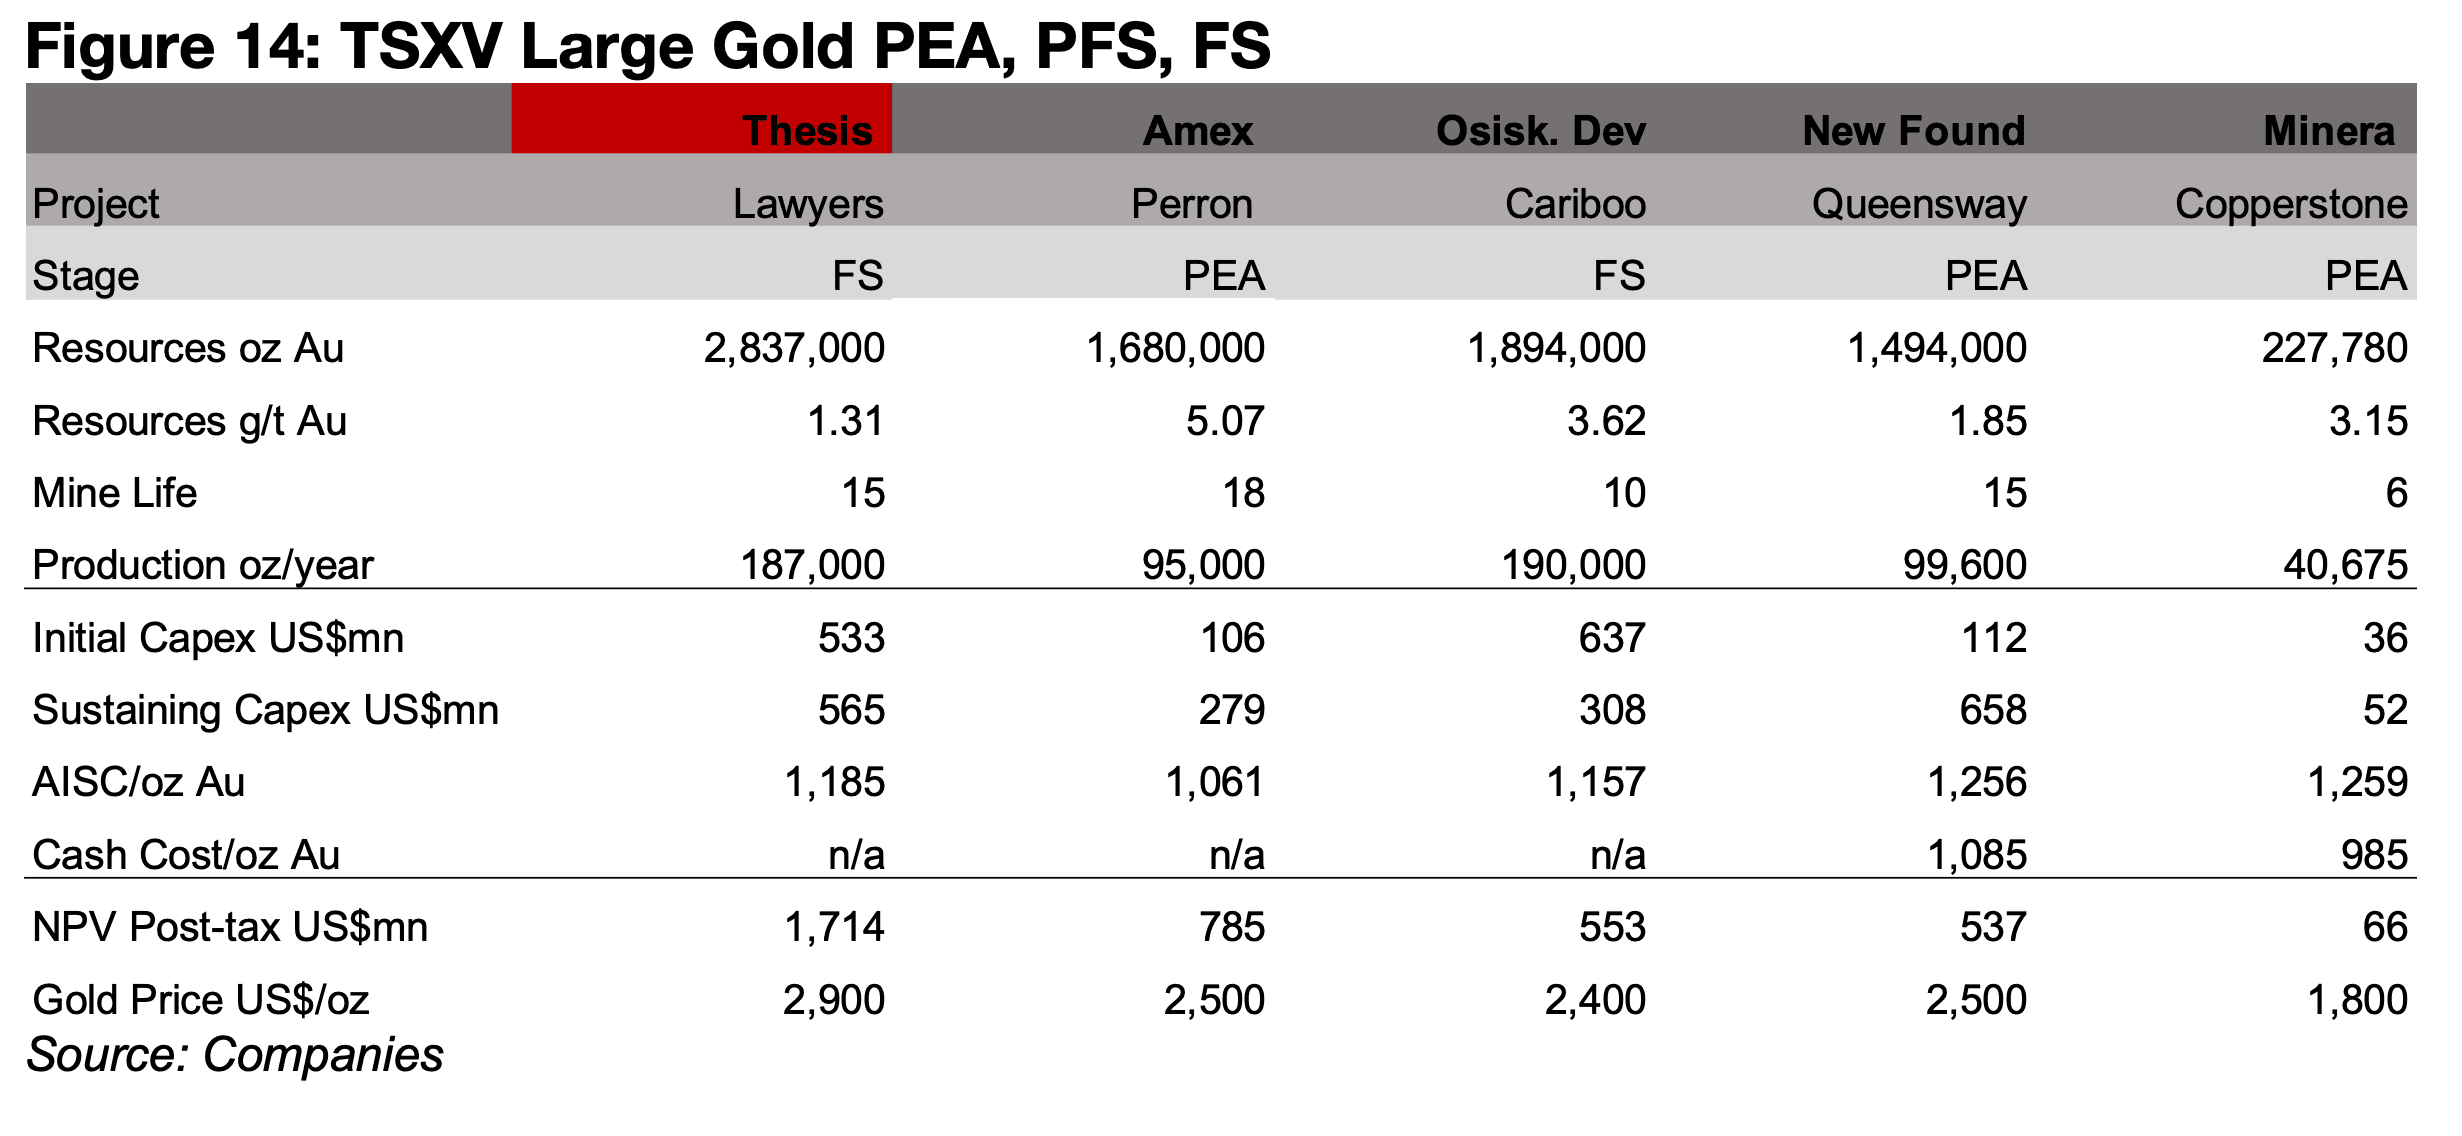
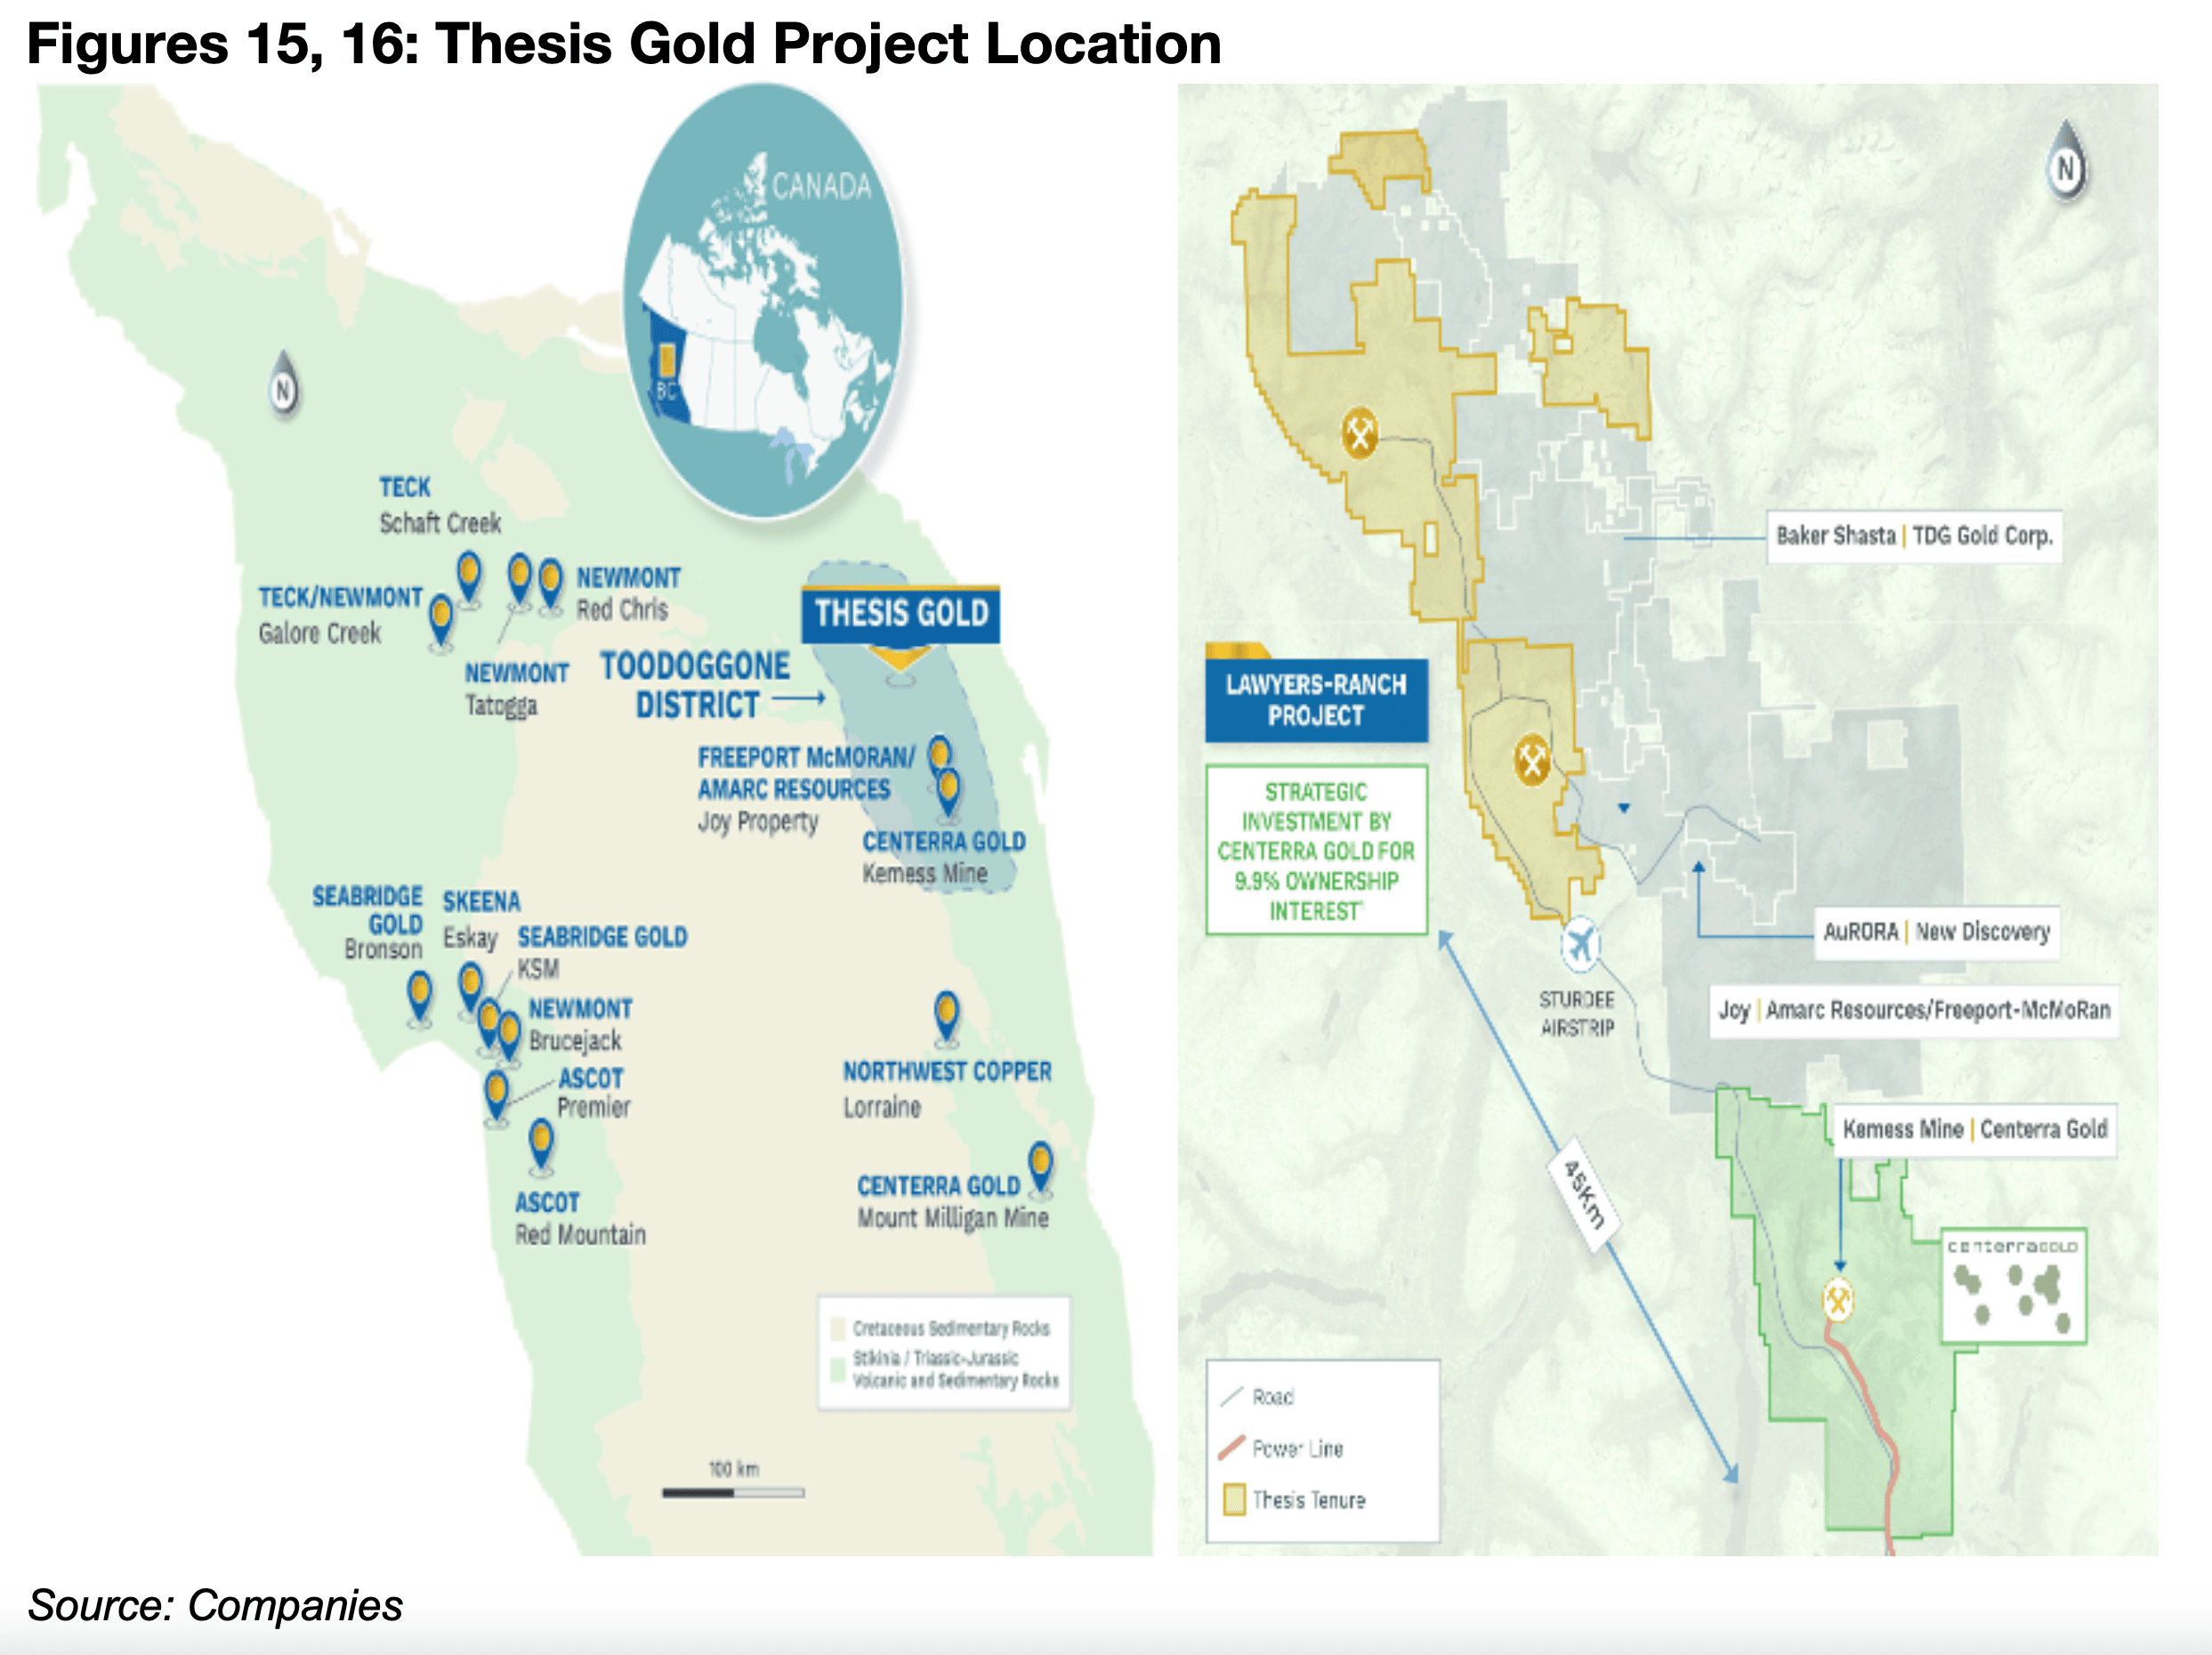
The Lawyers-Ranch project will actually become the largest of the major TSXV gold developers in terms of total resources at 2.8 mn oz Au and its NPV of US$1.7mn, with Snowline Gold having moved to trading on the TSX over the past week, and its Rogue project previously the largest (Figure 14). However, it has a relatively low grade versus the large TSXV developers, at 1.31 g/t Au, with the rest ranging from 1.85 g/t Au to 5.07 g/t Au. The initial capex for Lawyers-Ranch is relatively low versus the group given its size, and its AISC is in the middle of the large TSXV gold developers. However, it is using a significantly higher gold assumption than most of the other projects at US$2,900/oz, versus US$2,400/oz-US$2500/oz for all the other projects except for Minera Alamos, with a much lower US$1,800/oz assumption. The project is in northeast British Columbia, in the Toodoggone District, close to projects operated by Freeport McMoran/Amarc Resources, Centerra Gold, Aurora, and TDG Gold (Figures 15, 16).
Source: Companies Disclaimer: This report is for informational use only and should not be used an alternative to the financial and legal advice of a qualified professional in business planning and investment. We do not represent that forecasts in this report will lead to a specific outcome or result, and are not liable in the event of any business action taken in whole or in part as a result of the contents of this report.
Author
Ben McGregor authors the Weekly Roundup at CanadianMiningReport.com, providing sharp analysis of the metals and mining sector. With a talent for spotting trends, Ben distills complex market shifts into clear, engaging insights on TSXV junior miners. His weekly updates cover gold, copper, uranium, and more, blending data-driven perspectives with a knack for identifying opportunities. A vital resource for investors, Ben’s work navigates the dynamic junior mining landscape with precision.