
Sep 11, 2020
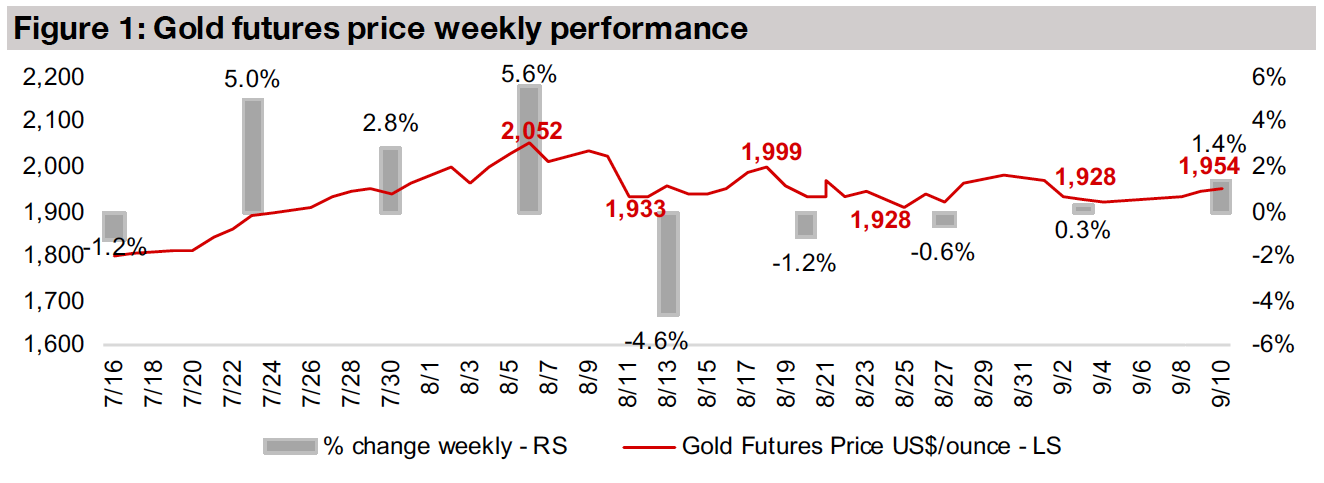
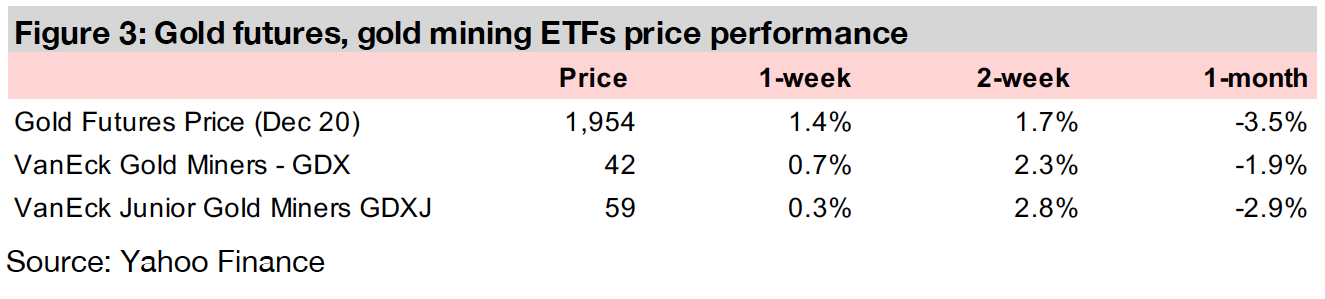
The gold price closed at US$1,954/oz, up 1.4% this week, and 28% YTD, continuing to hold within its US$1,900/oz-US$2,000/oz trading range of the past seven weeks, and has been outpaced by silver since late-July, which is up 51% YTD.
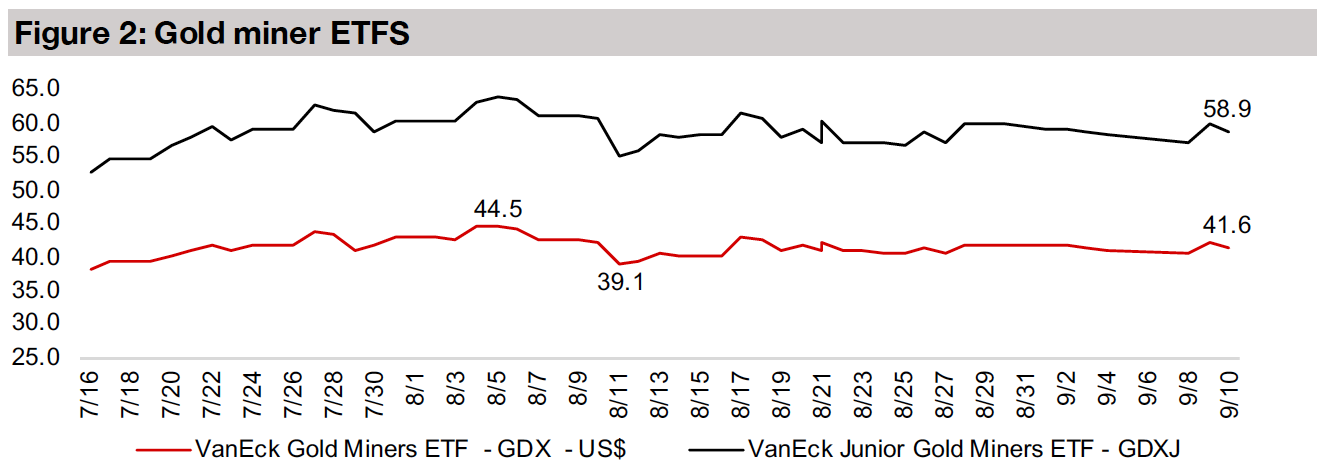
The producing gold miners were mixed this week, and while the GDX rose 0.7%, it has remained relatively flat for nearly two months, trading between US$39.1-US$44.5, with the holding pattern driven by underlying range-bound gold.
With gold seeing an extended pause, we review the individual stories for Canadian mining companies in the junior gold mining sector operating domestically this week, and In Focus is O3 Mining, which reported a PEA for its Marban project.


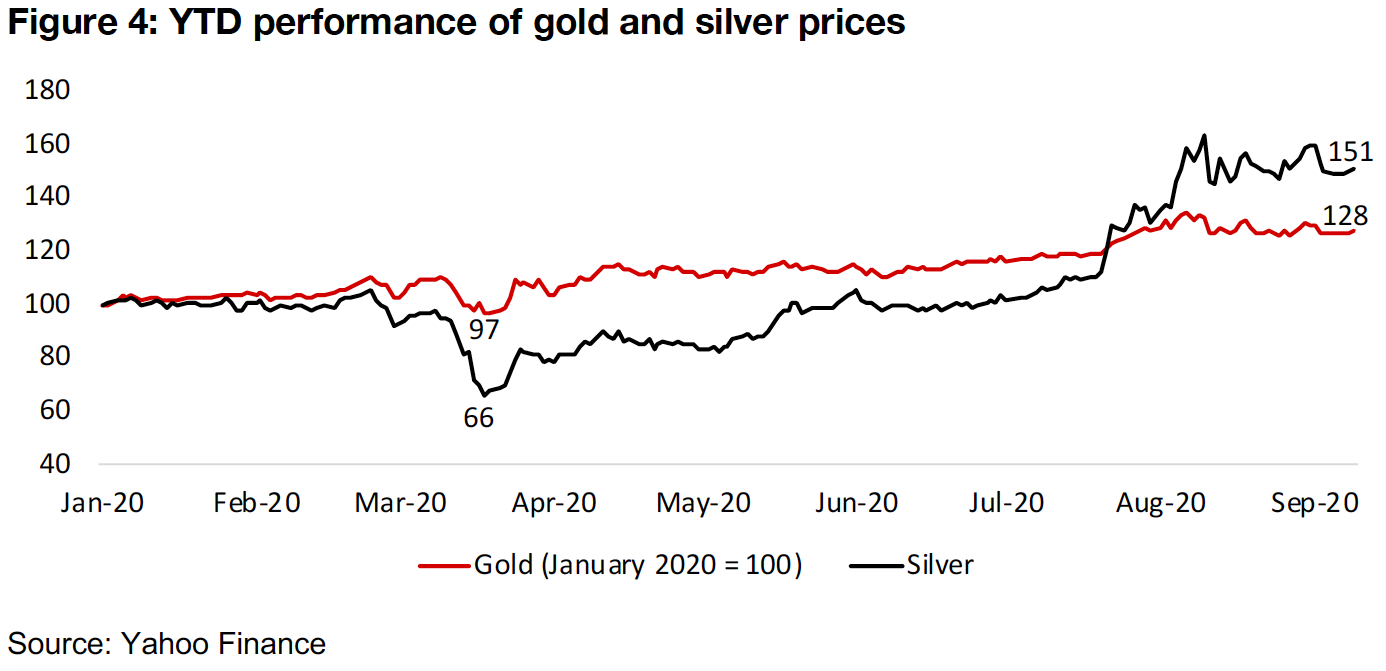
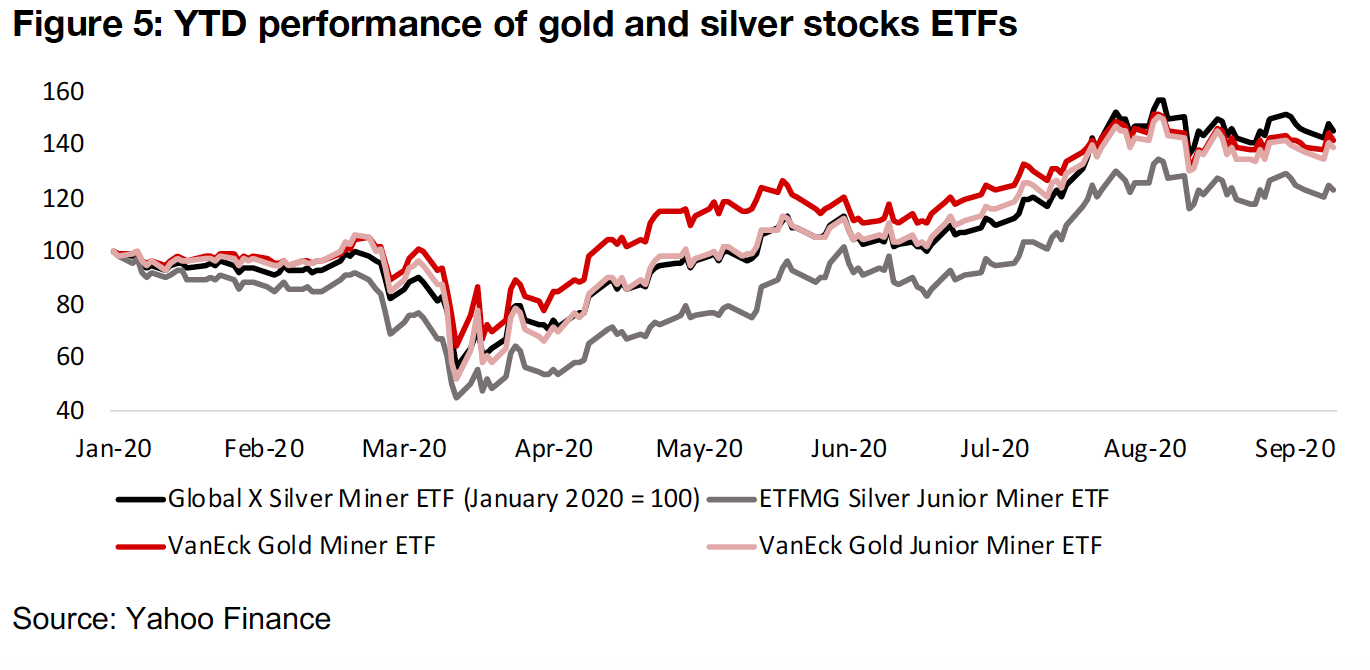
While of the mining companies in Canada, both gold and silver stocks have been clear stand outs this year, silver stocks performance have been edging ahead of gold for about the past six weeks. This has been driven by a surge in the silver price, which really picked up around late-July 2020, as the gold price moved into range bound trading of US$1,900/oz-US$2,000/oz, which has persisted for seven weeks (Figure 4). While gold closed at US$1,954/oz this week, and is now up a strong 28% YTD, silver has gained 51%. This has sent the Global X SIJ silver miner ETF, which pools some of the best silver stocks globally, up 46% this year, which is now ahead of the VanEck gold miner and the VanEck junior mining ETF, up 42% and 39%, respectively. However, the ETGMG SIJL junior silver mining ETF, while up a strong 23% this year, still lags this group (Figure 5).
With the gold price heading for seven weeks in its new range, we use the pause in this broader driver to take a look at the individual performance more company specific drivers and resource valuations for the group of Canadian junior gold miners operating mainly domestically, comprising Victoria Gold, Pure Gold, Great Bear, GT Gold, Probe Metals, White Gold, O3 Mining and Bonterra Resources. In terms of market cap and performance, these companies can be split roughly into three groups. First are the big gainers, Victoria Gold, operating the Eagle Mine in the Yukon, and Pure Gold and Great Bear, both operating in Red Lake, Ontario (Figure 6). Second are the companies that have seen reasonably strong gains, GT Gold, and Probe Metals, operating in B.C.'s Golden Triangle and Val-d'Or East in Quebec, respectively (Figure 7). The third are the companies that have seen a weaker performance this year, with White Gold, O3 Mining and Bonterra Resources, operating in the Yukon's White Gold District, Val-d'Or, Quebec and Abitibi, Quebec, respectively (Figure 8).
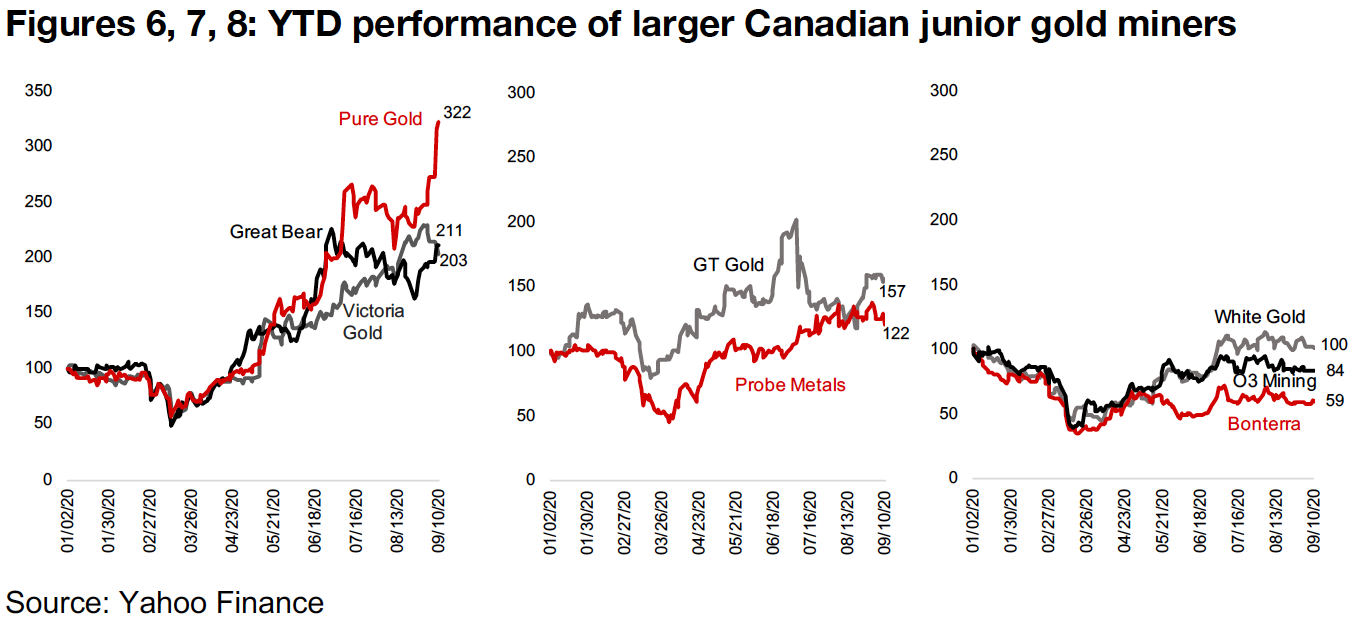
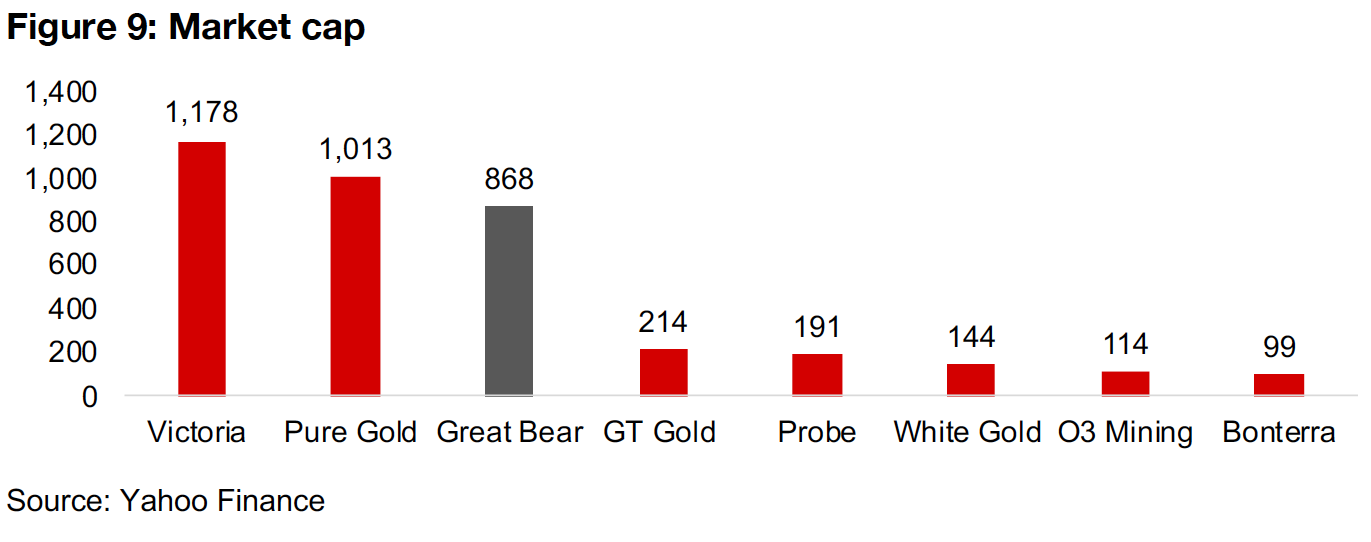
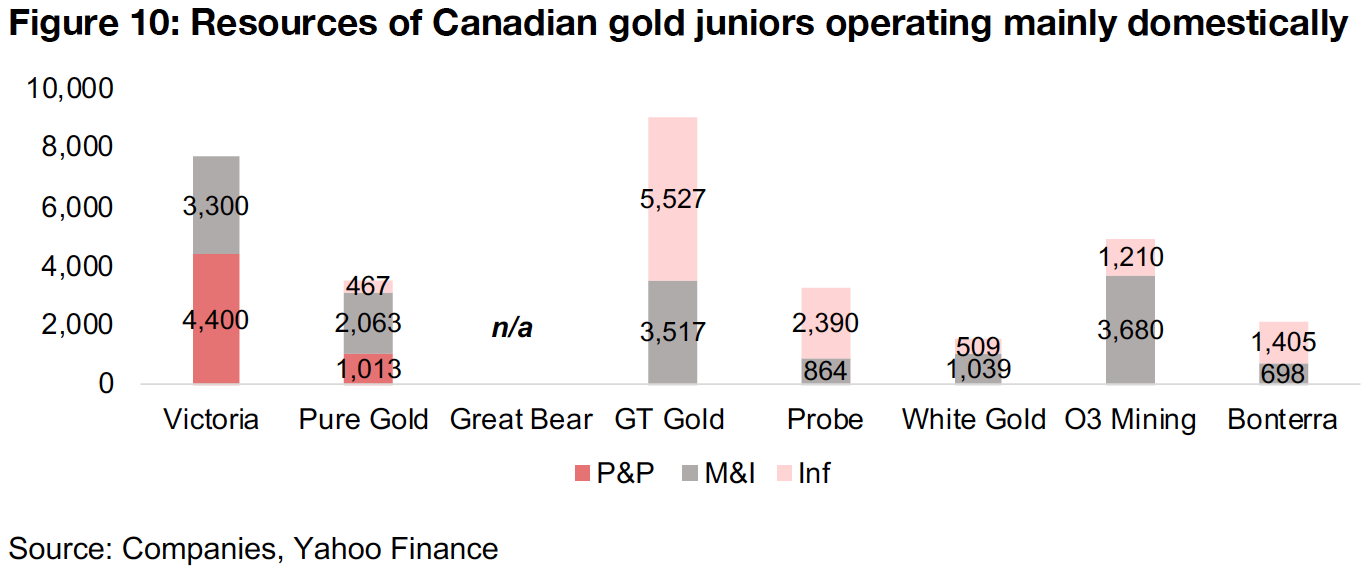
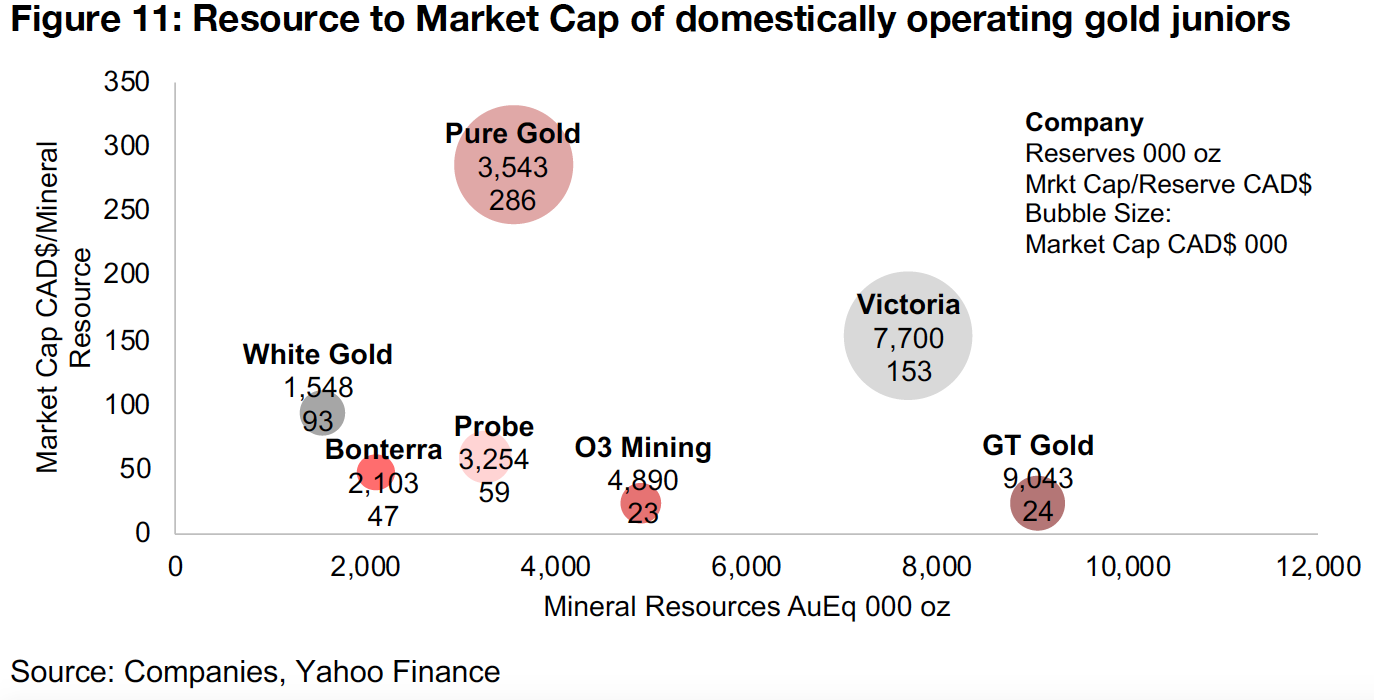
Victoria is the only miner of the group to have actually moved into production, with its Eagle mine starting production in January 2020, and its move into the realm of intermediate miners reflected in the highest market cap of the group, and the third best stock price performance of the peers this year, up 103%. It is the only company in the group with large Proved and Probable (P&P) Reserves, of 4.4mn oz, and has an additional 3.3mn oz in Measured and Indicated (M&I) Resources, with the market valuing the total resources at a high CAD$153/oz given that its risk has declined substantially as it has successfully reached production at a timely moment given the soaring gold price (Figures 10, 11).
The best and second best gains this year have come from two Canadian junior gold miners operating in Red Lake, Ontario. The best is Pure Gold, one of only two in the group to have reached the PEA stage, with first gold pour by the end of 2020. The company has an estimated 1.0mn in P&P Reserves and 2.5mn in M&I and Inferred Resources, which is priced by far the mostly highly of the group at CAD$286/oz, after a 222% jump in the share price. The second best is Great Bear Resources, up 111%, even though it has not released a maiden resource, but for which very encouraging drilling results have been released consistently this year, and at times in 2020 the stock was outpacing even Pure Gold.
GT Gold has performed well this year, having released its maiden resource for the Saddle North area of its Tatogga project in B.C.s Golden Triangle in July 2020, followed up by a 43-101 in August 2020. The company has the highest resources of the group, at 3.5mn M&I and 5.5mn Inferred, although the market may not be attributing significant value to the inferred resources, given its market cap/resource of just CAD$24/oz. While the stock has dropped after surging to a near 100% YTD gain after the release of the maiden resource, it is still up 57% for the year. Probe Metals has gained 22% this year, driven by a series of strong drilling from its Val-d'Or East property in Quebec's Abitibi Greenstone area, and has an estimated 0.9mn in M&I and 2.4mn in Inferred Resources, with the market paying CAD$59/oz. White Gold
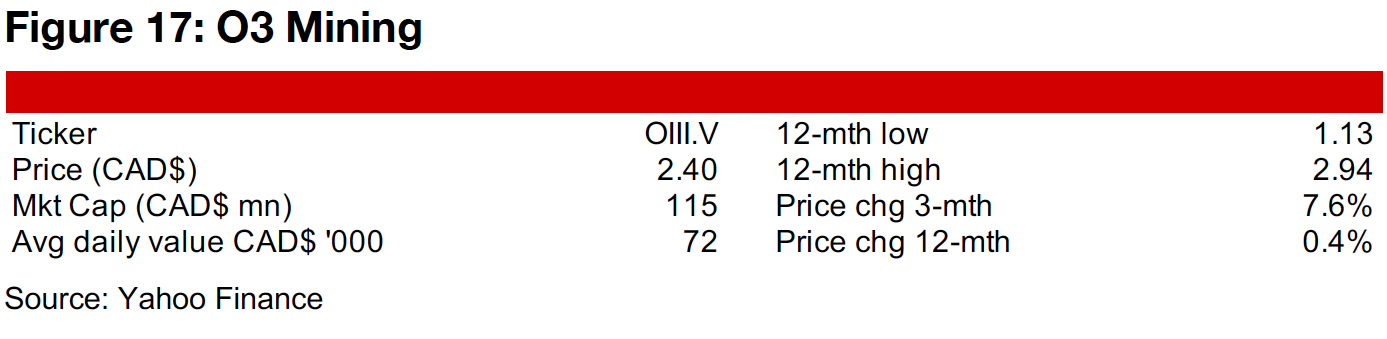
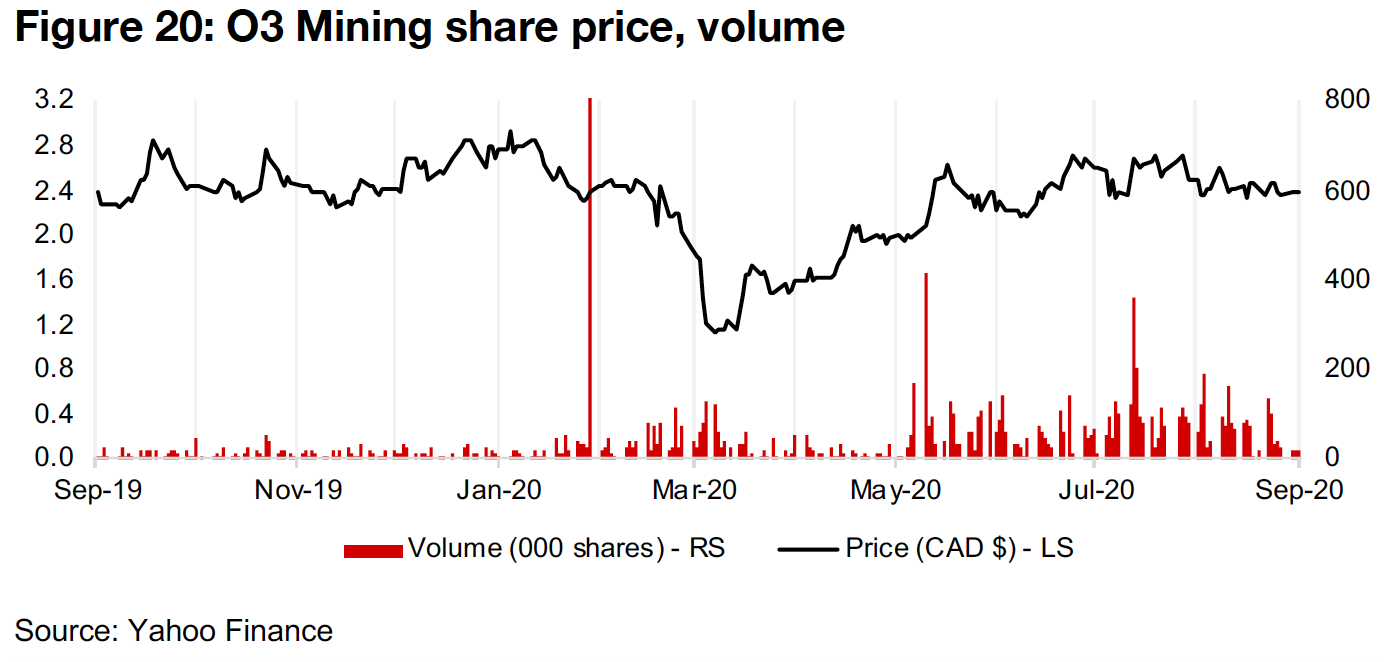
Some of the group have not participated much in the junior gold miner rally, including White Gold, which has been flat YTD, although its 1.0mn oz in M&I and 0.5mn in inferred resources are valued relatively highly by the market at CAD$93/oz. O3 Mining, an Osisko spin-off and operator of seven exploration projects at Val-d'Or, Quebec, with a combined 3.7mn in M&I and 1.2mn in Inferred resources, has dipped 16% this year, and is seeing a low valuation versus of the group of just CAD$23/ounce. Bonterra Resources also operates in the Abitibi region of Quebec, with 0.7mn in M&I and 1.4mn in Inferred Resources, and after falling 41% YTD, its Resources are valued at CAD$47/oz.
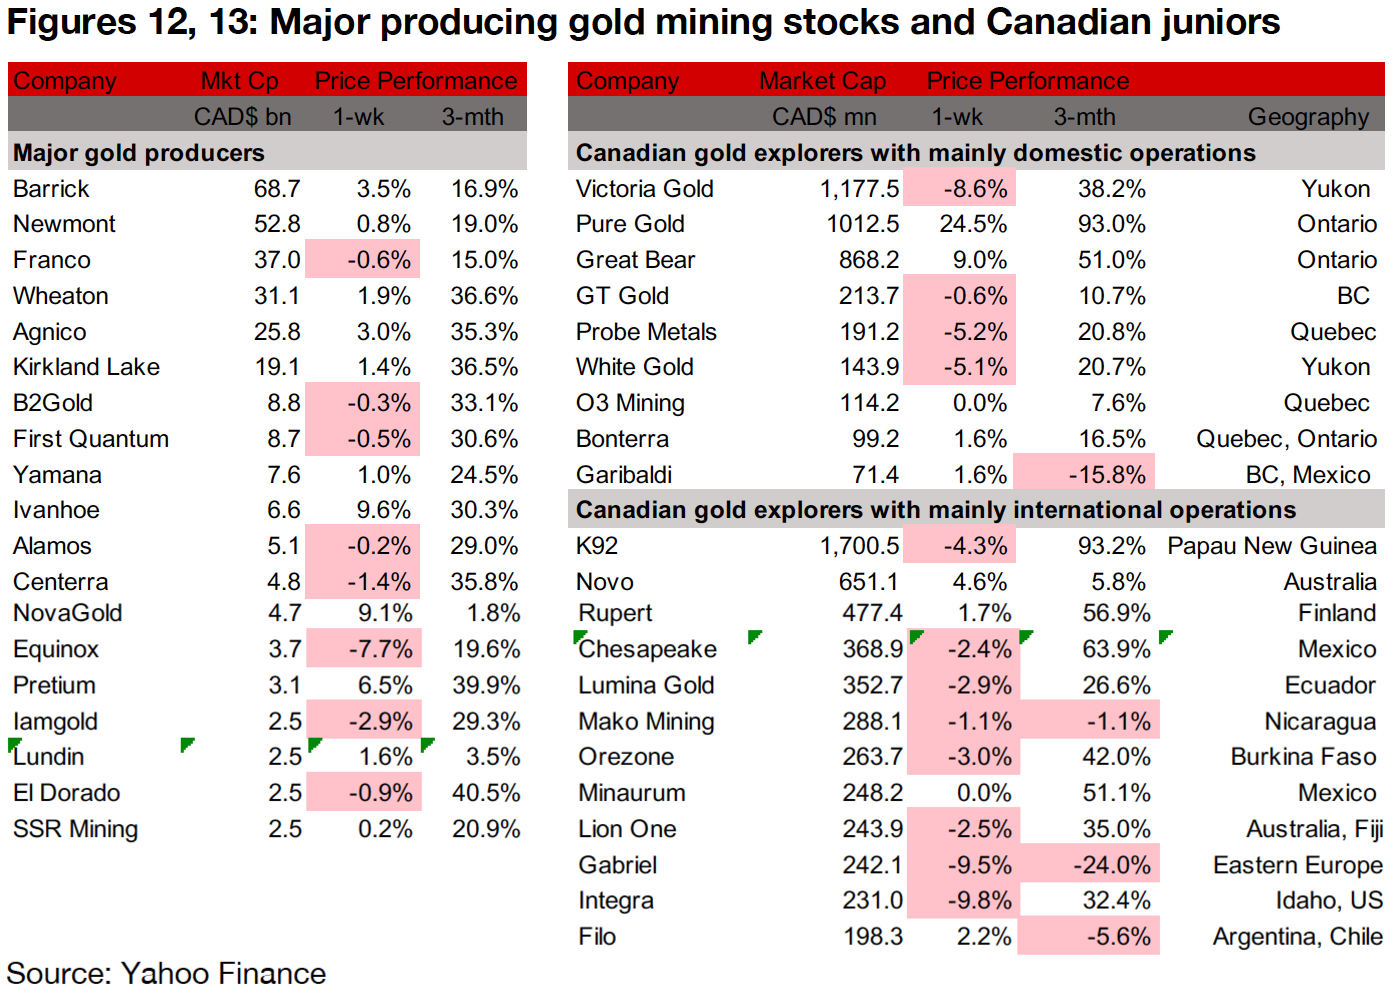
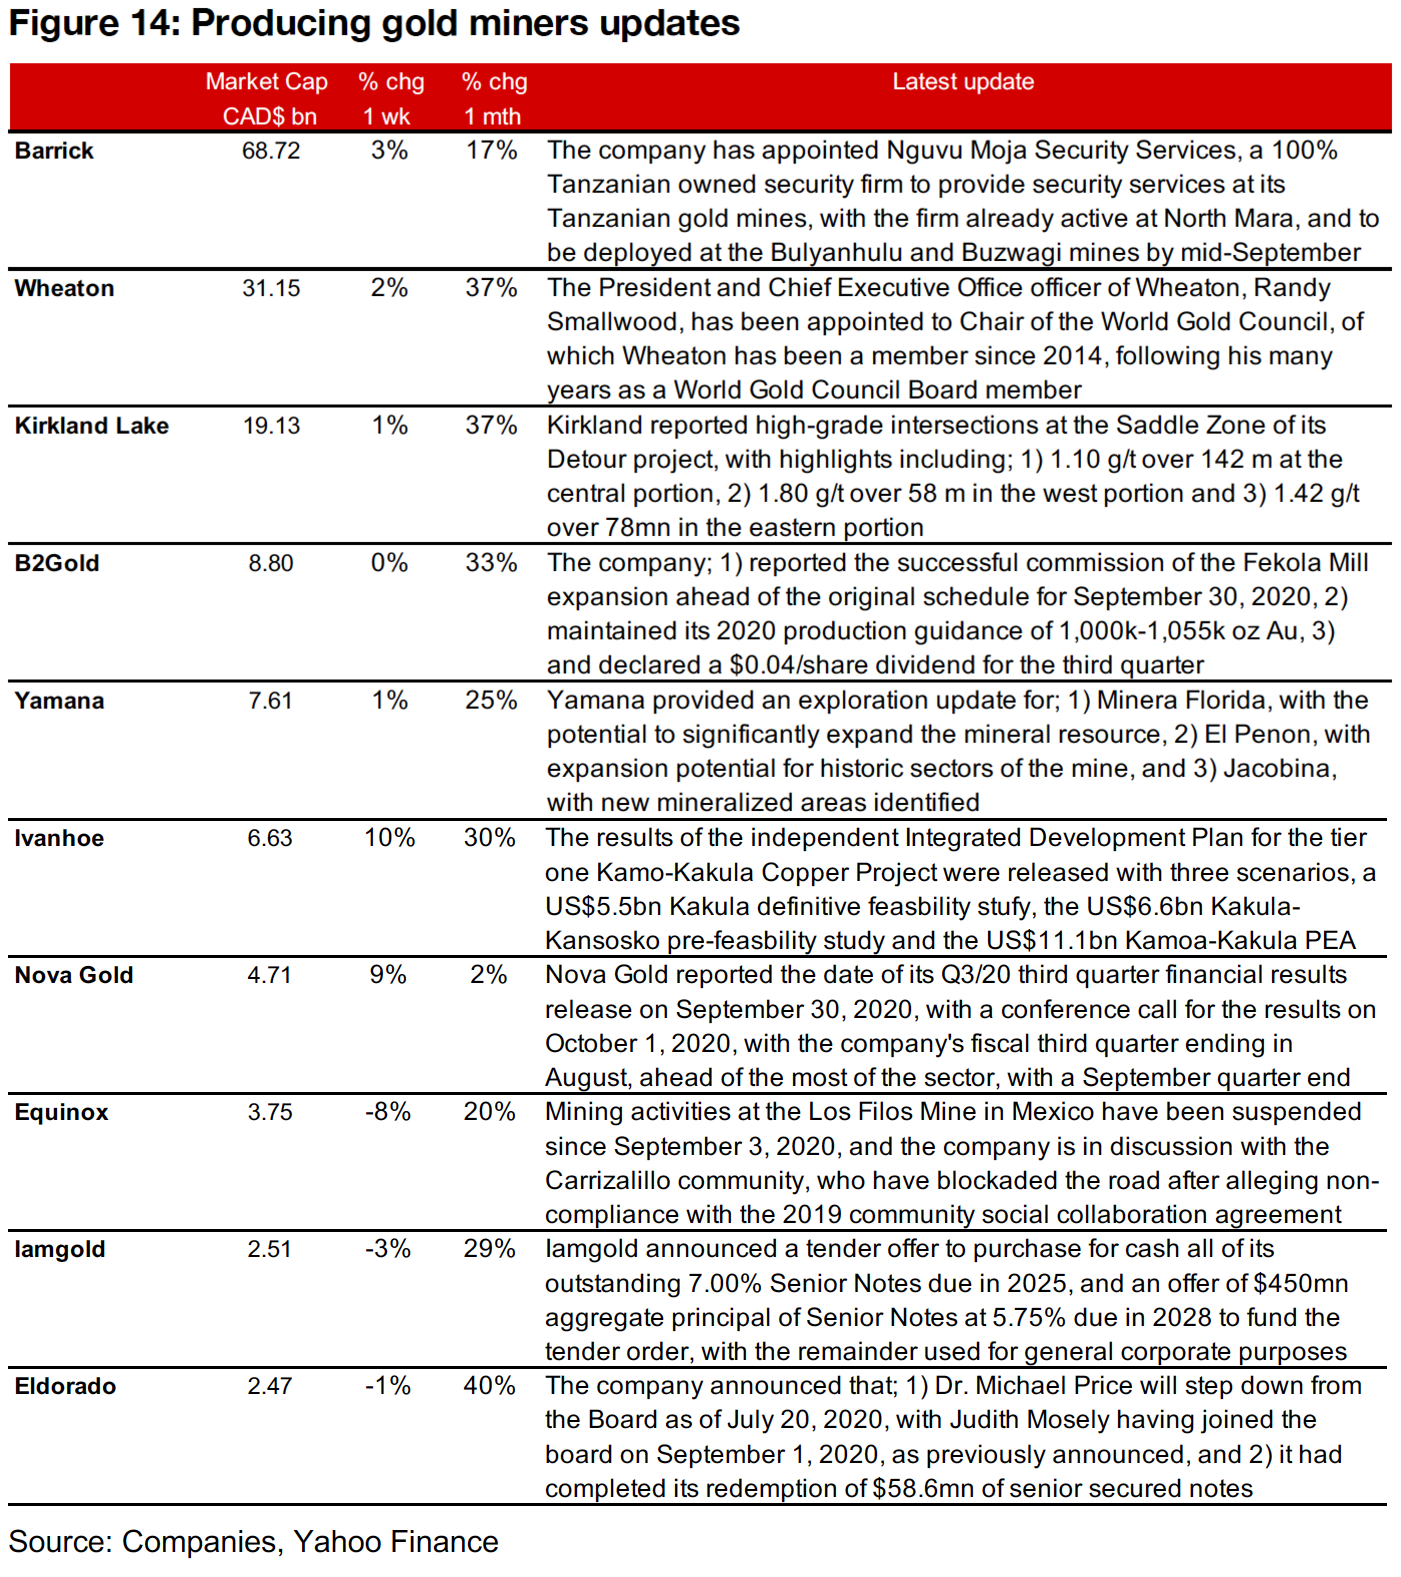
The producing gold mining stocks were mixed as gold ticked up, but still remained within its recent range (Figure 12). Barrick shifted from an international to a local security company in Tanzania and Wheaton announced that its President and CEO will become Chairman of the World Gold Council (Figure 14). Kirkland reported new high-grade intersections from exploration at its Detour project, B2Gold successfully commissioned the Fekola mine about a month ahead of schedule, maintained its production guidance, and announced a third quarter dividend, and Yamana provided an exploration update for Minera Florida, El Penon and Jacobina. Ivanhoe released the results of an independent Intergrated development plan for Kamo-Kakula, Nova Gold reported its Q3/20 results release date, and Equinox was down after a local community blocked the road as its Los Filo Mine, with the company in discussions to resolve the dispute. Iamgold announced a tender offer to purchase all of its 7.00% Senior notes due in 2025, and issued $450mn in Senior Notes at 5.75% due in 2028. El Dorado announced an exit from its Board, and completed its redemption of $58.6mn in senior secured notes.
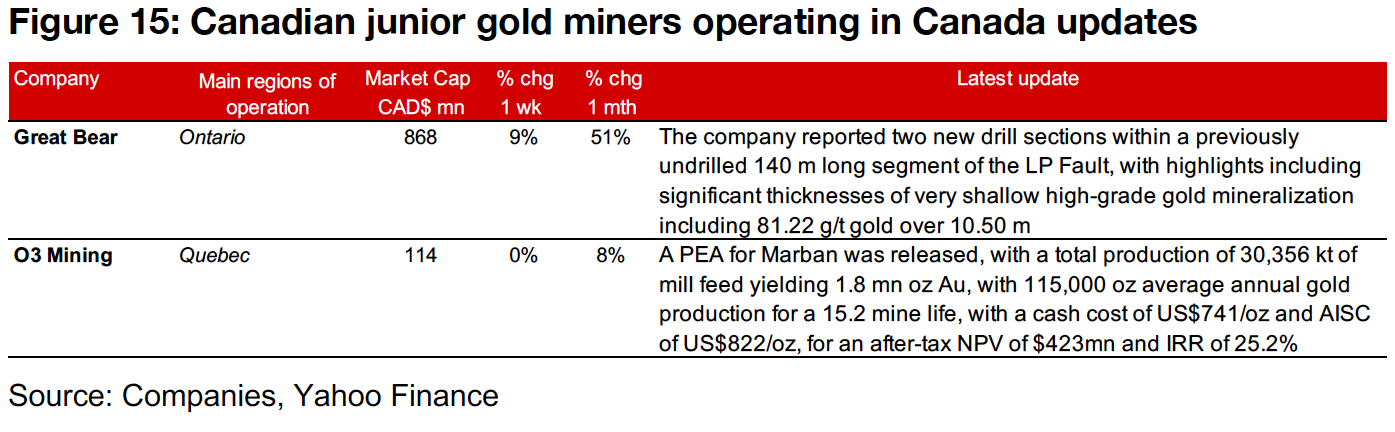
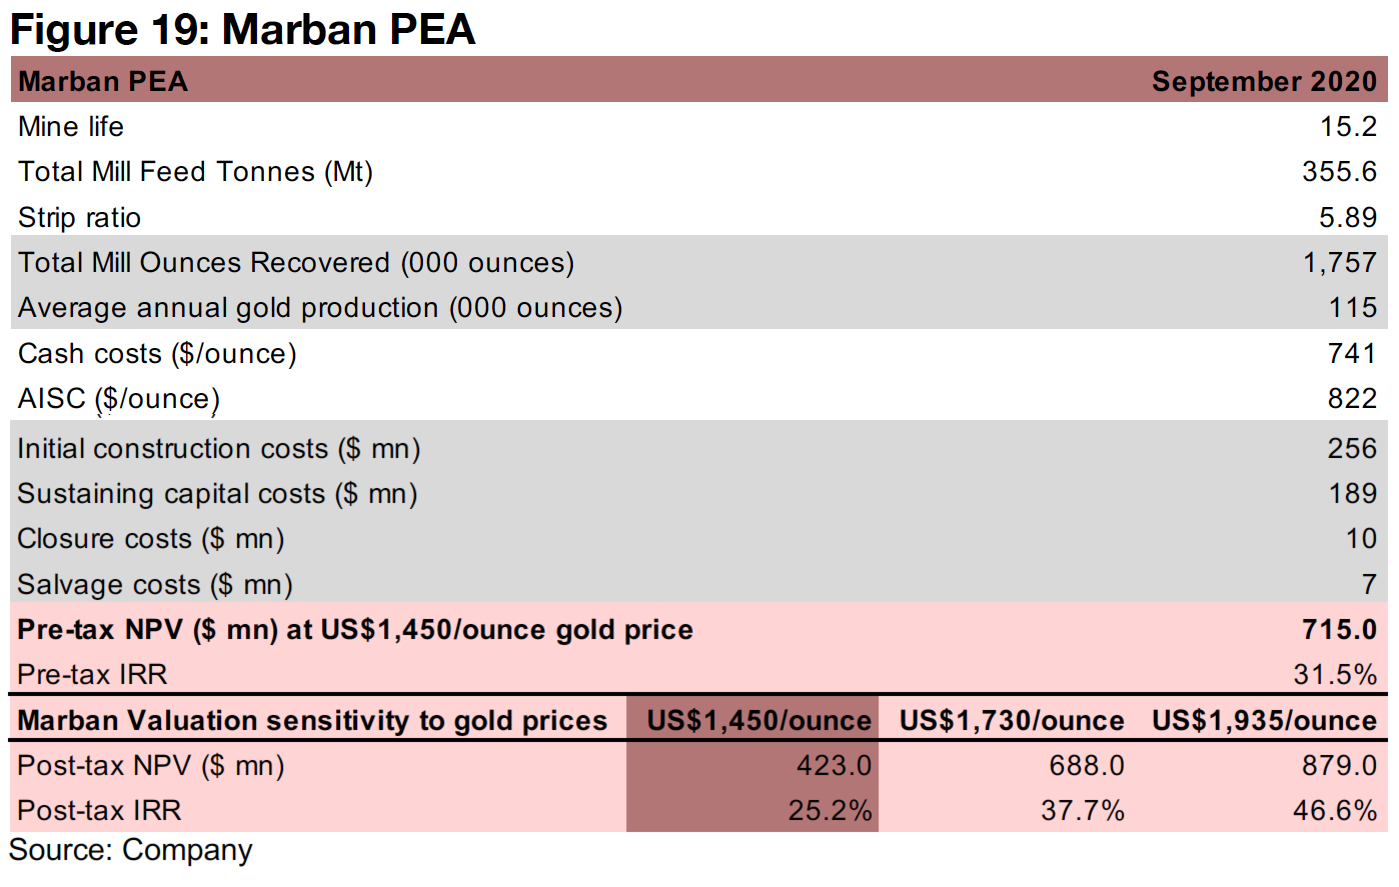
The Canadian juniors operating internationally were mixed this week (Figure 13). Great Bear Resources was up 9%, with the company reporting two new drill sections in a previously undrilled 140 m long segment of the LP Fault (Figure 15). O3 Mining, which is In Focus this week, was flat for the week, even as it made a major release, its PEA for its Marban project, with an after-tax NPV of $423mn using a gold price of US$1,450/oz and an NPV of $688mn at US$1,730/oz.
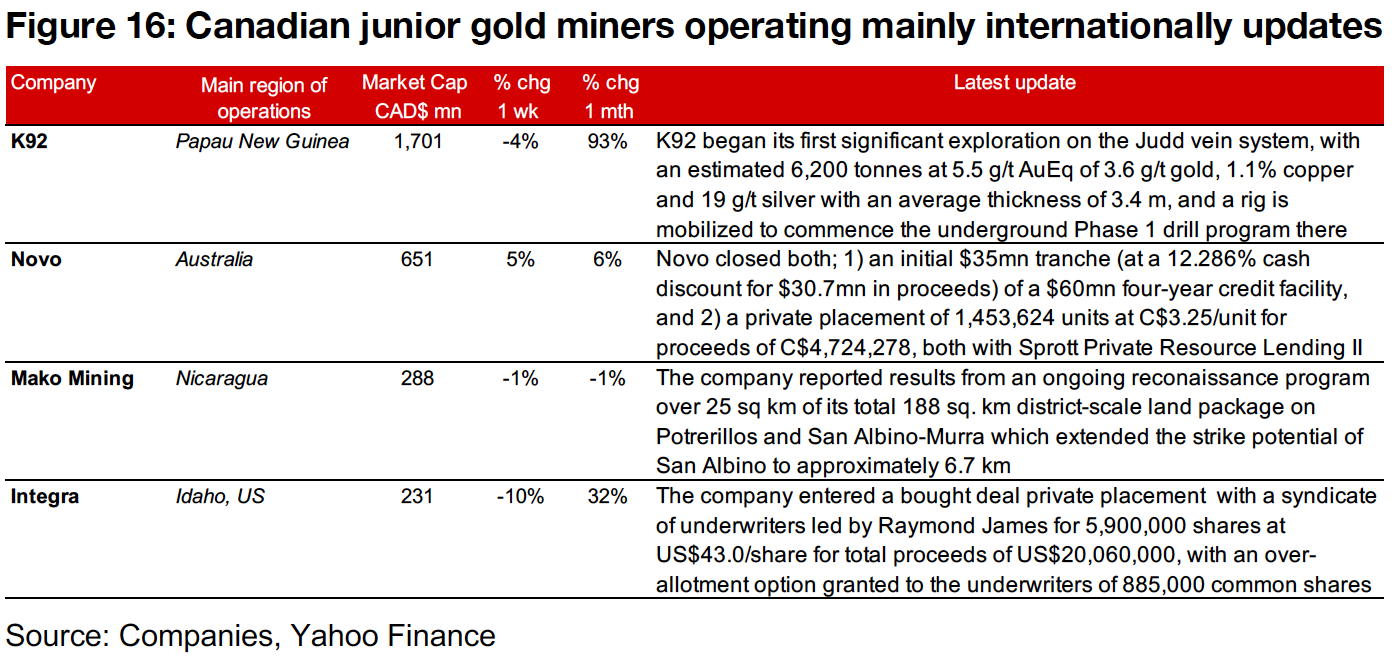
The Canadian juniors operating internationally mainly declined this week (Figure 13). K92 edged down -4% as it began its first significant exploration of a new vein system (Figure 16). Novo was up 5% after closing an initial $35mn tranche of a $60mn fouryear credit facility, and a private placement of C$4.7mn. Mako Mining slipped -1% after the company reported results from an ongoing reconnaissance program at the Potrerillos and San Albino-Murra zones. Integra slid -10% after the company reported that it entered a US$20.06mn bought deal private placement with a syndicate of underwriters.
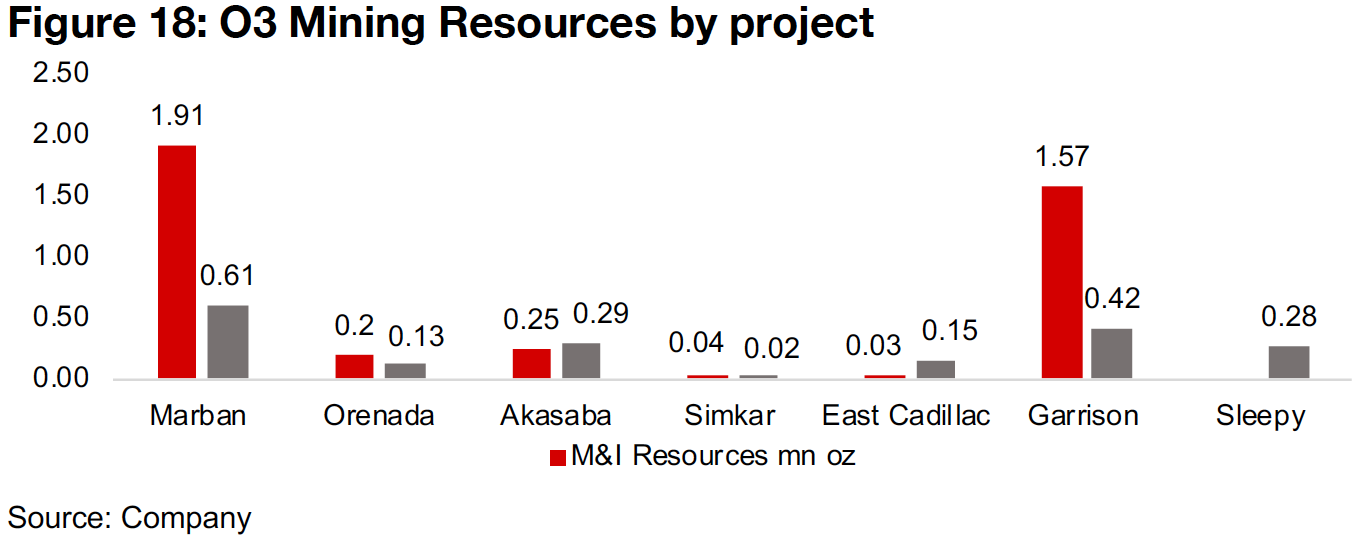
O3 Mining released a preliminary economic assessment on September 8, 2020 for its largest project, Marban, including an updated Resource estimate, with the Measured and Indicated Resources increasing to 1.91m oz Au from 1.50m oz previously, and Inferred Resources of 0.61mn oz Au, up from 0.20mn previously. O3 Mining has over fifteen projects, with most of the projects that have Resources reported concentrated in Quebec in Val-d'Or, including the Marban, Orenada, Akasaba, Simkar, East Cadillac and Sleepy, but also large Resources at Garrison in Ontario (Figure 18).
The PEA outlines a total 1,757k oz Au in recovered ounces, with an average 115k oz Au yearly over a 15.2 year mine life, with a cash cost of $741/oz and AISC of $822/ounce, and an initial capex of $256mn, sustaining capex of $189mn, $10mn closure costs and 7$ salvage costs. The PEA targets a post-tax NPV of $423mn at a base case US$1,450/ounce gold price, for an IRR of 31.5%, but with a gold price of US$1,730/oz, around the average YTD, a $688mn value with an IRR of 37.7%, and at the current price around US$1,935/oz, an $879mn value with an IRR of 46.6% (Figure 19). Even using the US$1,450/ounce gold price base case, the PEA value for Marban is about four times the level of the company's CAD$114mn market cap.
Disclaimer: This report is for informational use only and should not be used an alternative to the financial and legal advice of a qualified professional in business planning and investment. We do not represent that forecasts in this report will lead to a specific outcome or result, and are not liable in the event of any business action taken in whole or in part as a result of the contents of this report.
Author
Ben McGregor authors the Weekly Roundup at CanadianMiningReport.com, providing sharp analysis of the metals and mining sector. With a talent for spotting trends, Ben distills complex market shifts into clear, engaging insights on TSXV junior miners. His weekly updates cover gold, copper, uranium, and more, blending data-driven perspectives with a knack for identifying opportunities. A vital resource for investors, Ben’s work navigates the dynamic junior mining landscape with precision.