
June 12, 2023
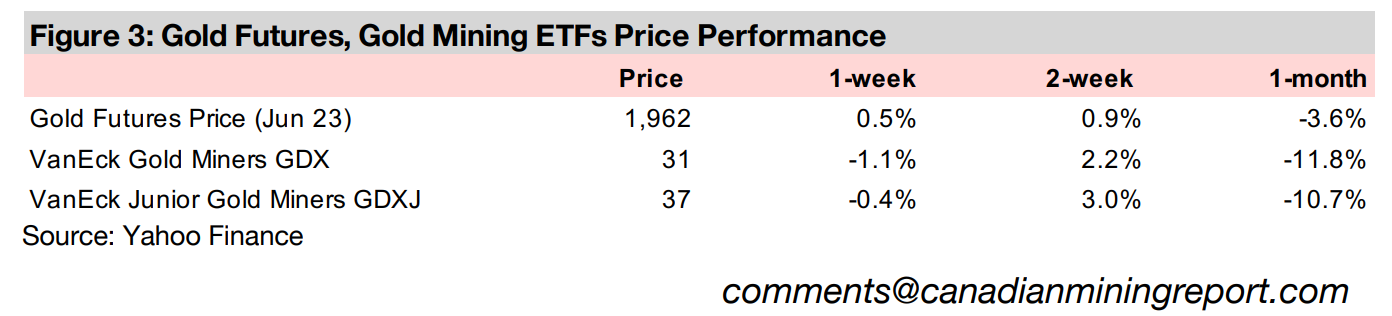
Gold rose 0.5% to US$1,962/oz, lingering below US$2,000/oz for a fourth week as the market awaits the US Fed rate decision and CPI inflation data, while US money supply growth has hit four-decade lows and central banks continue to buy gold.
This week we look at silver, after a jump in the price on a Newmont supply cut, with the metal's ratios versus gold and copper near mid-term averages, the market to remain in deficit in 2023 and the performance of TSXV silver stocks in 2023 muted.
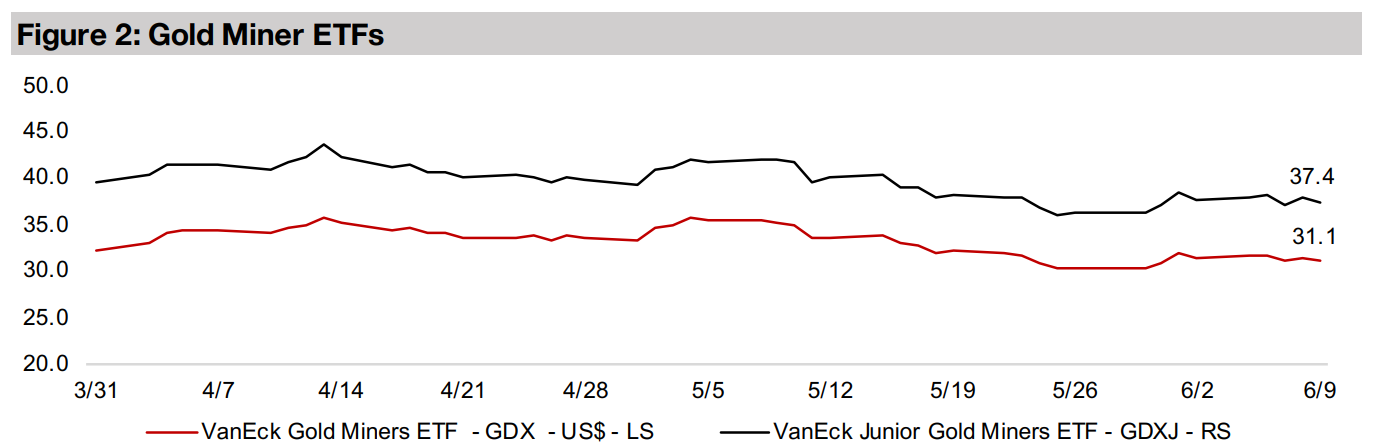
The gold producers and juniors declined even as gold rose, as small caps fell, with the Russell 2000 down even as the S&P 500 was near flat, with the GDX down -1.1% and the GDXJ falling -0.4%, although the TSXV gold juniors were mostly up.


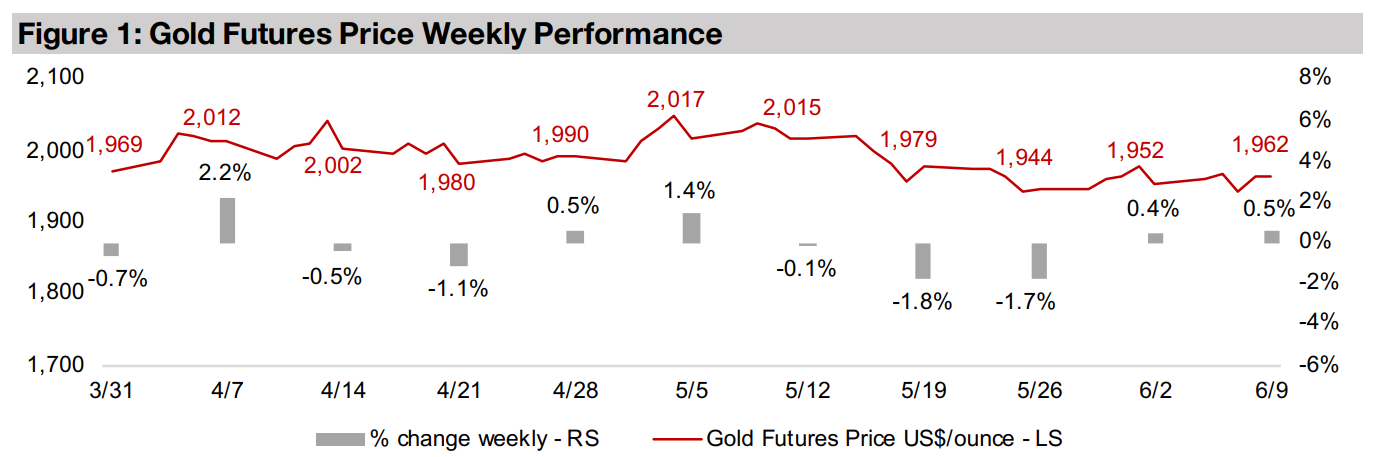
Gold was up 0.5% to US$1,962/oz, the second week of marginal gains, with the metal
hovering around the mid-US$1,950/oz level for the third week in a row. The larger
cap equity market was subdued and small caps fell in advance of a big week of data
coming up. Two of the most major announcements will include the US Fed's interest
rate decision, with market consensus looking for a pause in rate hikes, and US CPI
inflation, which is expected to be a key factor in the Fed rate hike decision.
However, with the most recent major central bank decision being a surprise 25 bps
increase by the Bank of Canada, which had previously paused rate hikes, markets
are still pricing in a reasonable probability of a surprise increase by the US Fed. The
potential effect on gold of a pause in US rate hikes remains mixed; the market could
take it to mean the start of easier monetary policy, and therefore be bullish for the
metal. However, it could also be seen as the Fed indicating that the inflation fight is
coming to an end, which could be negative for gold, which is an inflation hedge.
While equity markets having been trending up and gold has slipped below US$2,000 for about a month, we are not convinced that a stock bull market and stagnating gold will persist, especially with a global recession widely expected and liquidity in the US, as measured by the M3 Money Supply, continuing to contract. US M3 Money Supply growth plunged to -4.1% in March 2023, by far its lowest level in over four decades, a period which saw no money supply contraction at all until December 2022, with the lowest growth previously at 0.2% in March 1993 (Figure 4).
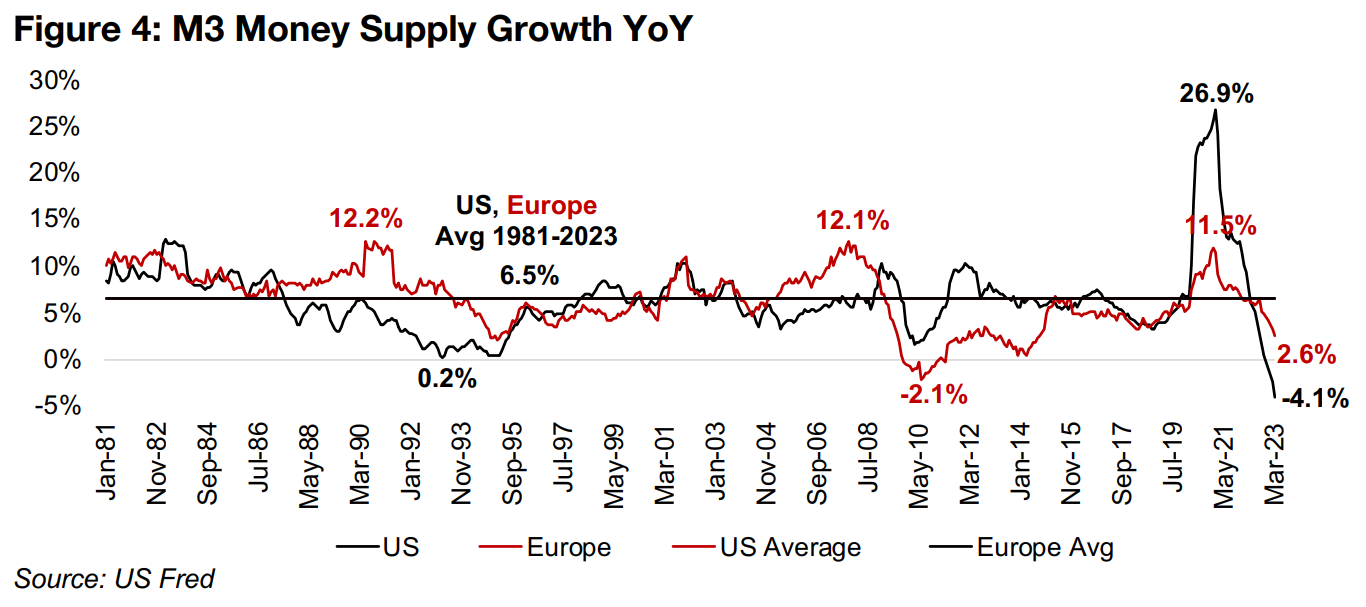
This is clearly a massive negative shift in liquidity, which is the lifeblood of the economy and stock markets, and makes the recent jump in equity markets appear quite lacking in underlying fundamental support. While Europe's M3 Money Supply growth was still expanding at a moderate 2.6% as of March 2023, the rate is declining, and could be heading for the first contraction in over decade, with M3 growth hitting a low of -2.1% in June 2010. The growth rates for both the US and the EU are considerably below their long-term averages, at 6.5% for both, from 1981-2023.
If a global recession and equity market contraction do occur this year, we expect that
the market could once again rush into gold, given the propensity it has already shown
to do this so far this year. For the gold stocks, it then becomes an issue of whether
flight to safety gains in the underlying metal offset the overall downward pressure on
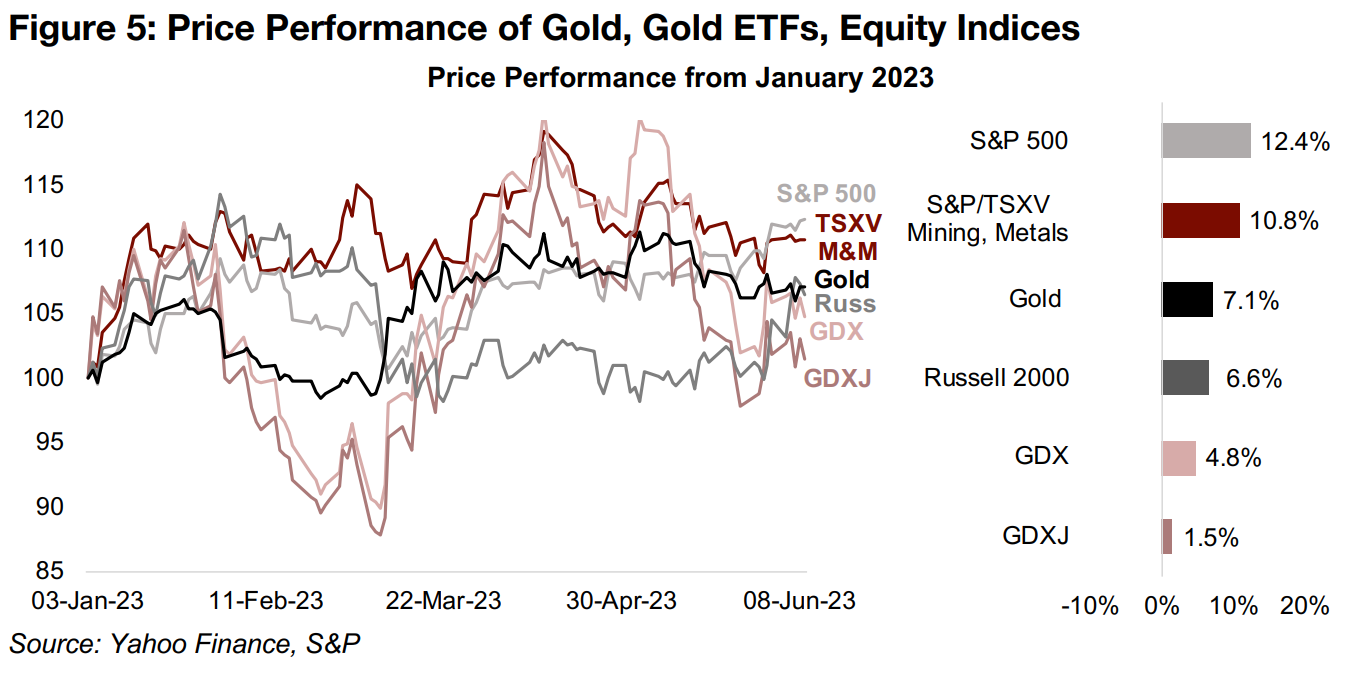
stocks that could arise. More recently, a 'risk on' shift in markets has seen the
markets pullback from gold stocks, with the GDX ETF of gold producers up just 4.8%,
the GDXJ ETF of gold juniors rising just 1.5% since January 2023, off nearly 20%
gains as recently as mid-April (Figure 5).
However, this rally has reached small caps only recently, with the Russell 2000 index
up only 6.6% after weakening for most of the year, with the gains concentrated mainly
in a few megacaps in the S&P 500, which is up 12.4% for the year. We might have
expected more from the gold stocks on the 7.1% rise in gold, given their leverage to
the metal price, but it seems that, especially for the gold juniors, that a broader
aversion to small call caps remains even amidst the recent large cap bull market.
Interestingly, the S&P/TSXV Metals and Mining Index has gained 10.8%, but this is
especially because of gains in a few very large cap lithium stocks with high weightings
in the index.
Nonetheless, it is interesting that gold has held up even as the markets are taking on some risk, suggesting that they are not quite as brave as the S&P 500 gains might suggest and still hedging their bets. We expect that it would not take much negative news for the markets to reverse course, and that a flight to safety could again arise this year. This in contrast to many major investment banks that have recently been increasing their targets for the S&P 500 index this year and looking for an average gold price of US$1,800/oz. We believe this estimate looks low, especially given that gold has already averaged US$1,934/oz so far in 2023 and the year is nearly half over. The consensus figure implies a very weak second half for gold, which in turn implies a pretty severe reduction in risk, which we believe is unlikely this year.
While the main drivers of gold will likely continue to be broader monetary and economic and political risk factors, the underlying direct demand for the metal, as reported by the World Gold Council (WGC), can also have some effect on its price. The most recently reported data include monthly central bank purchases of gold, which have slowed considerably in March 2023 and April 2023. This comes after a very strong first two months of the year, which had continued a trend of aggressive central bank buying through much of last year (Figure 6).
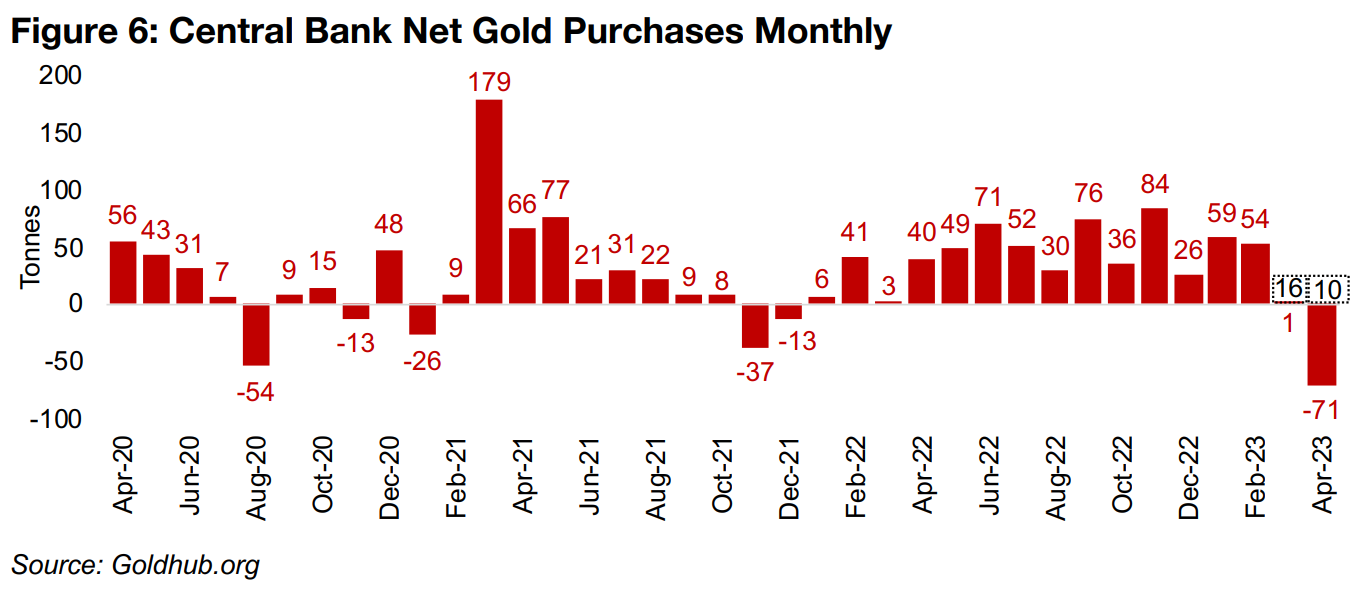
The headline numbers for central bank demand over the past two months slowed to just a one tonne net purchase in March 2023 and a net selloff of -71 tonnes in April 2023. However, much of this was from the Turkish central bank which was not selling its gold to other countries, but rather within its own country, in efforts to curb ongoing monetary difficulties there. Excluding Turkey, there still would have been net purchases of 16 tonnes in March 2023 and 10 tonnes in April 2023, which although being the two lowest months for net purchases over the past twelve months, still shows central banks overall adding to their gold holdings.
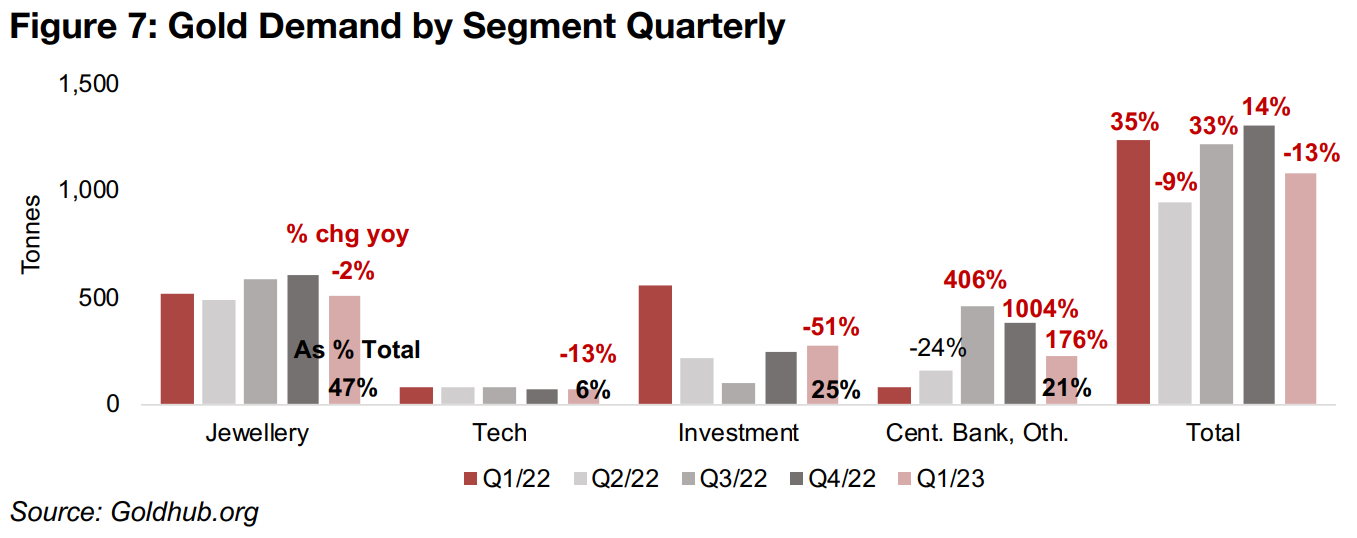
Central bank demand has been by far the fastest growing of the four major factors of
underlying gold demand reported by the WGC, outpacing jewellery, tech and
investment demand. It jumped 176% yoy in Q1/23, comprising 21% of total demand,
and while extremely high, still pales compared to a 406% and 1004% surge in Q3/22
and Q4/22, respectively (Figure 7). The strength in this factor has been offset by a -
2% decline in jewellery demand, which comprised 47% of total demand, a -51%
plunge in investment demand to 25% of the total, and a -13% decline in tech, which
contributes just 6.0% of the total. This led to a -13% overall contraction in gold
demand, down from growth of 14% in Q4/22 and 33% in Q3/22.
Most gold demand remains monetary driven, in contrast to base metals, which are
driven mainly by underlying industrial supply and demand. While central bank and
investment demand for gold are clearly monetary, to some degree jewellery could
also be considered monetary as the majority of this buying is from China and India,
with much of it likely used a store of value. Other major monetary drivers for gold
include the ratio of gold to the money supply, the strength of the US$, given that gold
is priced in the currency, real bonds yields, which determine the attractiveness of
holding bonds versus gold, and general economic and political risks.
On balance we see these factors as supporting the gold price this year, certainly at least well above the US$1,800/oz consensus estimate. While a recession could hit consumer demand, and therefore gold jewellery purchases, it could also drive up jewellery buying in a flight to safety, which could also propel investment and central bank demand. A weakening global economy could also prompt global central banks to start to loosen monetary policy, especially if employment cools, which could reduce real bond yields, making gold more attractive. The strength of the dollar is more of a wild card, depending on which economies shift interest rates the most. Geopolitical risks could certainly also abruptly spike in gold's favour.
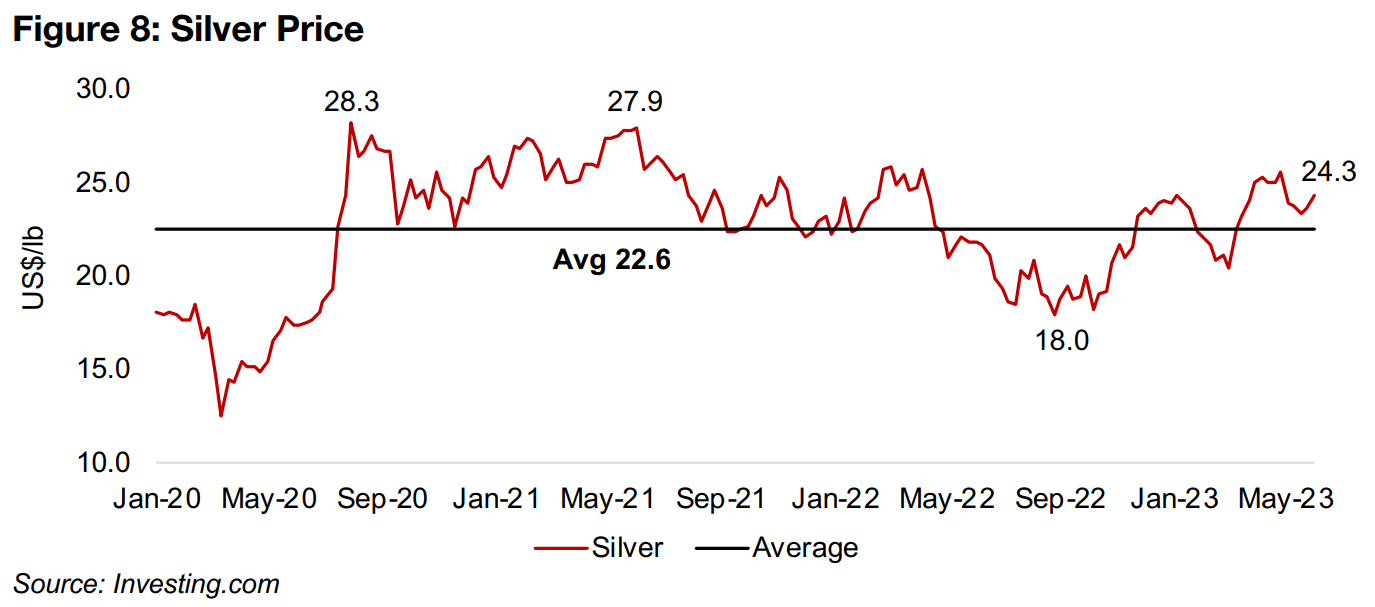
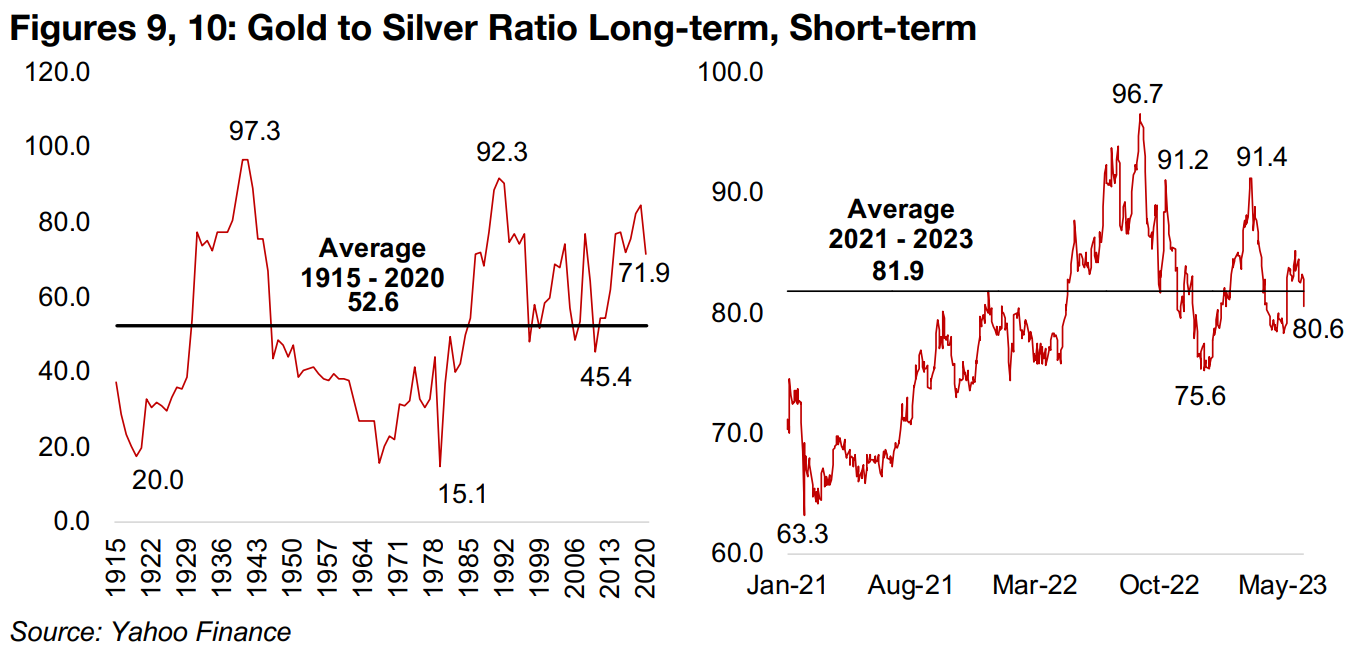
While gold's gains have been limited recently, silver jumped 2.0% this week to US$24.3/oz, and is now considerably above its average since 2020 of US$22.6/oz (Figure 8). This was driven by supply issues from Newmont, as it stopped operations at its Penasquito mine in Mexico after a strike was announced by the country's Mine and Metal Workers Union, demanding an increase in profit sharing to 20% from 10%. With the metal driven by a combination of the monetary drivers that have the dominant effect on gold and the more industrial drivers that affect the copper price, the gold to silver and gold to copper ratios can provide insight into where the market is seeing fair relative pricing between the three.
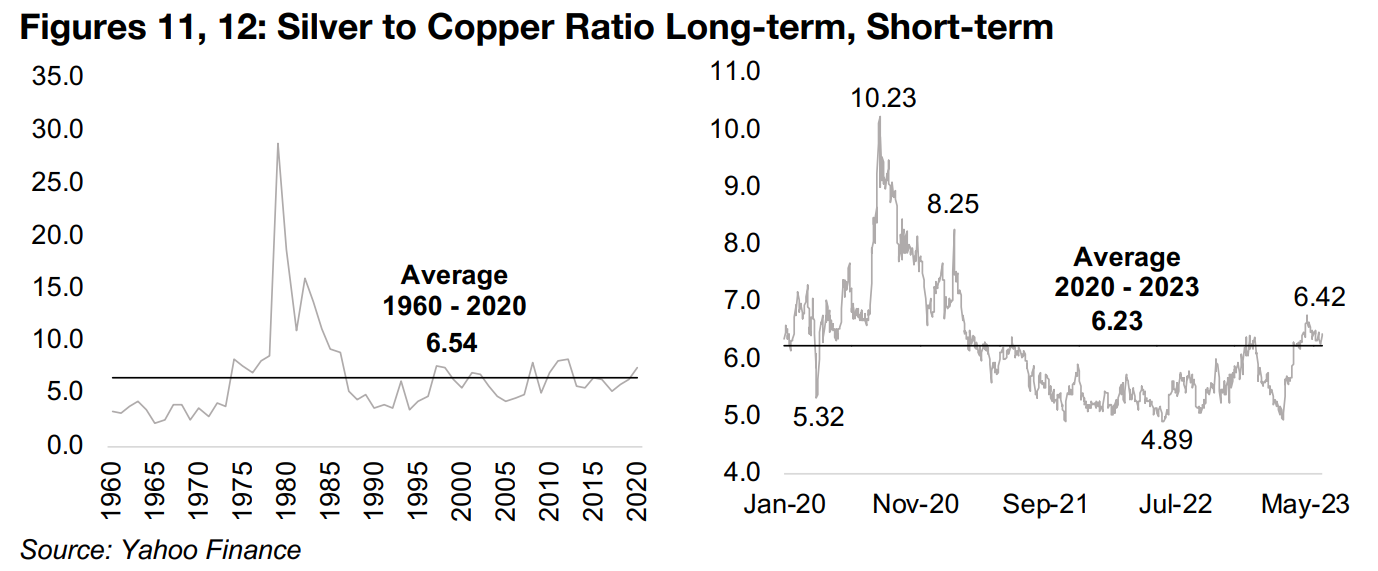
The gold to silver ratio, at 80.6x, has moved just below its average from 2021 of 81.9x, suggesting that the market sees the relative values of the two metals as reasonable. However, looking at the very long-term average for the ratio of 52.6x from 1915-2020, indicates some room for a rise in silver relative to gold over the long-term (Figures 9, 10). The silver to copper ratio, at 6.42x, has also come inline with its average of 6.23x since 2020, and is just below its average from 1960 of 6.54x, which suggests that there is not severe relative mispricing between these two assets currently (Figures 11, 12). Taking these two ratios together, it appears that at least in terms of medium-term averages the market is seeing silver pricing as relatively balanced versus both gold and silver.
While we expect gold to be supported this year by an eventual return to 'risk off', the
outlook for silver is a bit less clear. It could also gain on risk and monetary factors, as
we have seen in the rebound since March 2023, but it also has much larger exposure
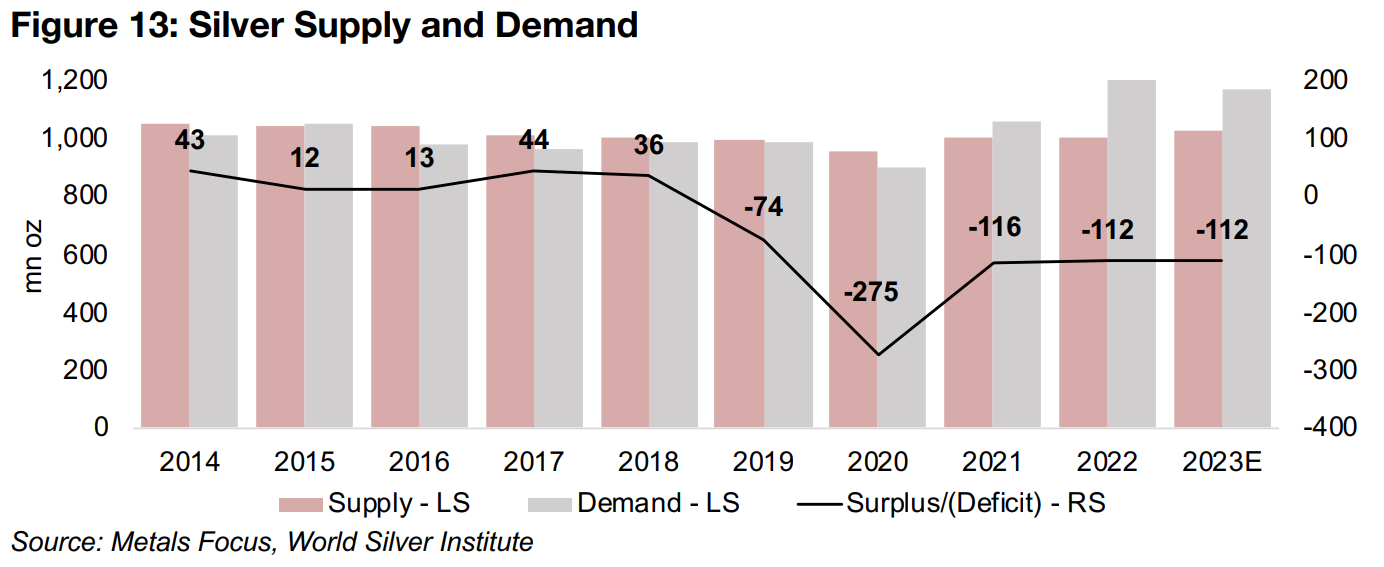
to industrial factors than gold, and these remain a risk if a recession erupts. To the
upside, the World Silver Institute expects that the market will remain in a major deficit
in 2023E, the fifth year in row, at -112 mn oz, equivalent to 2022 (Figure 13).
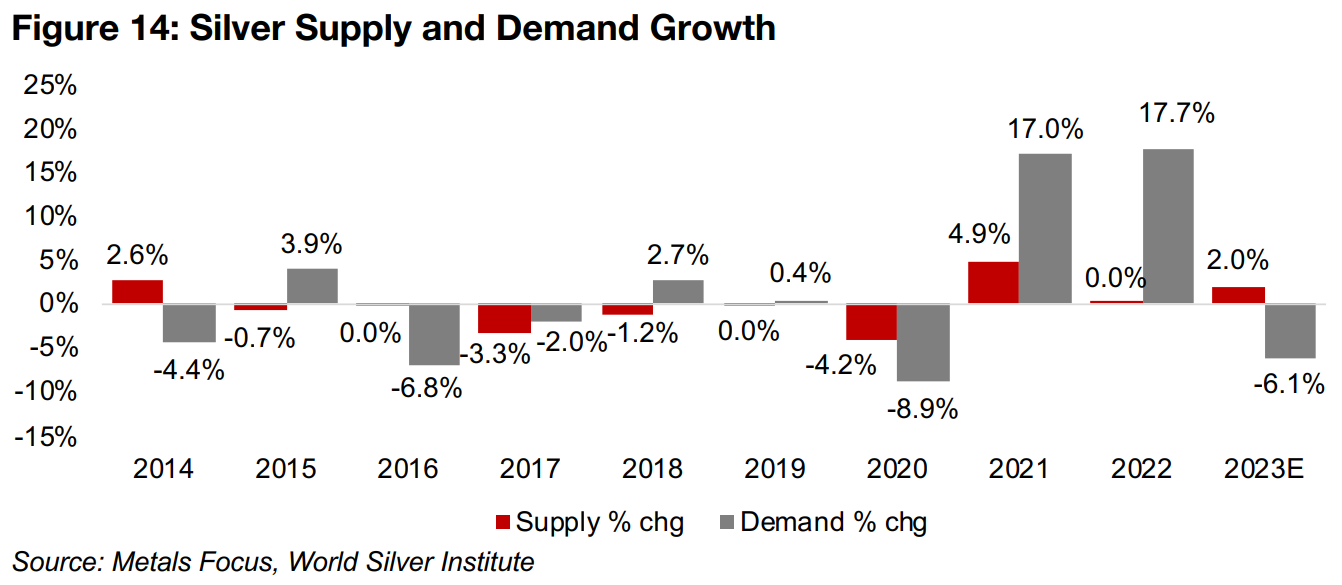
The deficits in 2021 and 2022 were driven by surges in demand of 17.0% and 17.7%
respectively, outpacing supply growth of just 4.9% and 0.0% (Figure 14). However,
in 2023, demand is expected to contract -6.1%, while supply grows 2.0%, although
these forecasts do need to be adjusted for the news of the supply decline from
Newmont which was only recently announced.
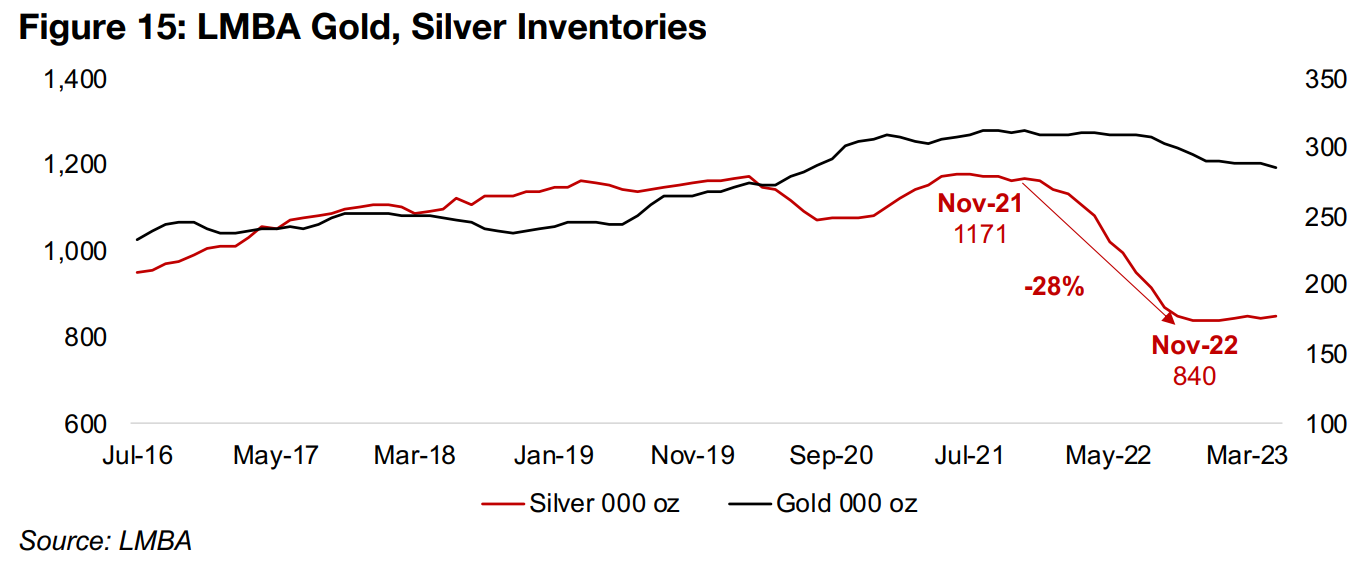
The deficit had led to a rapid depletion of silver inventories which accelerated especially from November 2021 to November 2022, with silver inventories declining by 28%, while gold inventories remained relative flat over the period (Figure 15). However, this decline had ended by December 2022, and LBMA silver inventories have been roughly flat since, while gold inventories have been in a slight downtrend.
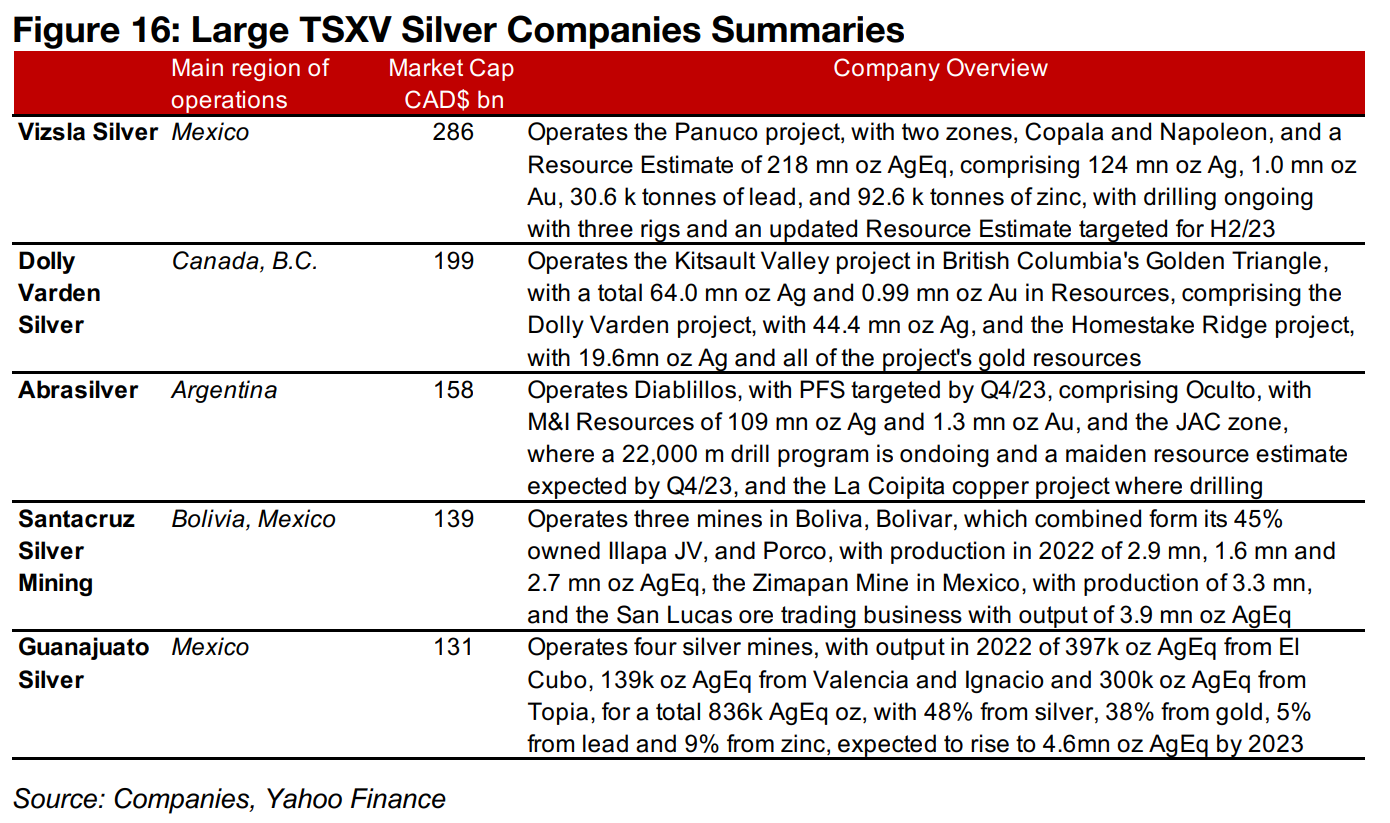
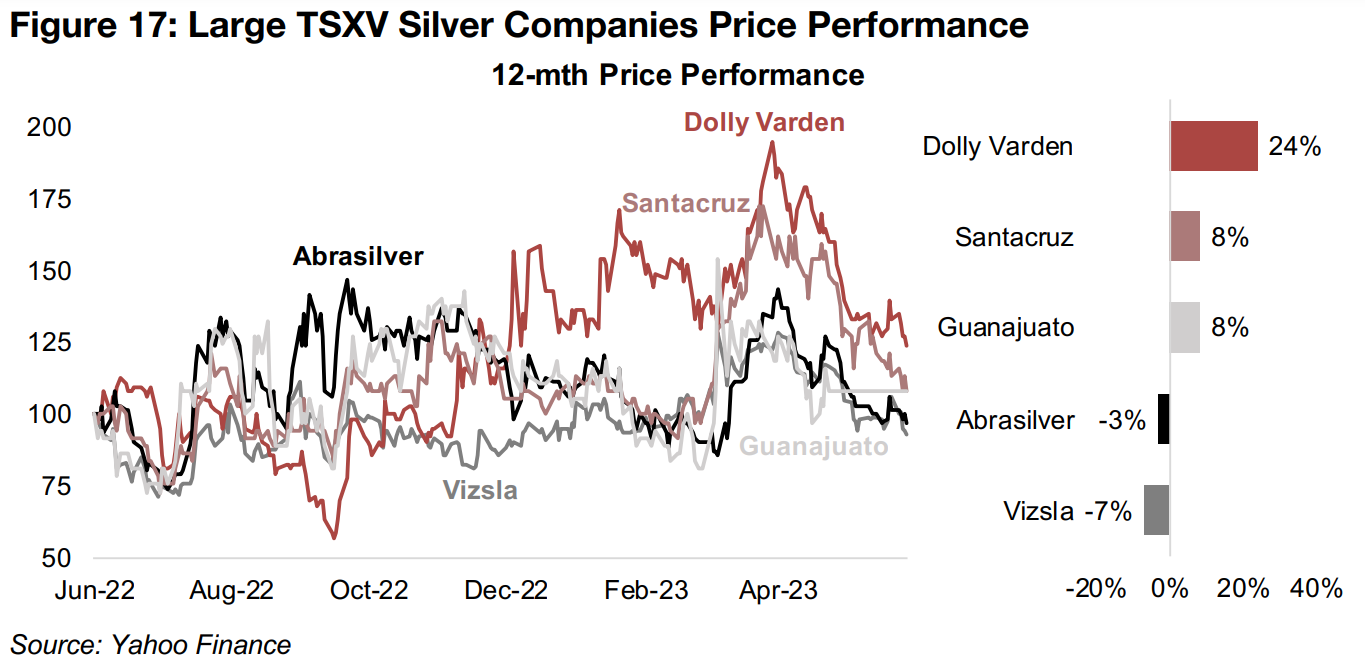
The relatively flat gains in the silver price so far this year have truncated the share price movements for the larger TSXV silver stocks overall (Figure 16). Only Dolly Varden, operating the Kitsault Valley and Homestake Ridge projects in British Columbia, Canada, has seen substantial gains, up 24% since January 2023 on strong drill results from both projects (Figure 17). Santacruz Silver Mining and Guanajuato Silver, both operating several producing silver mines in Bolivia and Mexico, have each risen 8% this year. This seems similar to a trend we are seeing in the TSXV gold sector where more producers are starting to move towards to the top of the market cap rankings as investors become more risk averse, the recent 'risk on' shift of the past month notwithstanding. The downside for declining TSXV silver companies has also been marginal; Abrasilver, operating the Diablillos project in Argentina is near flat for the year, down just -3%, while even the worst performer, and largest by market cap, Vizsla, operating the Panuco project in Mexico, is down just -8% so far in 2023.
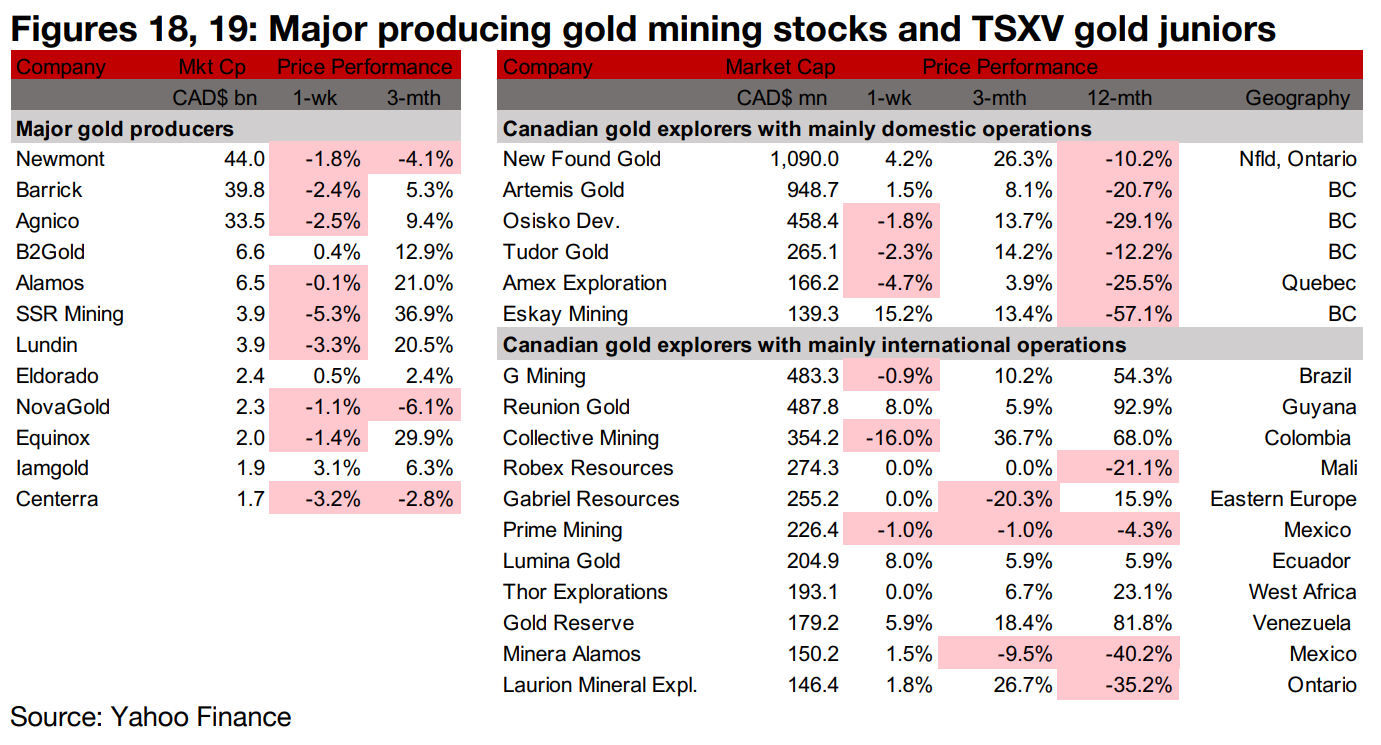
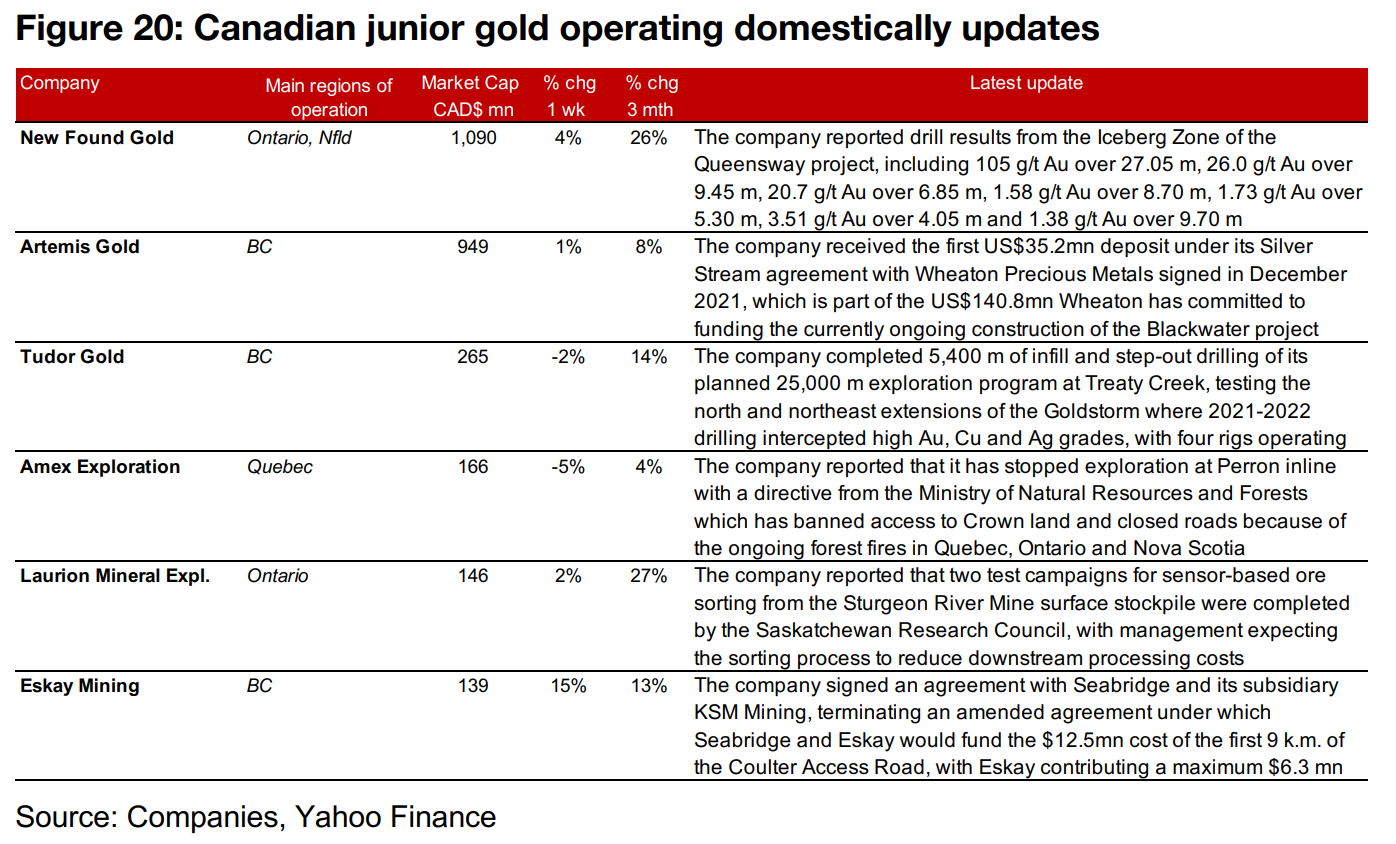
The gold producers mostly declined but the large TSXV gold were mainly up as the gold price rose and equity markets were near flat (Figures 18, 19). There was major news only from the TSXV gold companies operating domestically, with New Found Gold reporting drill results from the Iceberg Zone of Queensway and Artemis Gold receiving the first US$35.2mn deposit under its Silver Stream agreement with Wheaton. Tudor Gold provided an update on its ongoing exploration program at Treaty Creek, Amex stopped exploration at Perron because of forest fires and Laurion Mineral Exploration reported the completion of two sensor-based ore sorting test campaigns for the Sturgeon River Mine surface stockpile (Figure 20).
Disclaimer: This report is for informational use only and should not be used an alternative to the financial and legal advice of a qualified professional in business planning and investment. We do not represent that forecasts in this report will lead to a specific outcome or result, and are not liable in the event of any business action taken in whole or in part as a result of the contents of this report.
Author
Ben McGregor authors the Weekly Roundup at CanadianMiningReport.com, providing sharp analysis of the metals and mining sector. With a talent for spotting trends, Ben distills complex market shifts into clear, engaging insights on TSXV junior miners. His weekly updates cover gold, copper, uranium, and more, blending data-driven perspectives with a knack for identifying opportunities. A vital resource for investors, Ben’s work navigates the dynamic junior mining landscape with precision.