March 30, 2026
Gold declined -1.7% to US$4,492/oz, a relatively muted move after the historic -9.5% slump last week, one of its worst in twenty years, as the market seems to have largely priced in the oil shock and potential for rising rates if inflation picks up.
While the recent mining sector slump has hit speculators that entered the market mainly in late 2025 or early 2026, investors that took positions in most of the metals or mining ETFs even as recently as September 2025 have still made substantial gains.
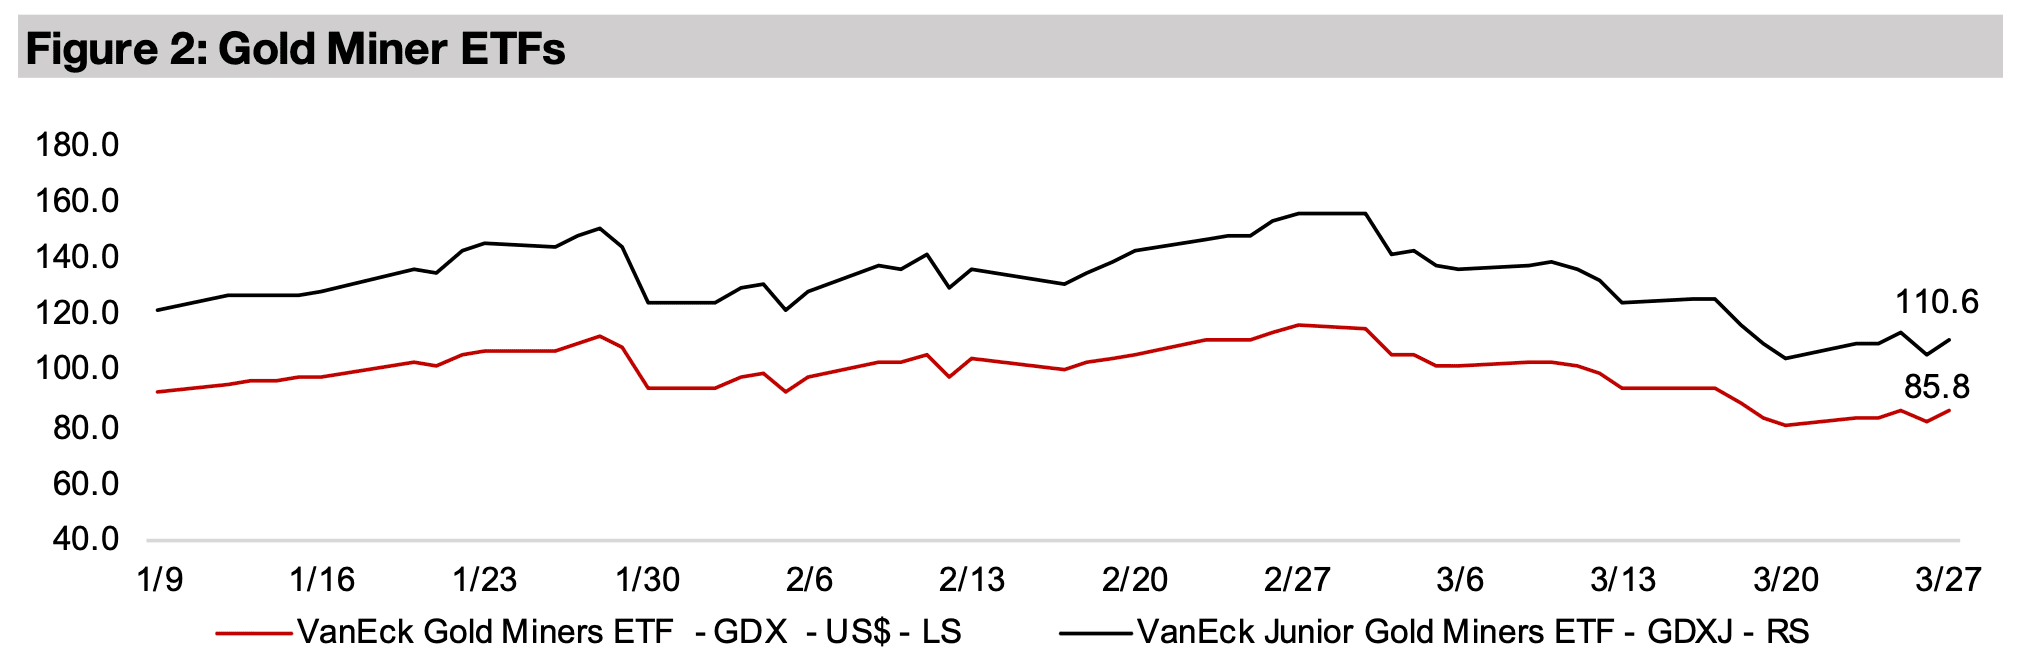
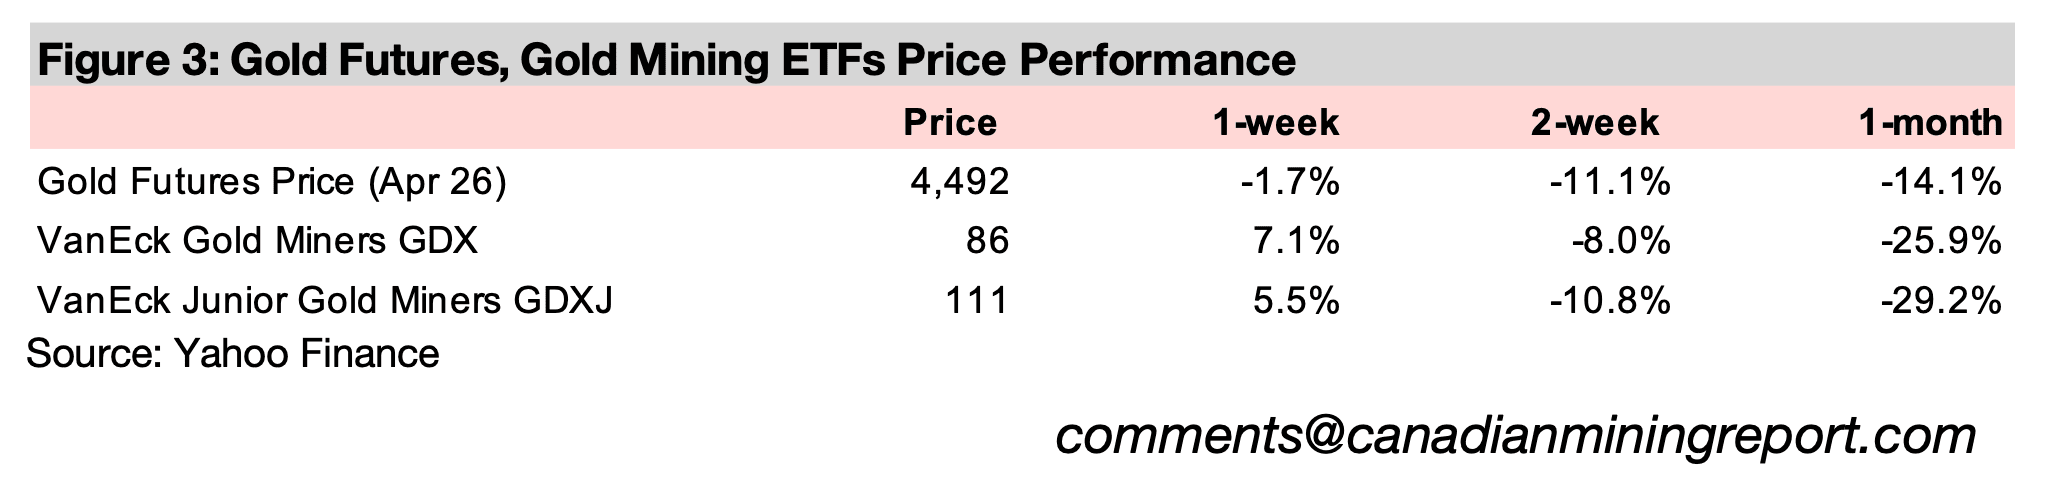
The gold stocks rebounded even as the metal declined, with the GDX up 7.1% and GDXJ gaining 5.5%, recovering from over 30% slumps in the previous three weeks and outperforming the drop in equity markets with the S&P down -3.3%.


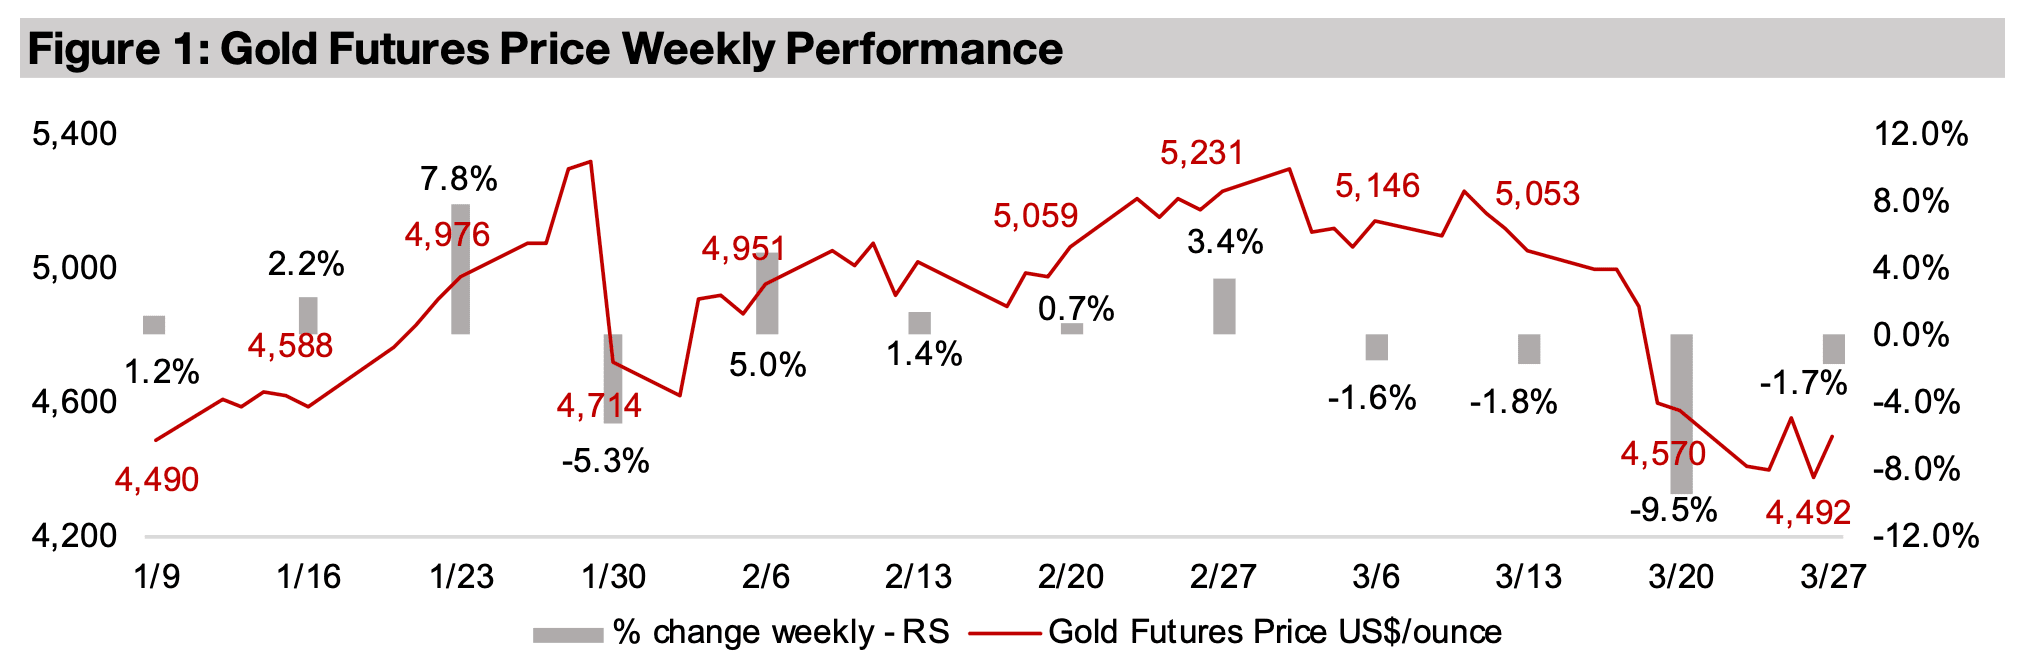
The gold price was down -1.7% to US$4,492/oz, after the previous week was one of
its worst in decades, with a -9.5% decline. The silver price was flat, platinum and
palladium rebounded 4.4% and 1.9%, and the base metals recovered, with copper
rising 2.3%, aluminum up 2.5% and iron ore flat. The equity markets continued to
decline, with the S&P 500 down -3.3% and Nasdaq off -4.8%, outperformed by the
gold stocks, with the GDX up 7.1% and GDXJ gaining 5.5%.
The gold slump last week had been ostensibly driven by the Fed maintaining rates
and indicating a new hawkish stance given concerns over potential inflation driven by
the oil price shock from the conflict in the Middle East. However, it was also likely
largely because of the reversal of major speculative flows that had entered the sector
especially from December 2025 to January 2026. While many of the metals and
mining sector ETFs had already begun to pull back through February 2026, many
speculators were likely still holding on until last month, but the war throughout March
2026 has likely driven many of them out of the sector.
While short-term momentum traders from late 2025 and early 2026 have likely taken substantial hits in the recent plunge, real investors in the sector with even only a moderate six-month holding period have still seen substantial gains. While gold is down -14% since February 27, 2026, the last trading day before the start of the war, it is still up 28% since September 2025 (Figure 3). Gold was up 50% as of its peak in early February 2026 versus September 2025, which while quite aggressive, was not historically unprecedented. The only sector with a clearly egregious move was silver, which erupted 170% from September to late-January 2026 highs, and has dropped -23% since the war started, but it is still up a huge 76% over six months.
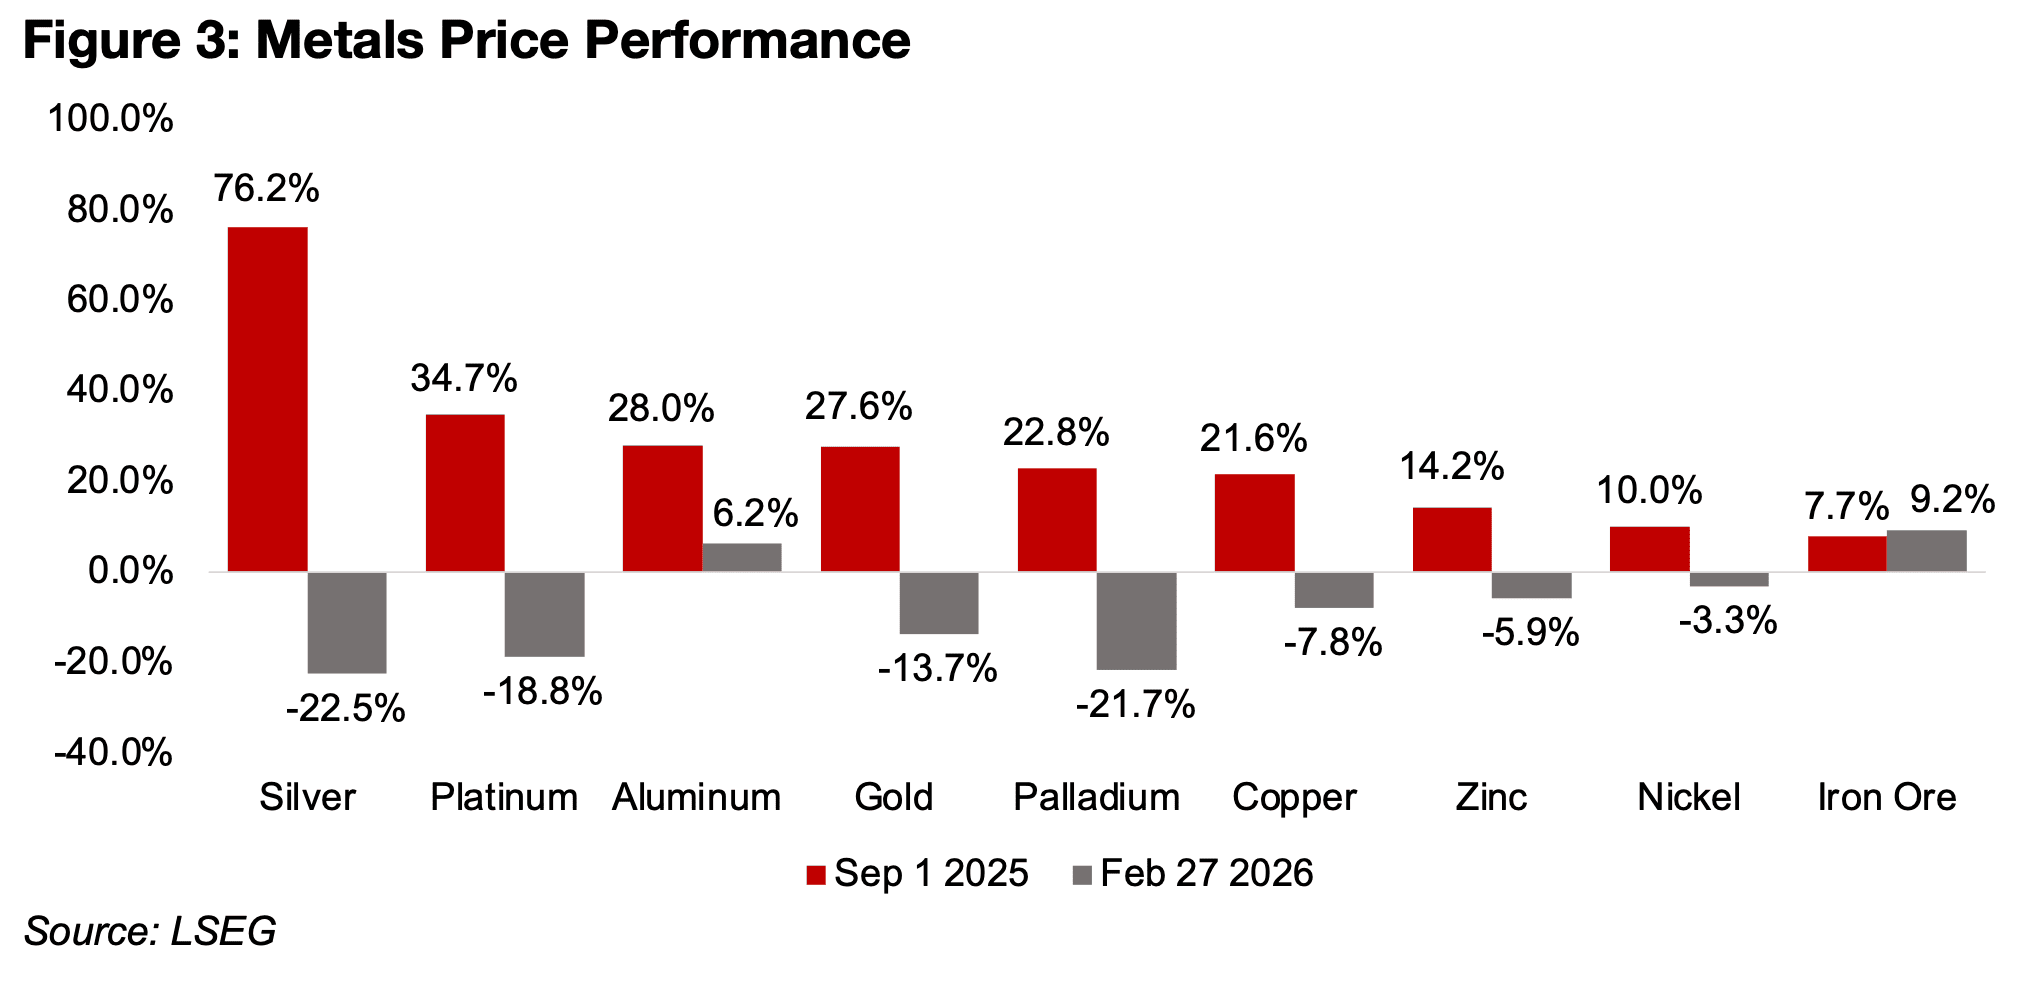
While platinum and palladium also saw bubbles, they were more subdued and much
shorter compared to silver, with peak gains from September 2025 of 97% and 89%
in late January 2026. The base metals markets were only ever in a solid bull trend
with copper and aluminum reaching gains of around 30%, and iron ore up just under
10% at its highs. While the recent drop will have very likely soured broader sentiment
on sector, investors that entered six months ago still have had substantial gains, with
the prices only looking weak now in the context of speculatively-driven highs.
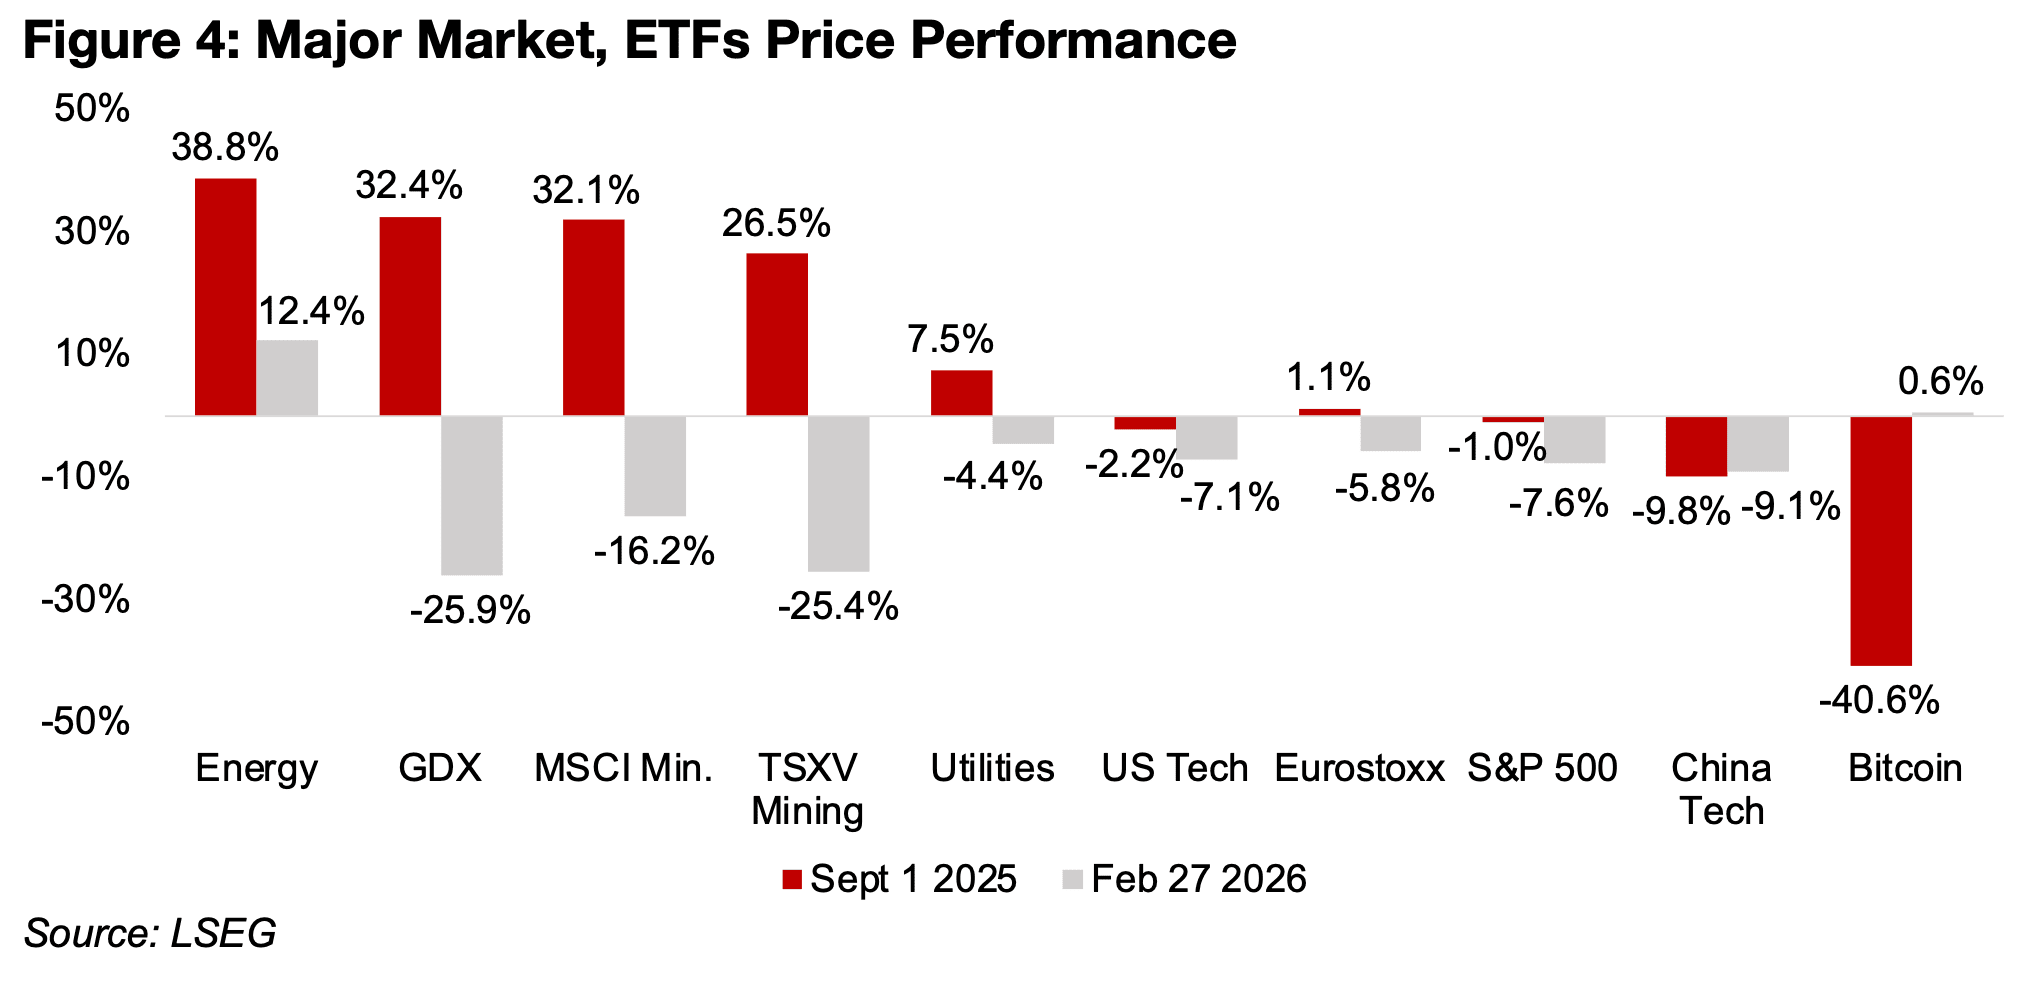
For some major metals stocks ETFs, we see a similar situation, with substantial losses
since the start of the war, but still major gains over the past six months. The GDX ETF
of mining producers, the PICK MSCI Mining and Metals ETF, weighted especially
heavily to iron ore and copper, and TSXV Mining Index, lost between 16%-26% since
March 2026, but are still up between 26%-34% from September 2025 (Figure 4).
While there were more muted declines in the major equity indices, with the S&P 500
down -7.6% and Eurostoxx off -5.8% since March 2026, they have barely moved
since September 2025, down 1.0%, and up 1.1%, respectively, far underperforming
the mining stocks. While there has been a lighter hit to the tech sector since March
2026, with the US down -7.2% and China losing -9.1%, both have far
underperformed the mining sector over six months, with losses of -2.2% and -9.8%.
There is evidence of some risk aversion in the market with the rise in the defensive
utilities sector, down -2.2% since the war, but up 7.5% over six months. The energy
sector has been the major outperformer on the surging gold price, up 12.4% over the
past few weeks and up 38.8% since September 2025. While Bitcoin has seen support
since March 2026, holding near flat with a 0.6% gain, it has crashed -40.6% over the
past six months, the weakest performer of the major global assets.
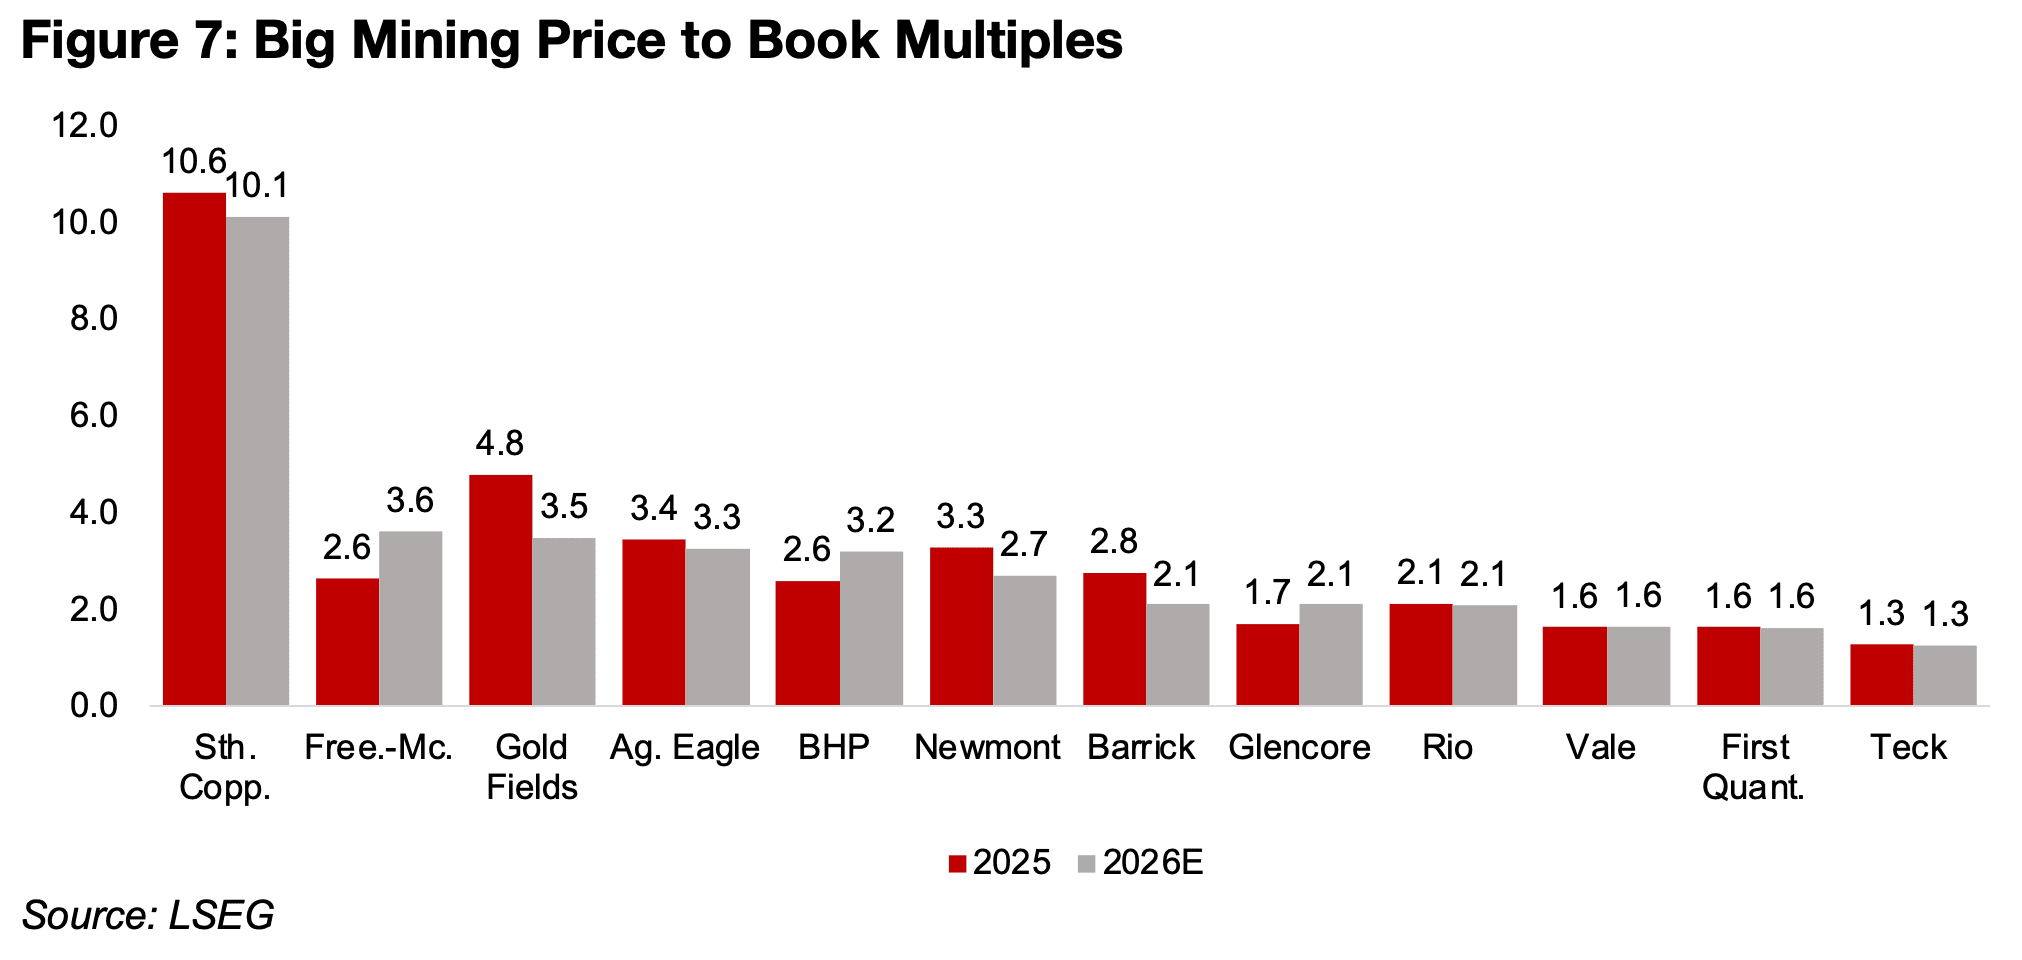
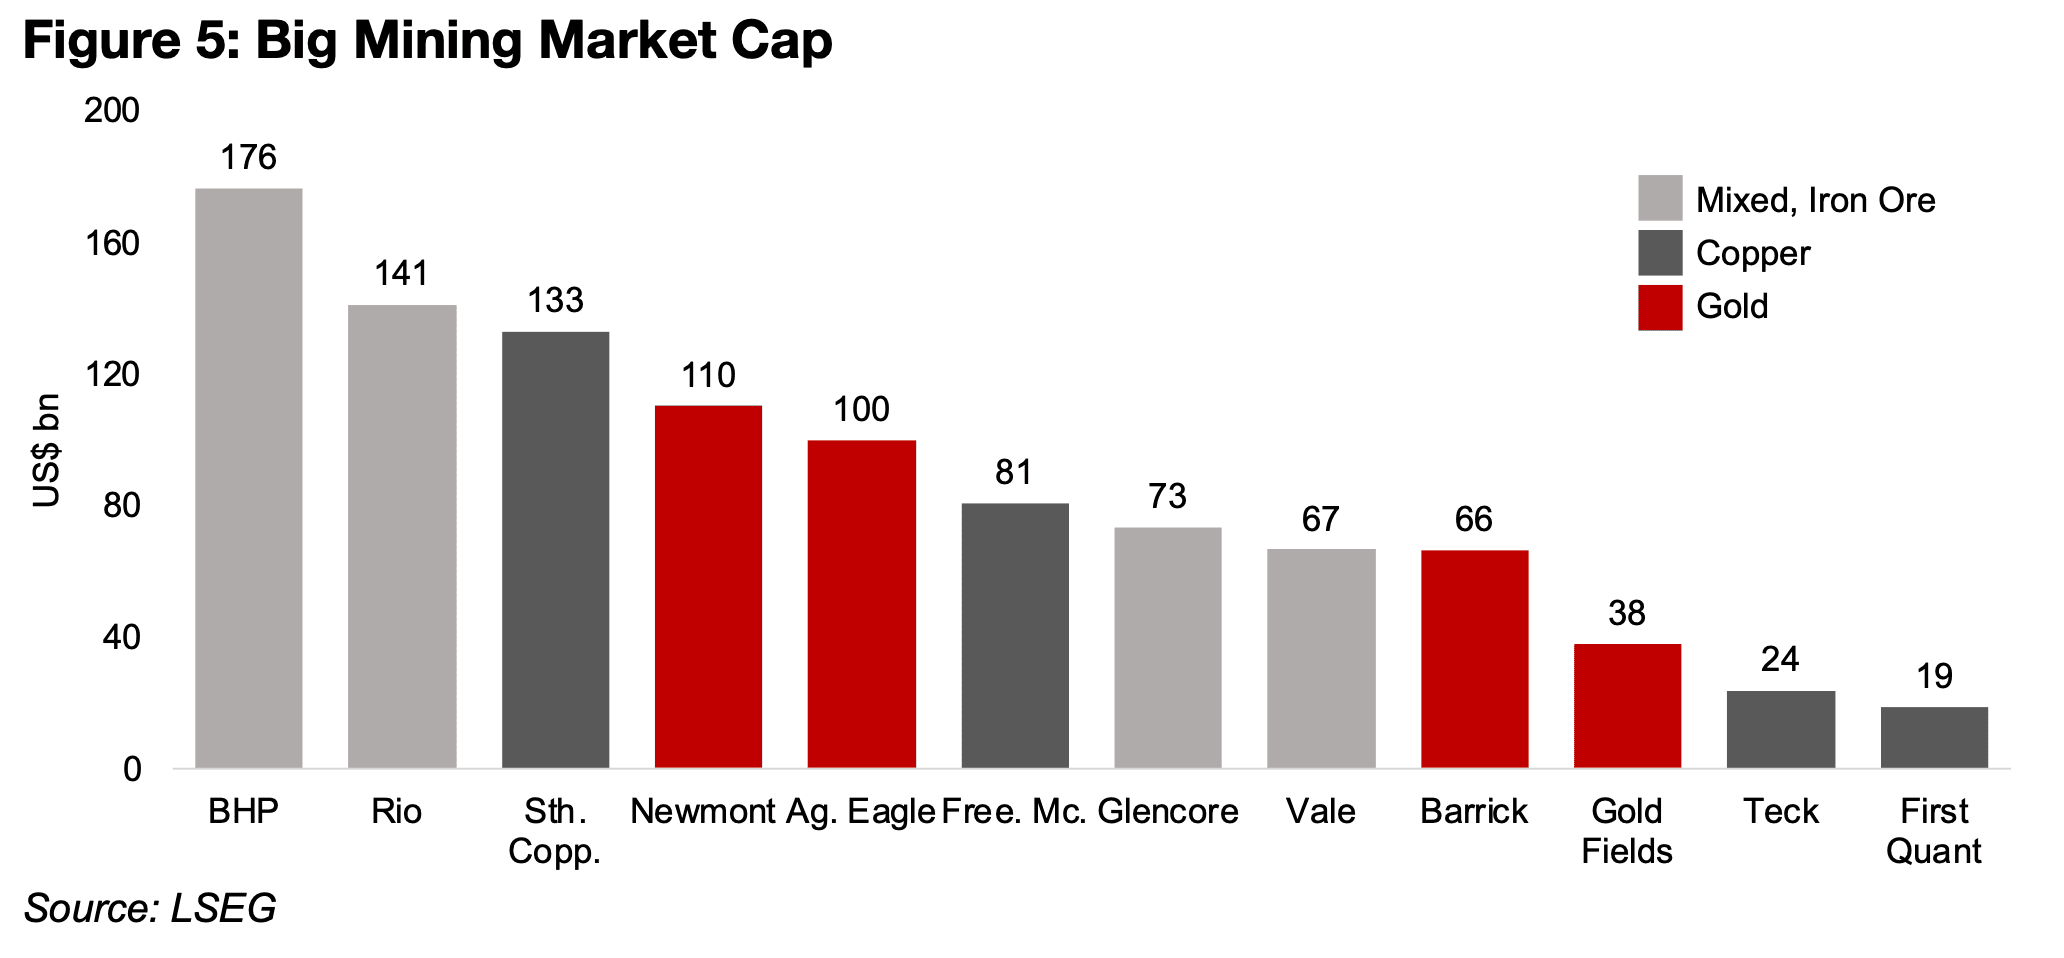
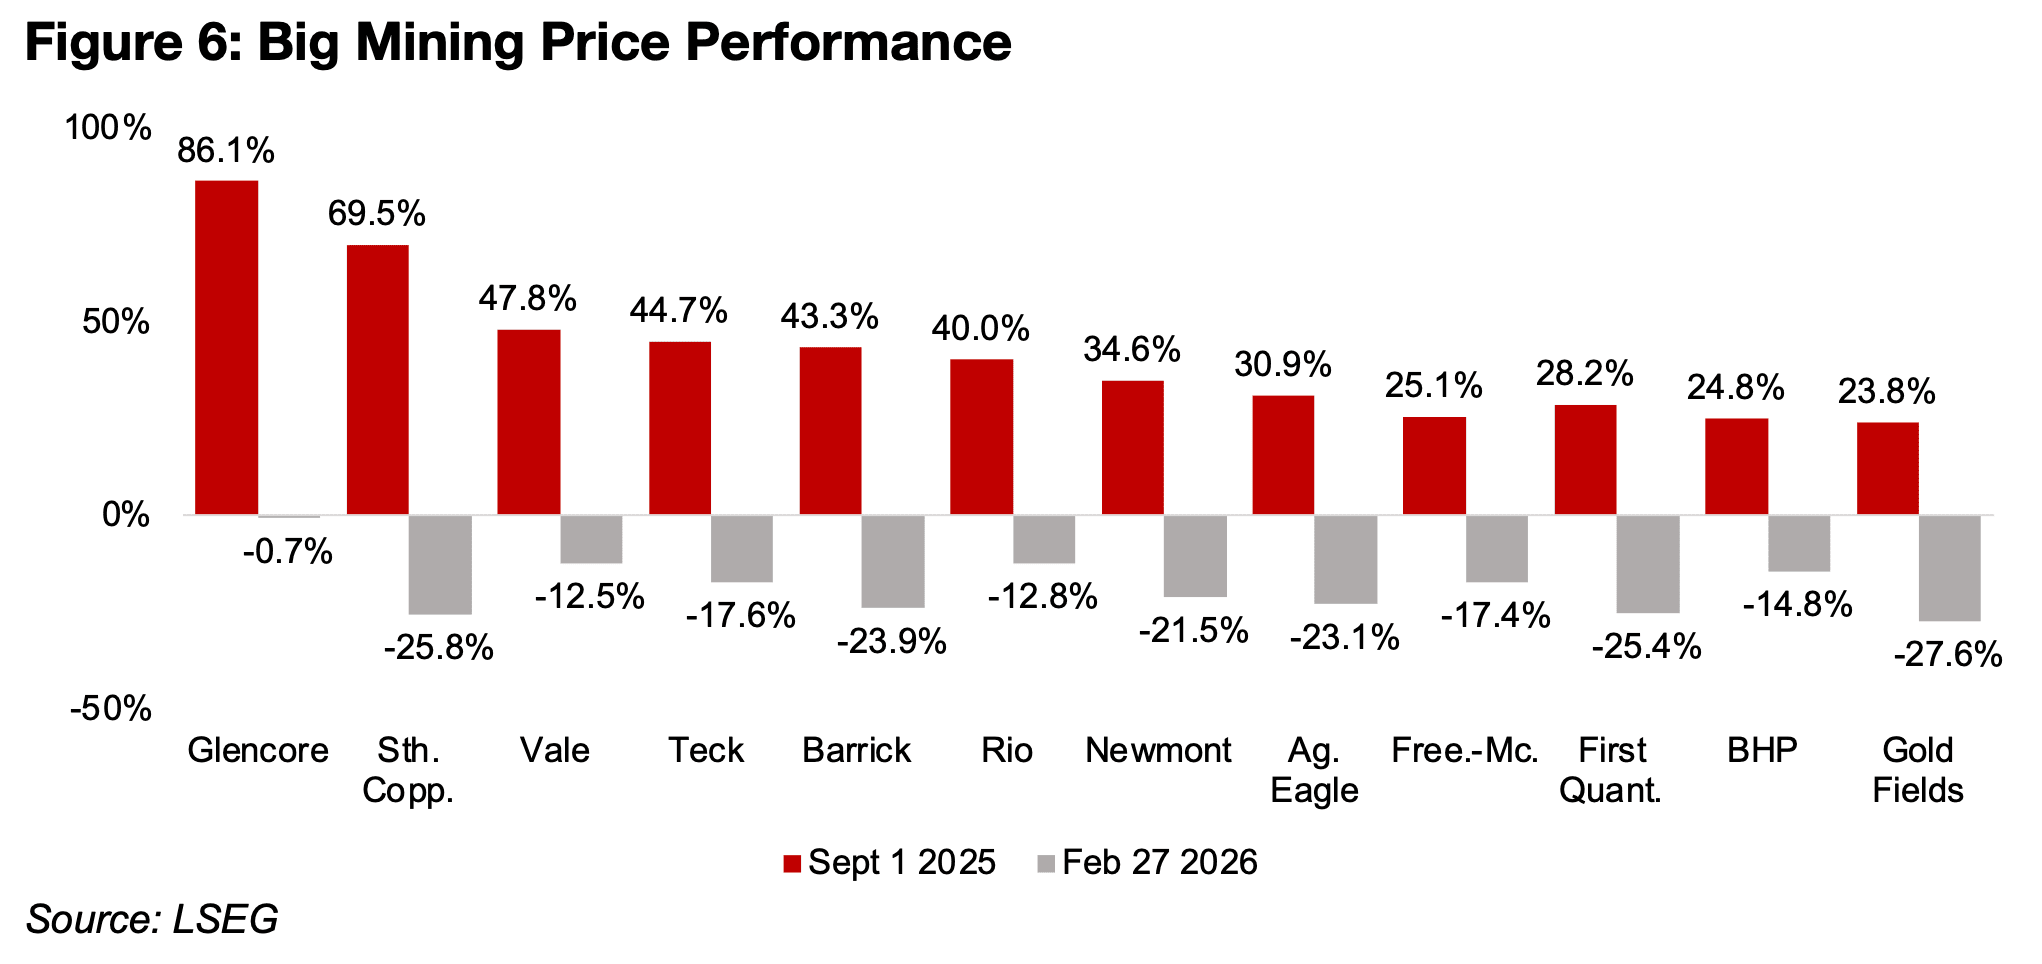
The Big Mining stocks in Figure 5 have some of the highest weightings in the GDX ETF of gold producers and PICK ETF of base metals producers (Figure 5). While almost all of these majors have seen significant slumps since the start of the war, down between -13% to -28%, they are also still up substantially from September 2025, by 24% to 70% (Figure 6). There has been one exception, Glencore, which is near flat since March 2026, down just -0.7%, and up 86.1% over six months, because it also has a large energy segment in addition to metals production. Valuations for the sector remain mixed, with a price to book over 3.0x times generally considered to be heading into expensive territory, and below 1.0x times inexpensive for a company not in distress (Figure 7). Only Southern Copper has a very high P/B, and while partly backed by strong fundamentals, does stand far out from the sector.
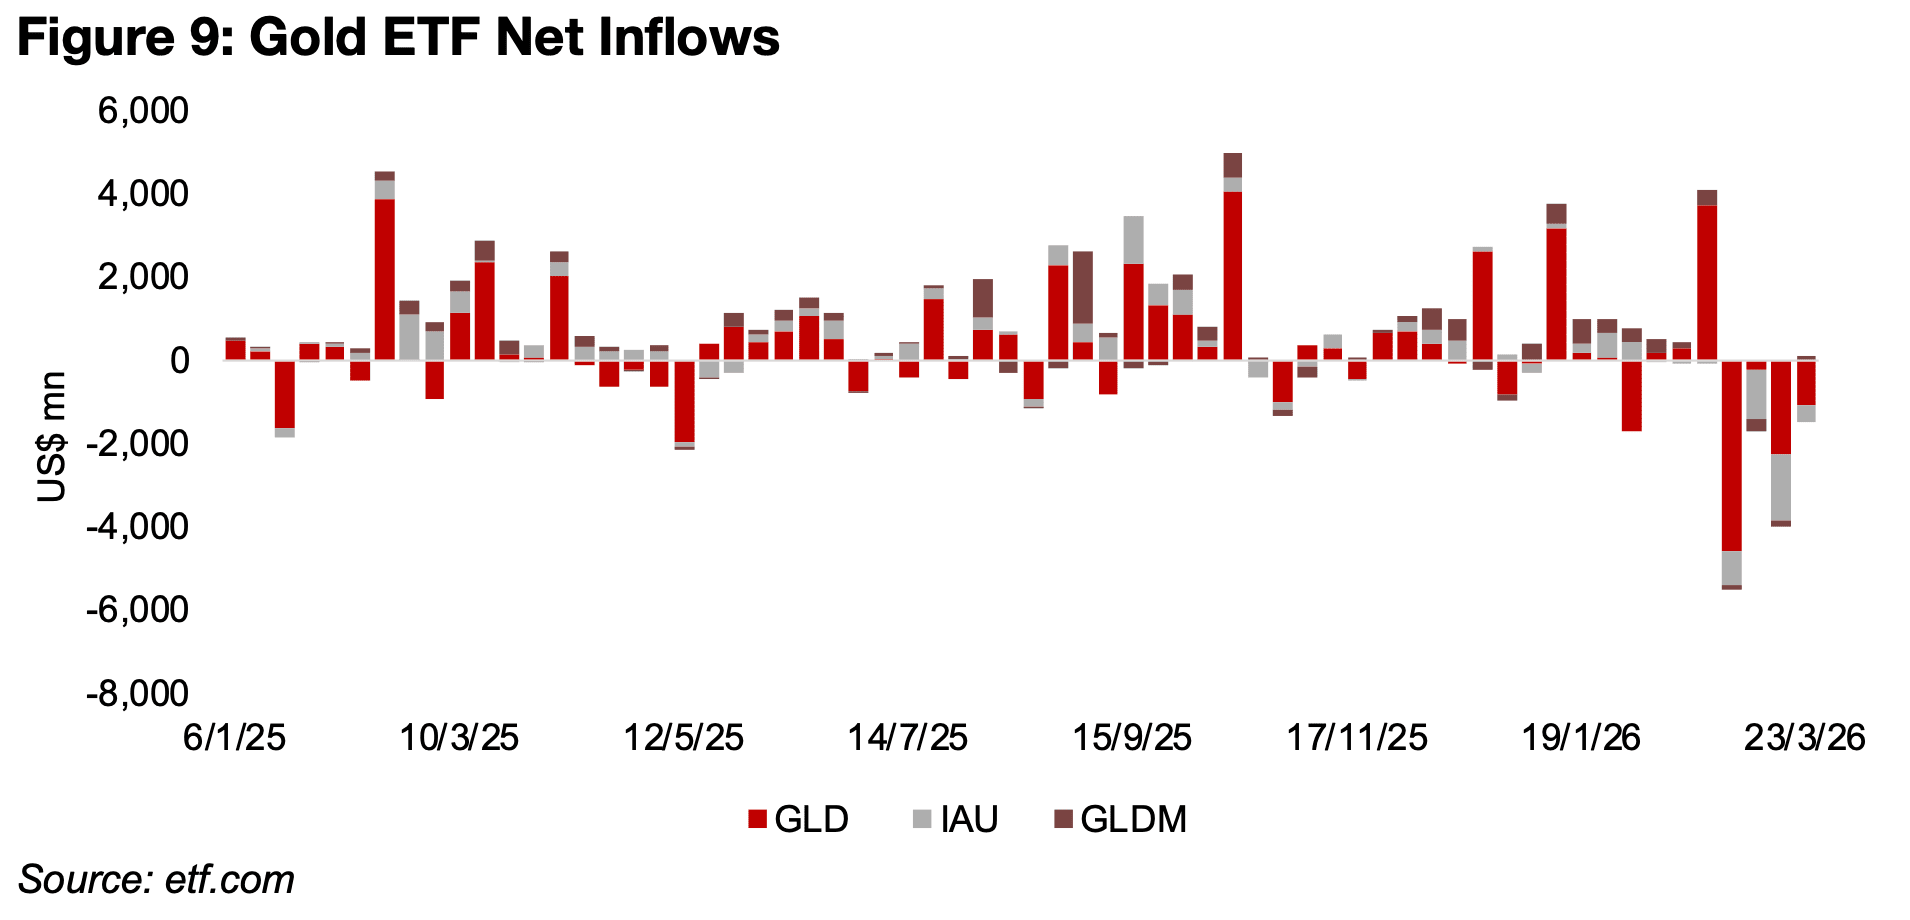
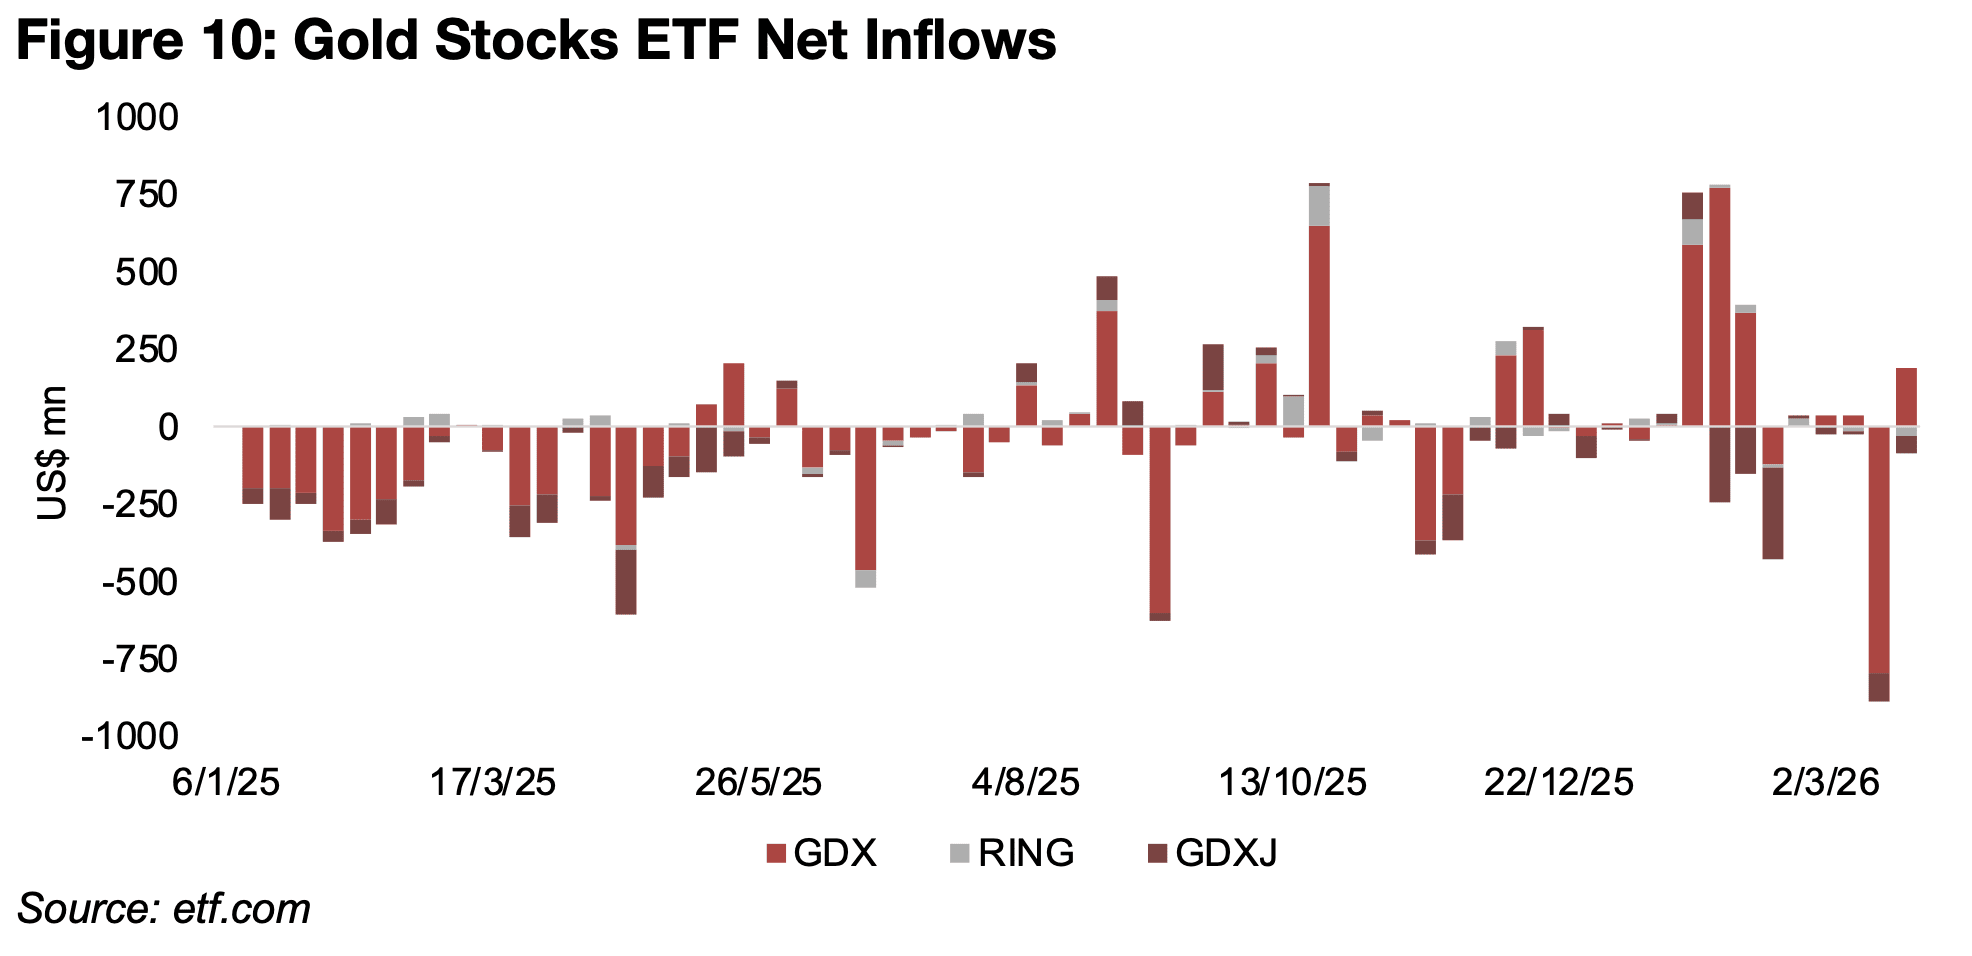
While the slump in metals and mining stocks might have been expected to drive major outflows from the sector, they actually have not been that severe overall. There have been substantial outflows from the combined GLD, IAU and GLDM gold price ETFs for four weeks, but this mainly has just reversed two weeks of major inflows in late December 2025 and February 2026 (Figure 9). While most these inflows and outflows have been concentrated in GLD ETF, which is the largest in the sector, the IAU ETF saw major outflows in recent weeks that did offset the inflows in recent months. The GLDM ETF has been a smaller proportion of total gold price ETF inflows over the past year. While gold stocks’ net outflows were huge for a single week at the start of the war, they were far down in the second week of the conflict, and this has still not offset the huge inflows of late last year and into early this year (Figure 10).
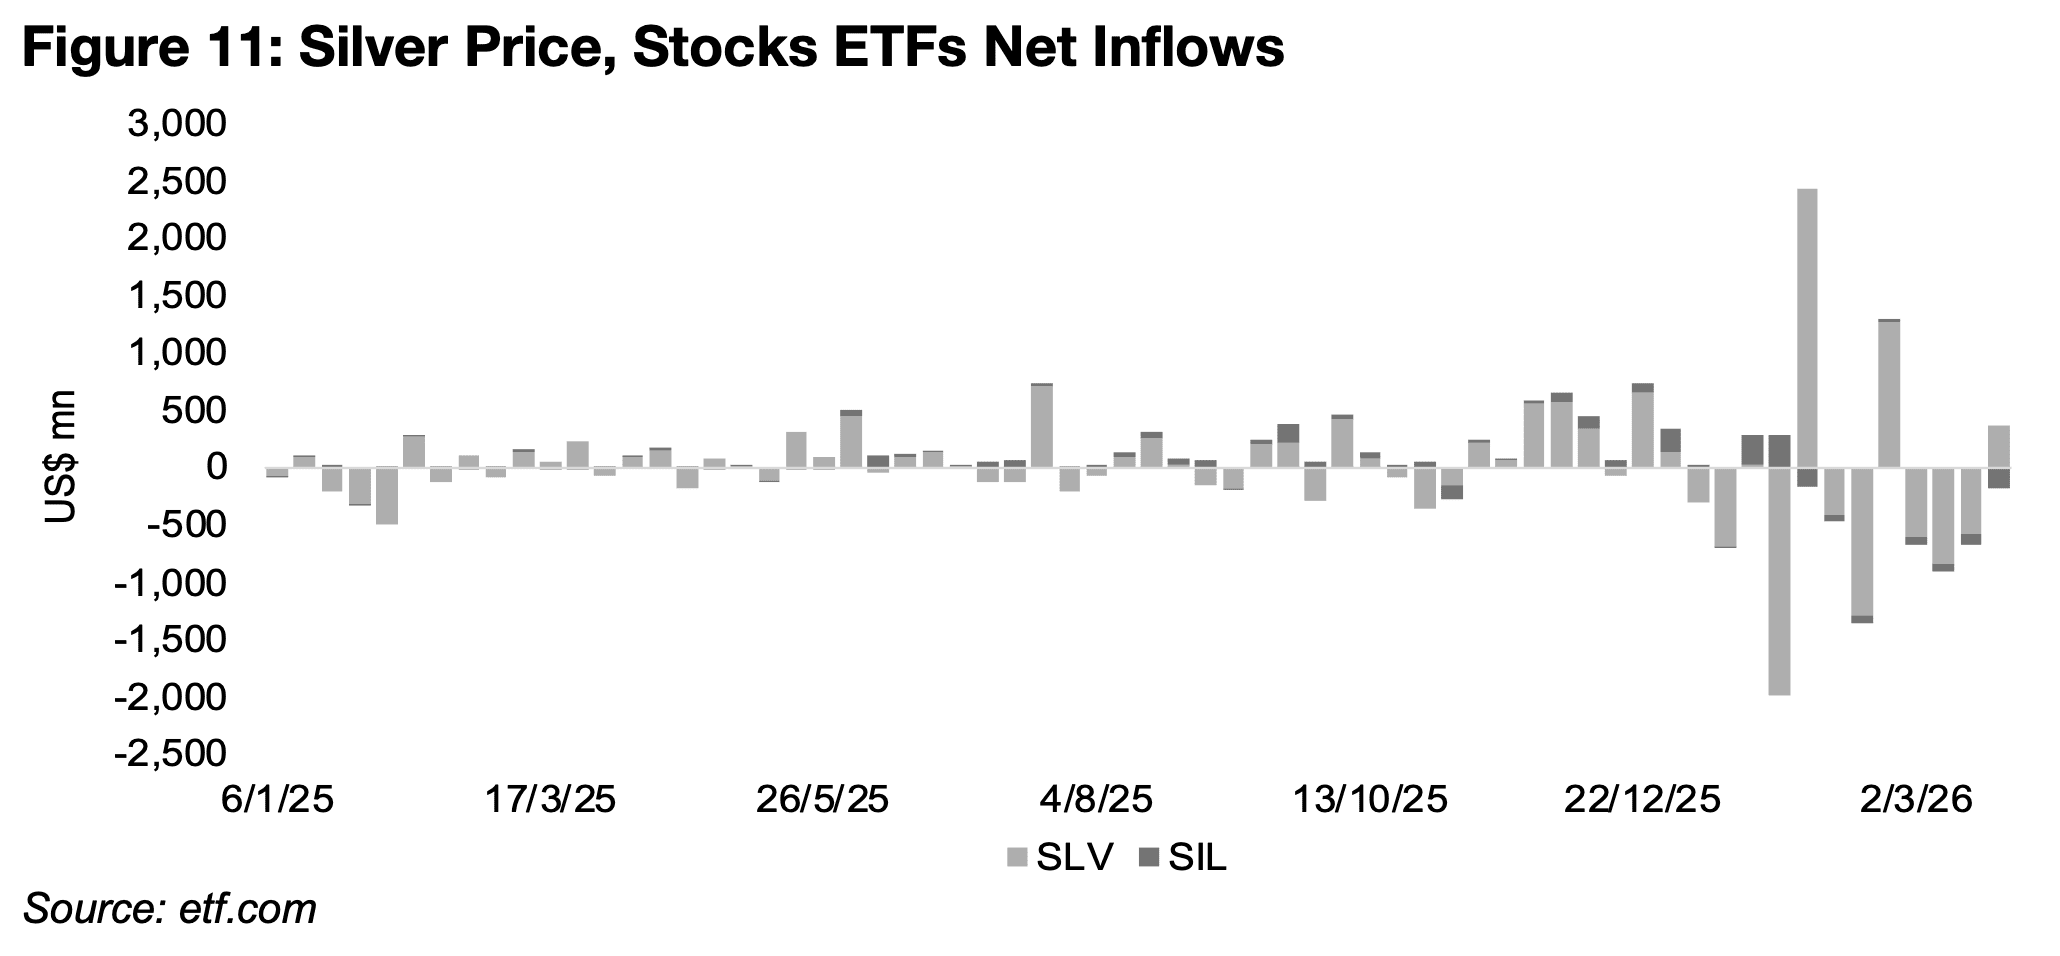
The silver sector flows are concentrated in the SLV silver price ETF, and the outflows have actually been subdued during the war, even as the weakness in the silver price continued (Figure 11). This was because the major pullback in the silver price started well before the conflict, in February 2026, after the price peaked in a surge in January, although similar to the gold price ETFs, the outflows have still not offset the huge inflows from December 2025 into January 2026. There have been outflows from the SIL silver stock ETF inflows since the conflict, but in terms of absolute size, these are marginal compared to the SLV ETF.
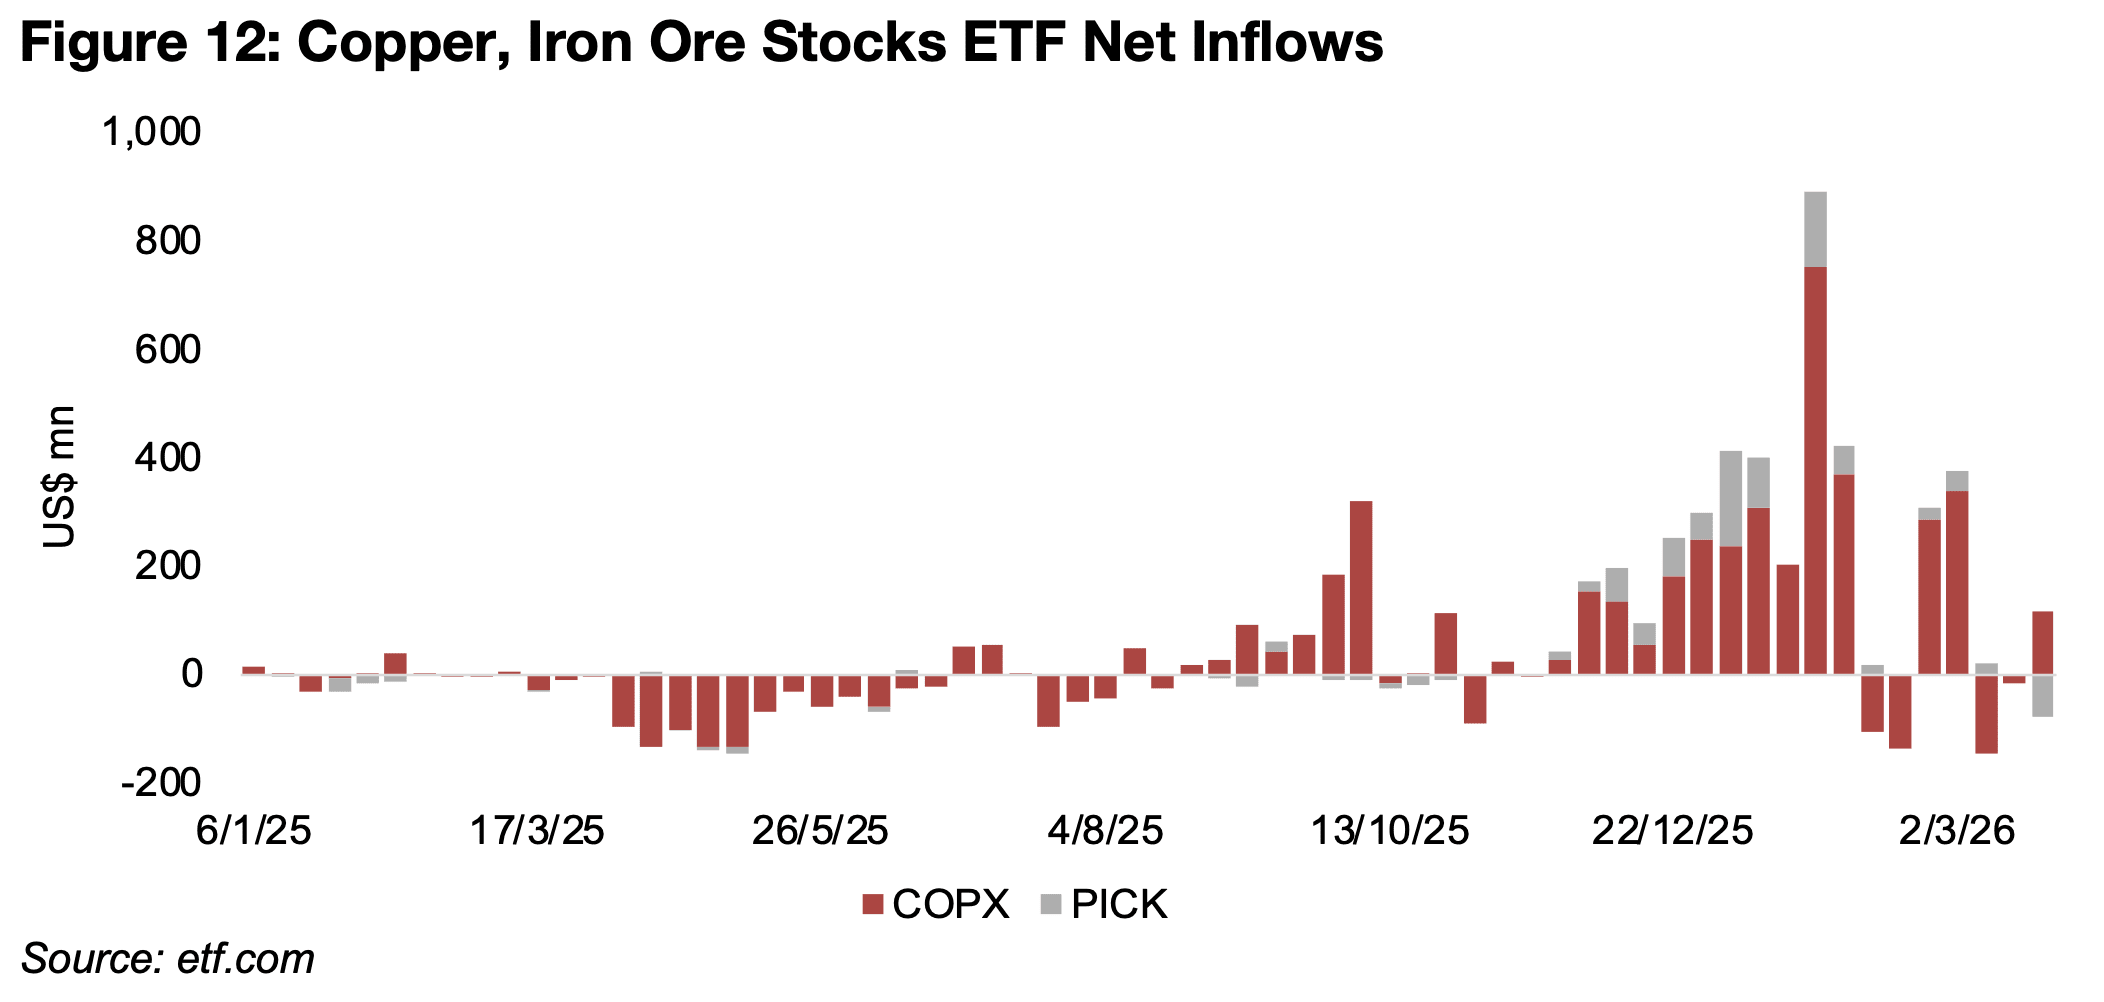
There are no large major ETFs that are direct plays on the copper or iron ore price
like the GLD and other ETFs for gold or the SLV for silver, with the COPX ETF of
copper stocks and PICK ETF of the largest global base metals miners the largest for
the segment. The outflows from the COPX ETF have not been severe since the Middle
East war began, with only one week of significant selling, followed by a roughly flat
week, and then one with gains (Figure 12).
The COPX had seen a more steady, strong several weeks of inflows through
December 2025 and January 2026, and then only a moderate reversal in early
February 2026 as sentiment on metals and mining started to turn down. The PICK
ETF actually sees far lower flows than the COPX even though it comprises all of the
largest mining stocks except for the gold stocks. There were actually inflows into
PICK in the first week of the conflict, almost no flows in the second week, and then
some outflows in the third week. While there were also some PICK outflows in
February 2026, these have still been far offset by the inflows in December 2025 and
January 2026.
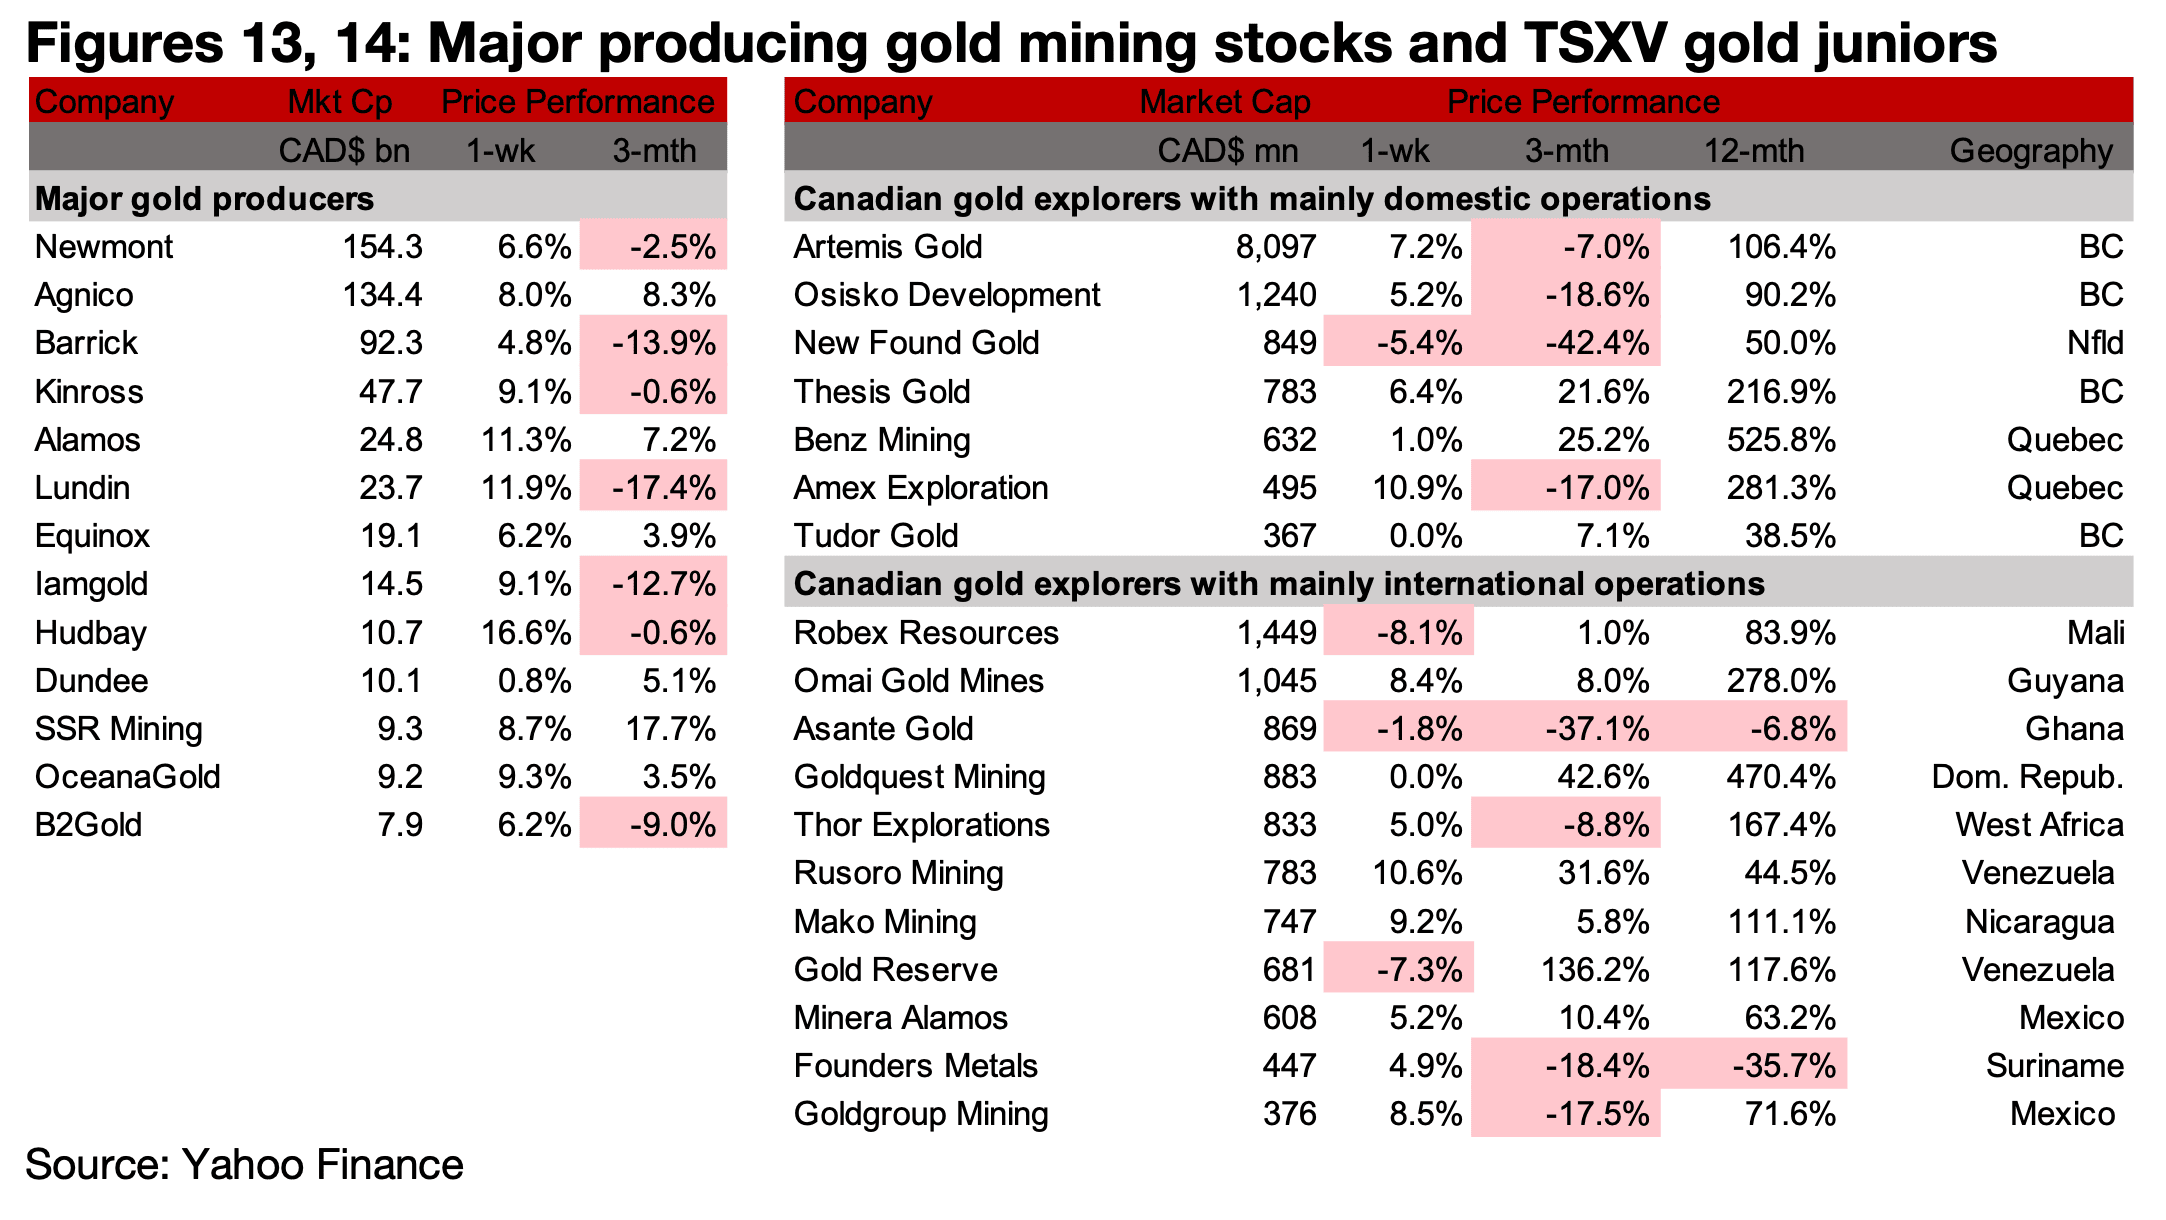
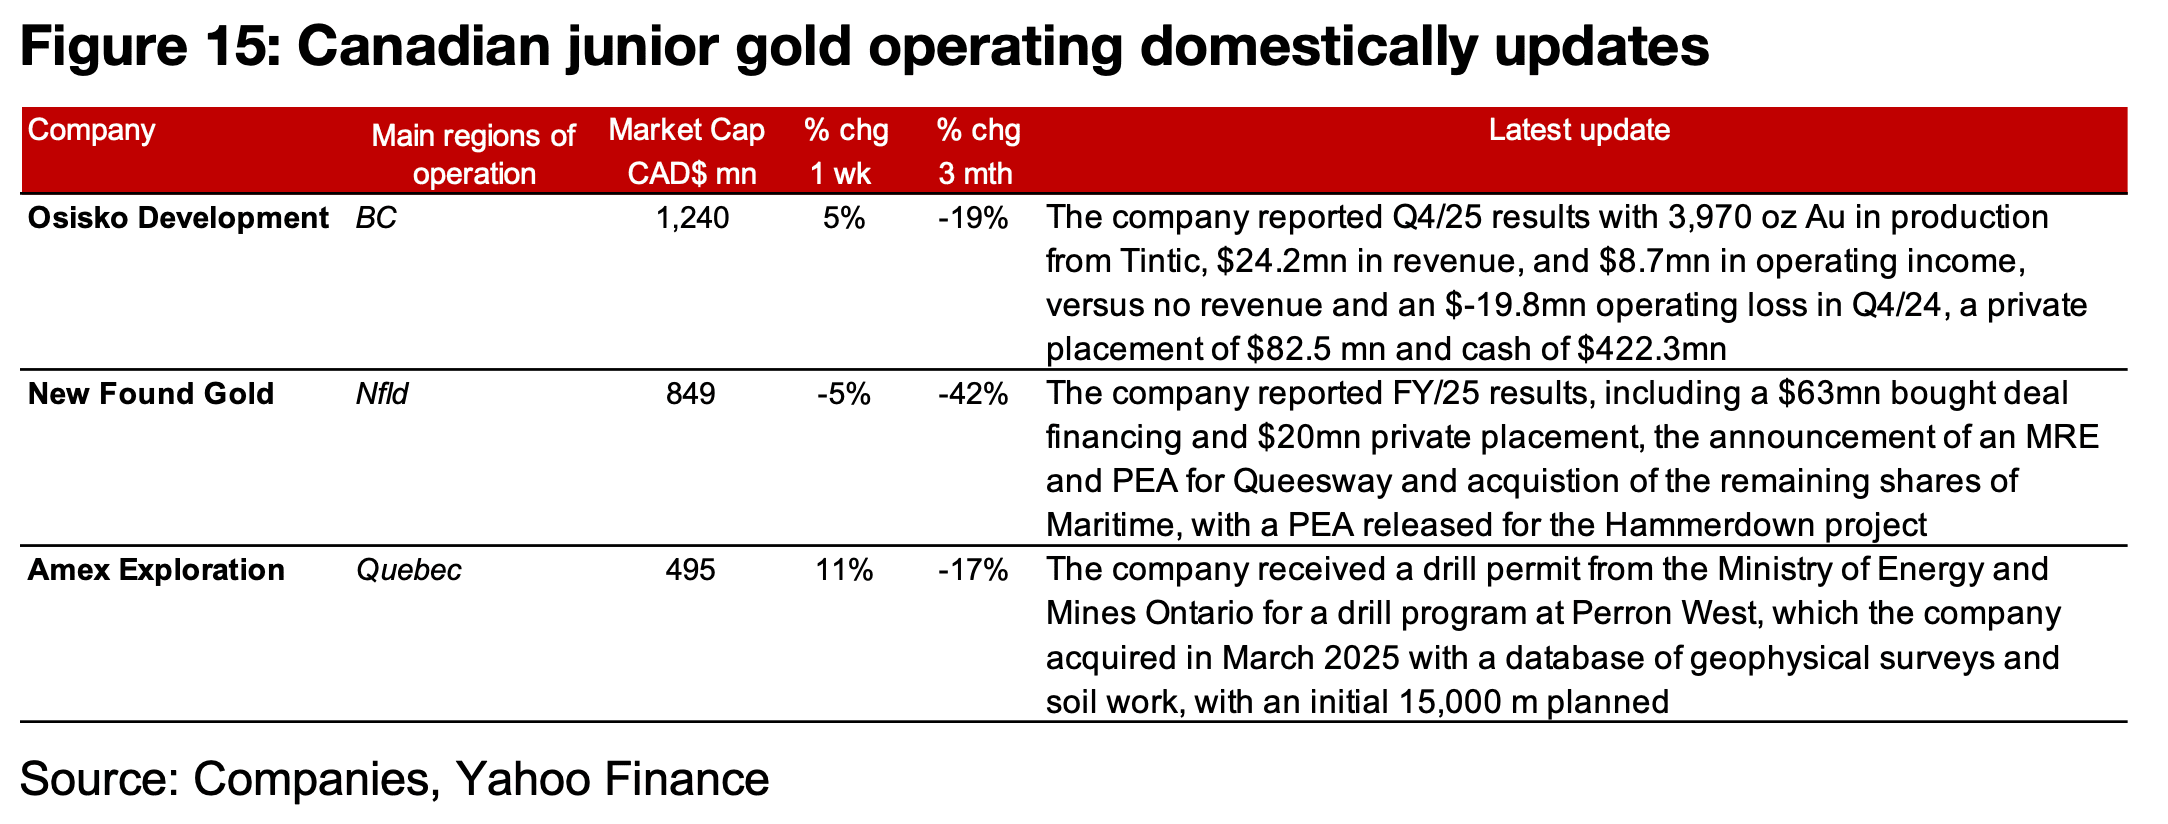
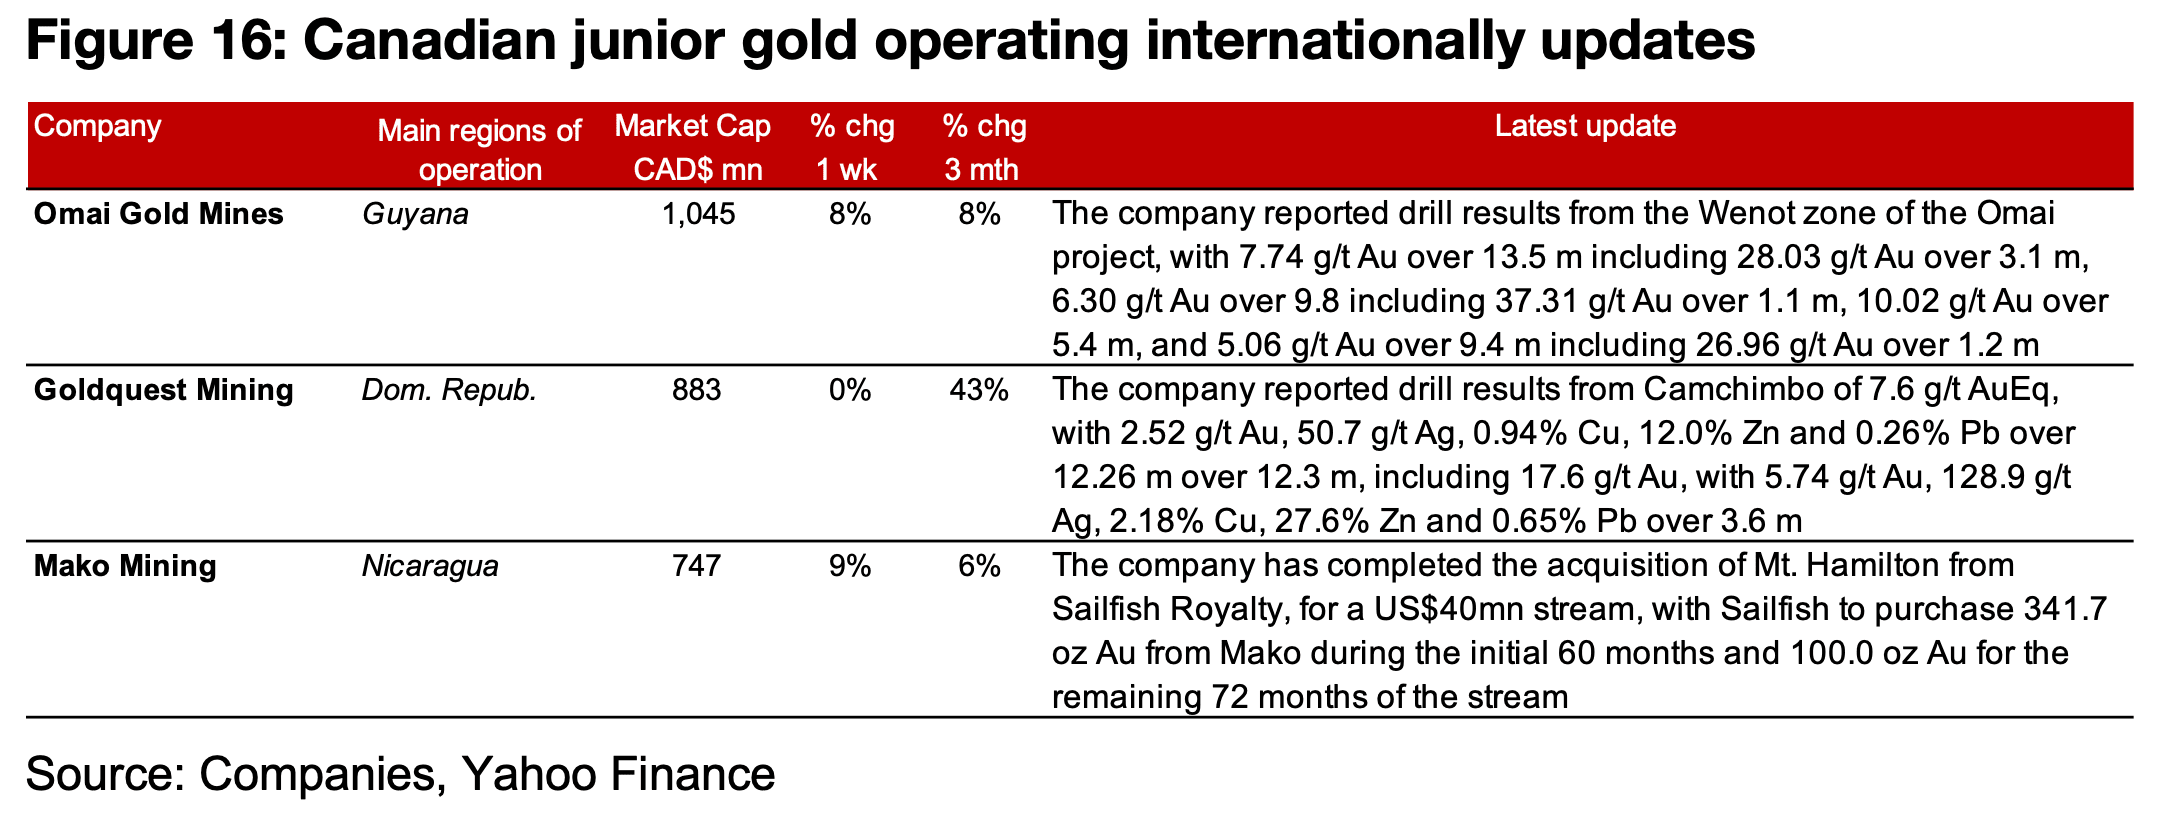
The major producers and TSXV gold saw major declines on the huge drop in the gold price (Figures 13, 14). For the TSXV gold companies operating mainly domestically, Osisko Development reported Q4/25 results with production and revenue from Tintic and a private placement. New Found Gold reported FY/25 results, including two financings, an MRE and PEA for Queensway and the acquisition of the remaining shares of Maritime and a PEA for the Hammerdown project. Amex Exploration received a drill permit from the Ministry of Energy and Mines Ontario for the drill program at Perron West (Figure 15). For the TSXV gold companies operating mainly internationally, Omai Gold Mines and Goldquest reported drill results from the WeNot zone of Omai and Camchimbo, and Mako Mining completed the acquisition of Mt. Hamilton for a US$40mn stream to Sailfish. (Figure 16).
Disclaimer: This report is for informational use only and should not be used an alternative to the financial and legal advice of a qualified professional in business planning and investment. We do not represent that forecasts in this report will lead to a specific outcome or result, and are not liable in the event of any business action taken in whole or in part as a result of the contents of this report.
Author
Ben McGregor authors the Weekly Roundup at CanadianMiningReport.com, providing sharp analysis of the metals and mining sector. With a talent for spotting trends, Ben distills complex market shifts into clear, engaging insights on TSXV junior miners. His weekly updates cover gold, copper, uranium, and more, blending data-driven perspectives with a knack for identifying opportunities. A vital resource for investors, Ben’s work navigates the dynamic junior mining landscape with precision.