August 11, 2025
Gold rose 2.7% to US$3,439/oz, partly on confusion after markets viewed a US Customs announcement as implying major tariffs on gold, but the government then indicated this was misinformation and that a clarification would soon follow.
This week we look at the concern in Switzerland over the potential tariff change, as it is by far the world’s largest gold refiner and exporter, with the metal accounting for over 20% of its exports and the US its third largest market for gold shipments.
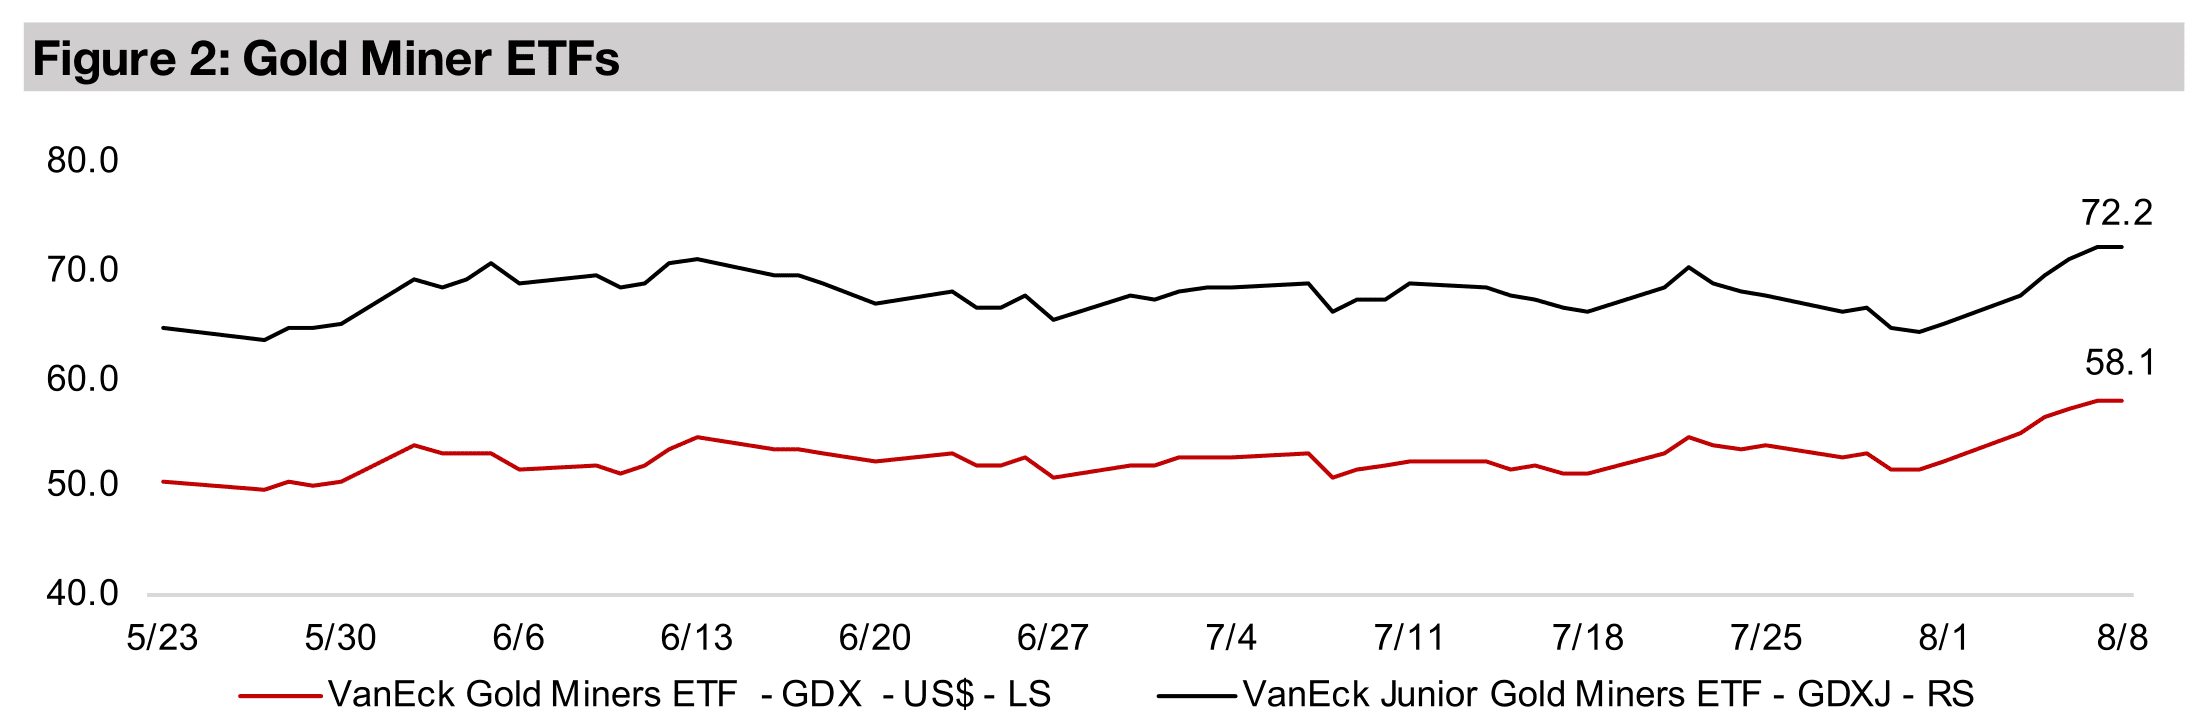
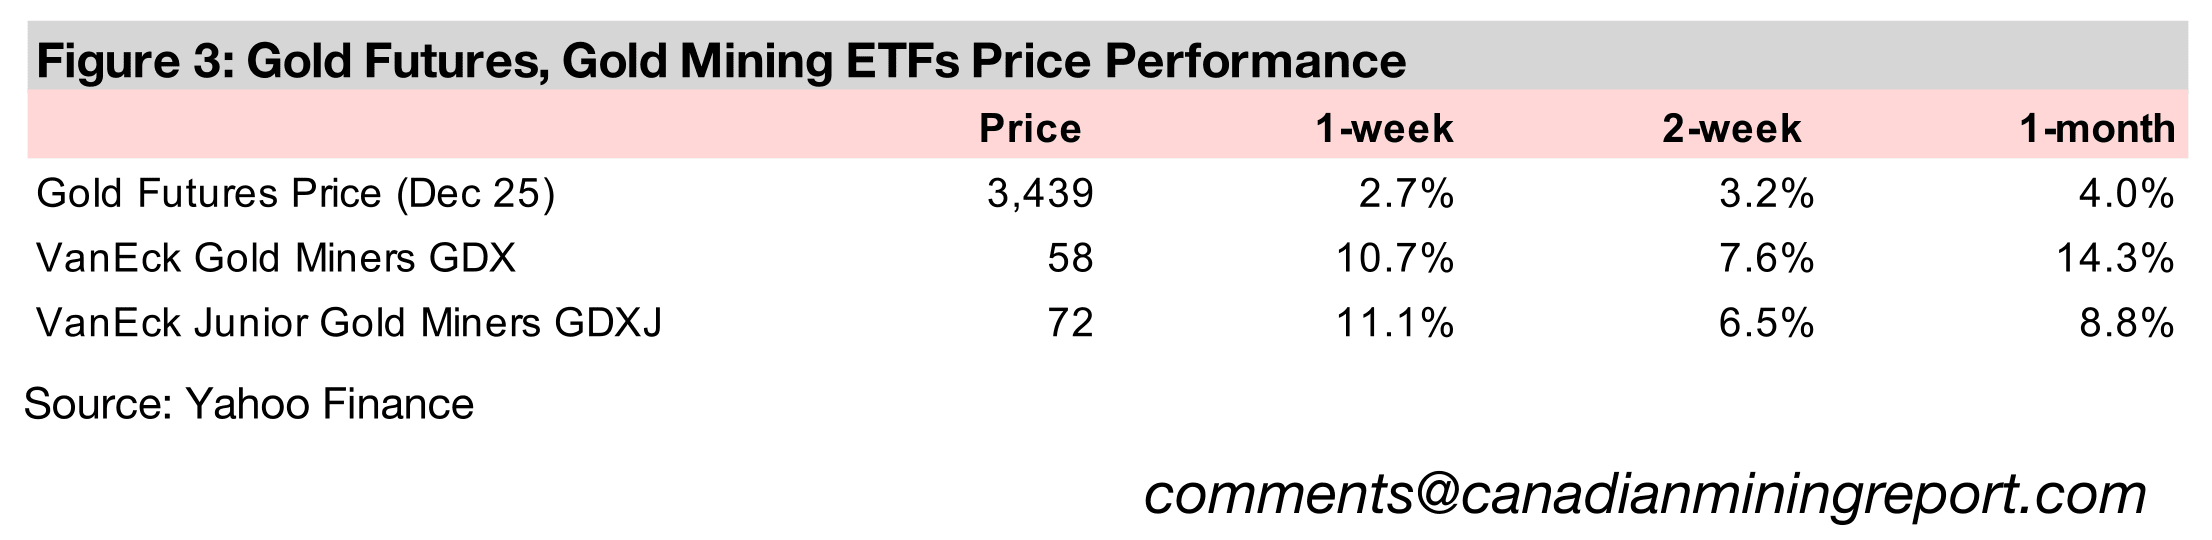
The gold stocks jumped, with the GDX up 10.7% and GDXJ rising 11.1%, reaching new highs on the rise in the metal and a continued gain in equities, and the valuations of both ETFs are no longer clearly inexpensive for the first time in years.


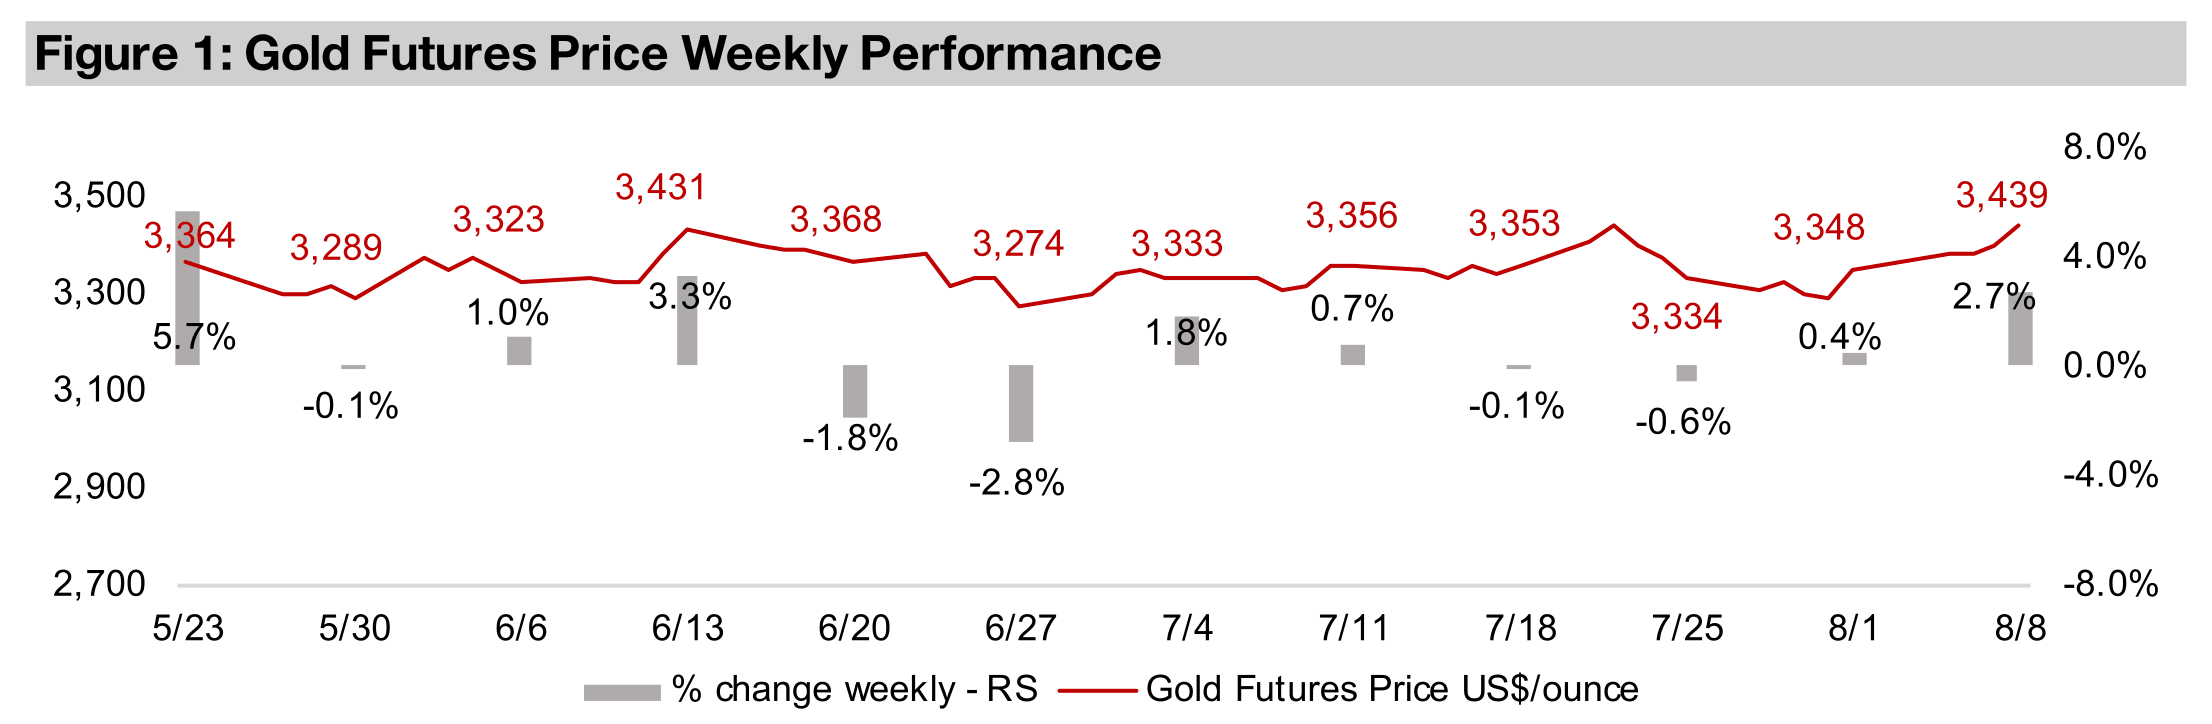
The gold price jumped 2.7%, getting above the US$3,200-US$3,400/oz range that
has held for nearly four months for the third time, although the moves above this level
have lasted so far only one or two days. The jump appears to have been mainly driven
by market confusion over US trade policies related to gold, after tariff-driven
distortions for copper finally cooled last week. This came from a US Customs post
that was interpreted by the market as implying tariffs of up to 39% on some gold
products. While this sent gold soaring initially, it pulled back after the government
announced that the market was misinformed and a clarifying executive order would
follow, although this has not yet been released.
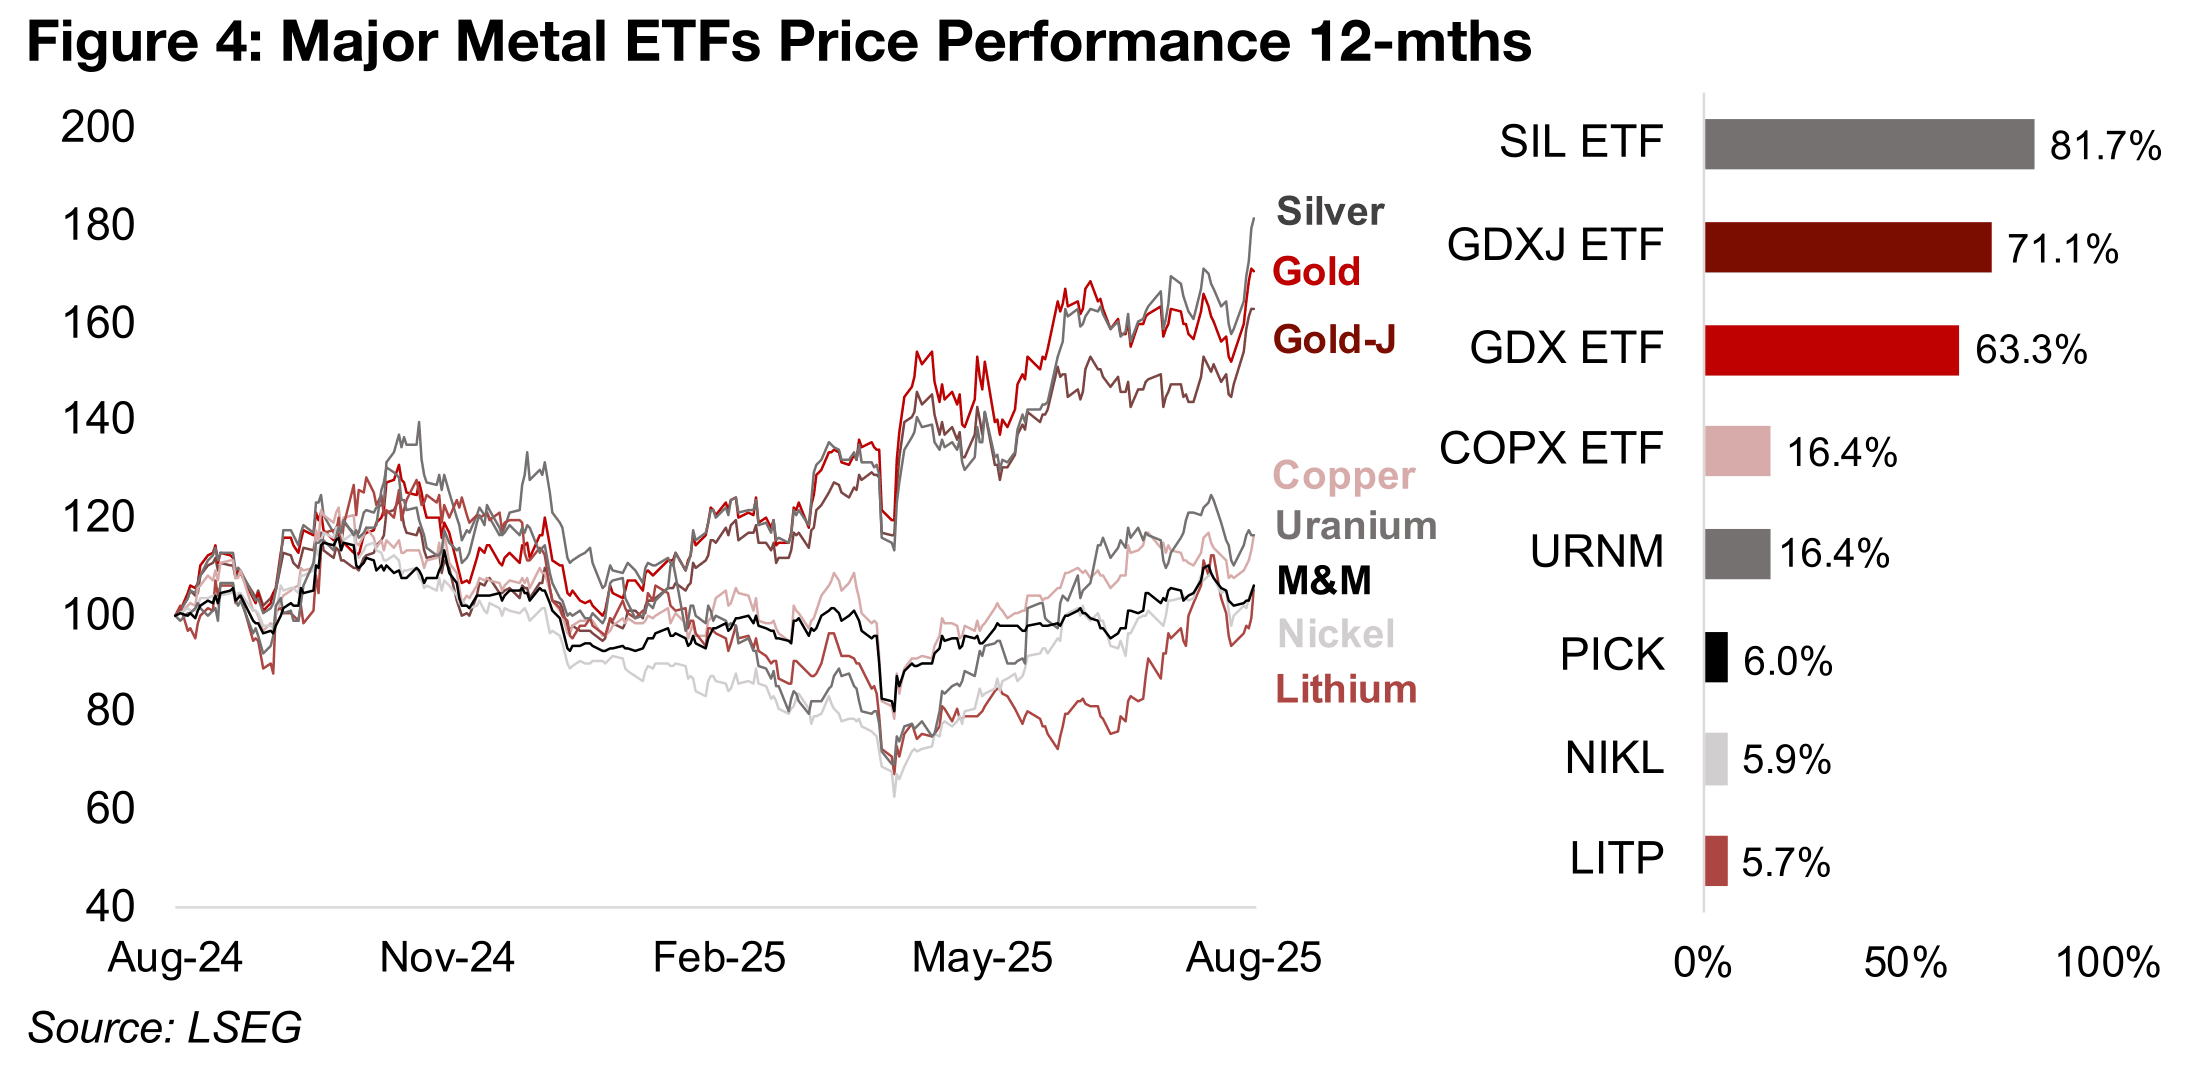
The jump in the metal sent gold stocks soaring to new highs, with the GDX up 10.7%
and GDXJ gaining 11.1%, with further support from a rise in equities, as the S&P 500
increased 1.9%, the Nasdaq was up 2.9% and Russell 2000 added 1.9%. The GDX
and GDXJ are up 63.3% and 71.1% over the past year, outperformed only by the SIL
ETF of silver stocks, which is up 81.7% (Figure 4). While these precious metals ETFs
have more than tripled the 16.4% rise in the COPX ETF of copper stocks and URNM
ETF of uranium stocks, these gains are still reasonably high in absolute terms.
Even the nickel and lithium ETFs, the major laggards in the sector, have finally
reversed from losses for most of the year, with the NIKL and LITP ETFs up 5.9% and
5.7%, respectively. The other major laggard, the MSCI Metals and Mining ETF, has
also shifted to gains of 6.0%, with it mainly dragged down by the high exposure of
its largest holdings to a weak iron ore price. The risk-on trend in equities has likely
been more of a major catalyst for the base metals ETFs than the precious metals
ETFs, which are more driven by monetary factors and viewed as risk hedges, leaving
the former potentially exposed to downward pressure if the bullish trend falters.
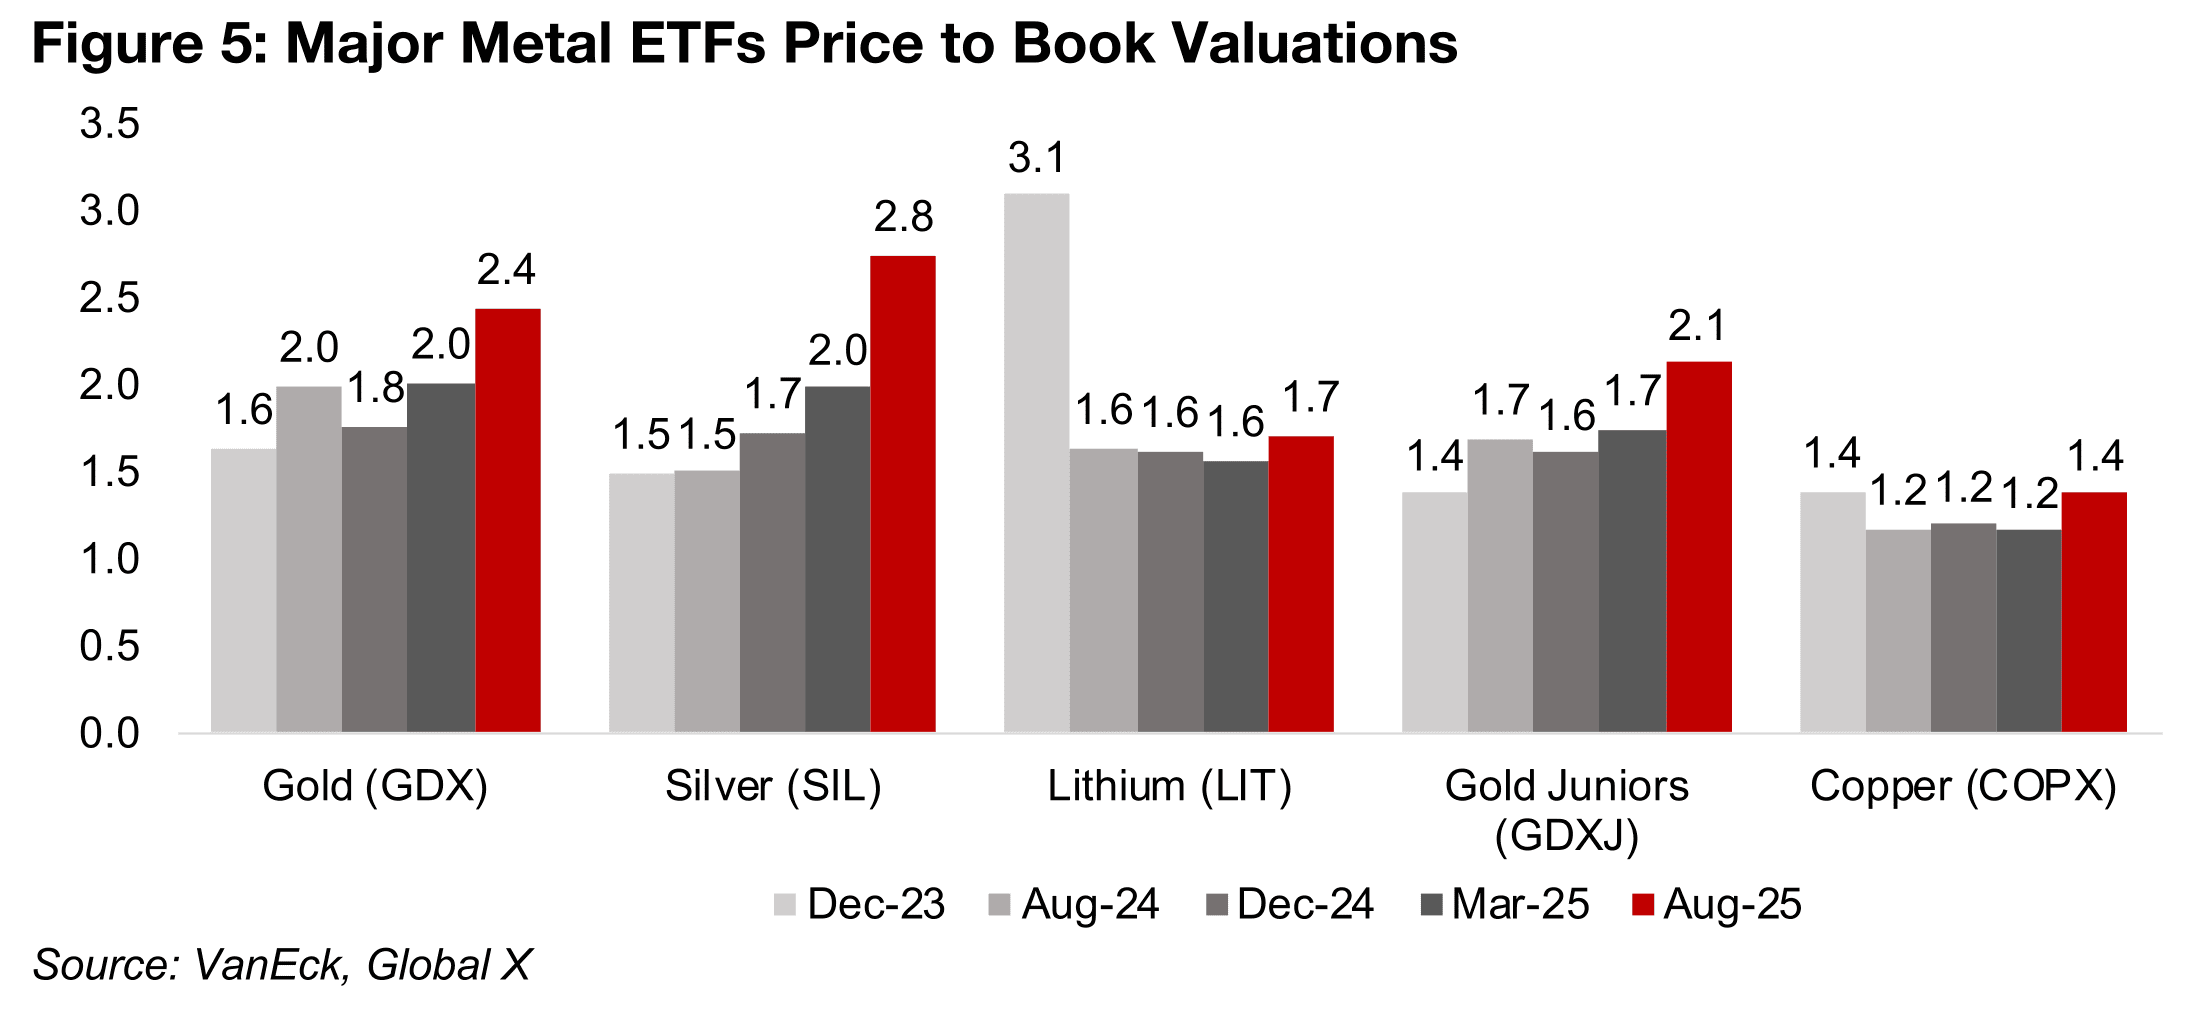
One major shift from the huge rise in the gold and silver ETFs this year has been that
for the first time in years their valuations are no longer clearly inexpensive. A price to
book (P/B) valuation below 1.0x often indicates a company in financial difficulty, and
above 3.0x is usually the start of high valuation territory. The GDX P/B of 2.4x is no
longer clearly inexpensive, especially compared to when it traded at just 1.6x at the
end of 2023. The silver ETF P/B, which has surged to 2.8x, is starting to look relatively
high, especially versus just 1.5x at the end of 2023. (Figure 5). While the GDXJ P/B is
not particularly high at 2.1x, it is also no longer clearly low, having risen from just 1.4x
at the end of 2023. The GDX P/B has consistently been higher than the GDXJ, partially
accounted for by the latter having a smaller average size of company, which tend to
be riskier than the larger companies in the former. The COPX copper and LIT lithium
ETF P/Bs are still low at 1.4x and 1.7x, having picked up moderately from the 1.2x
and 1.6x levels that persisted from 2024 to early 2025.
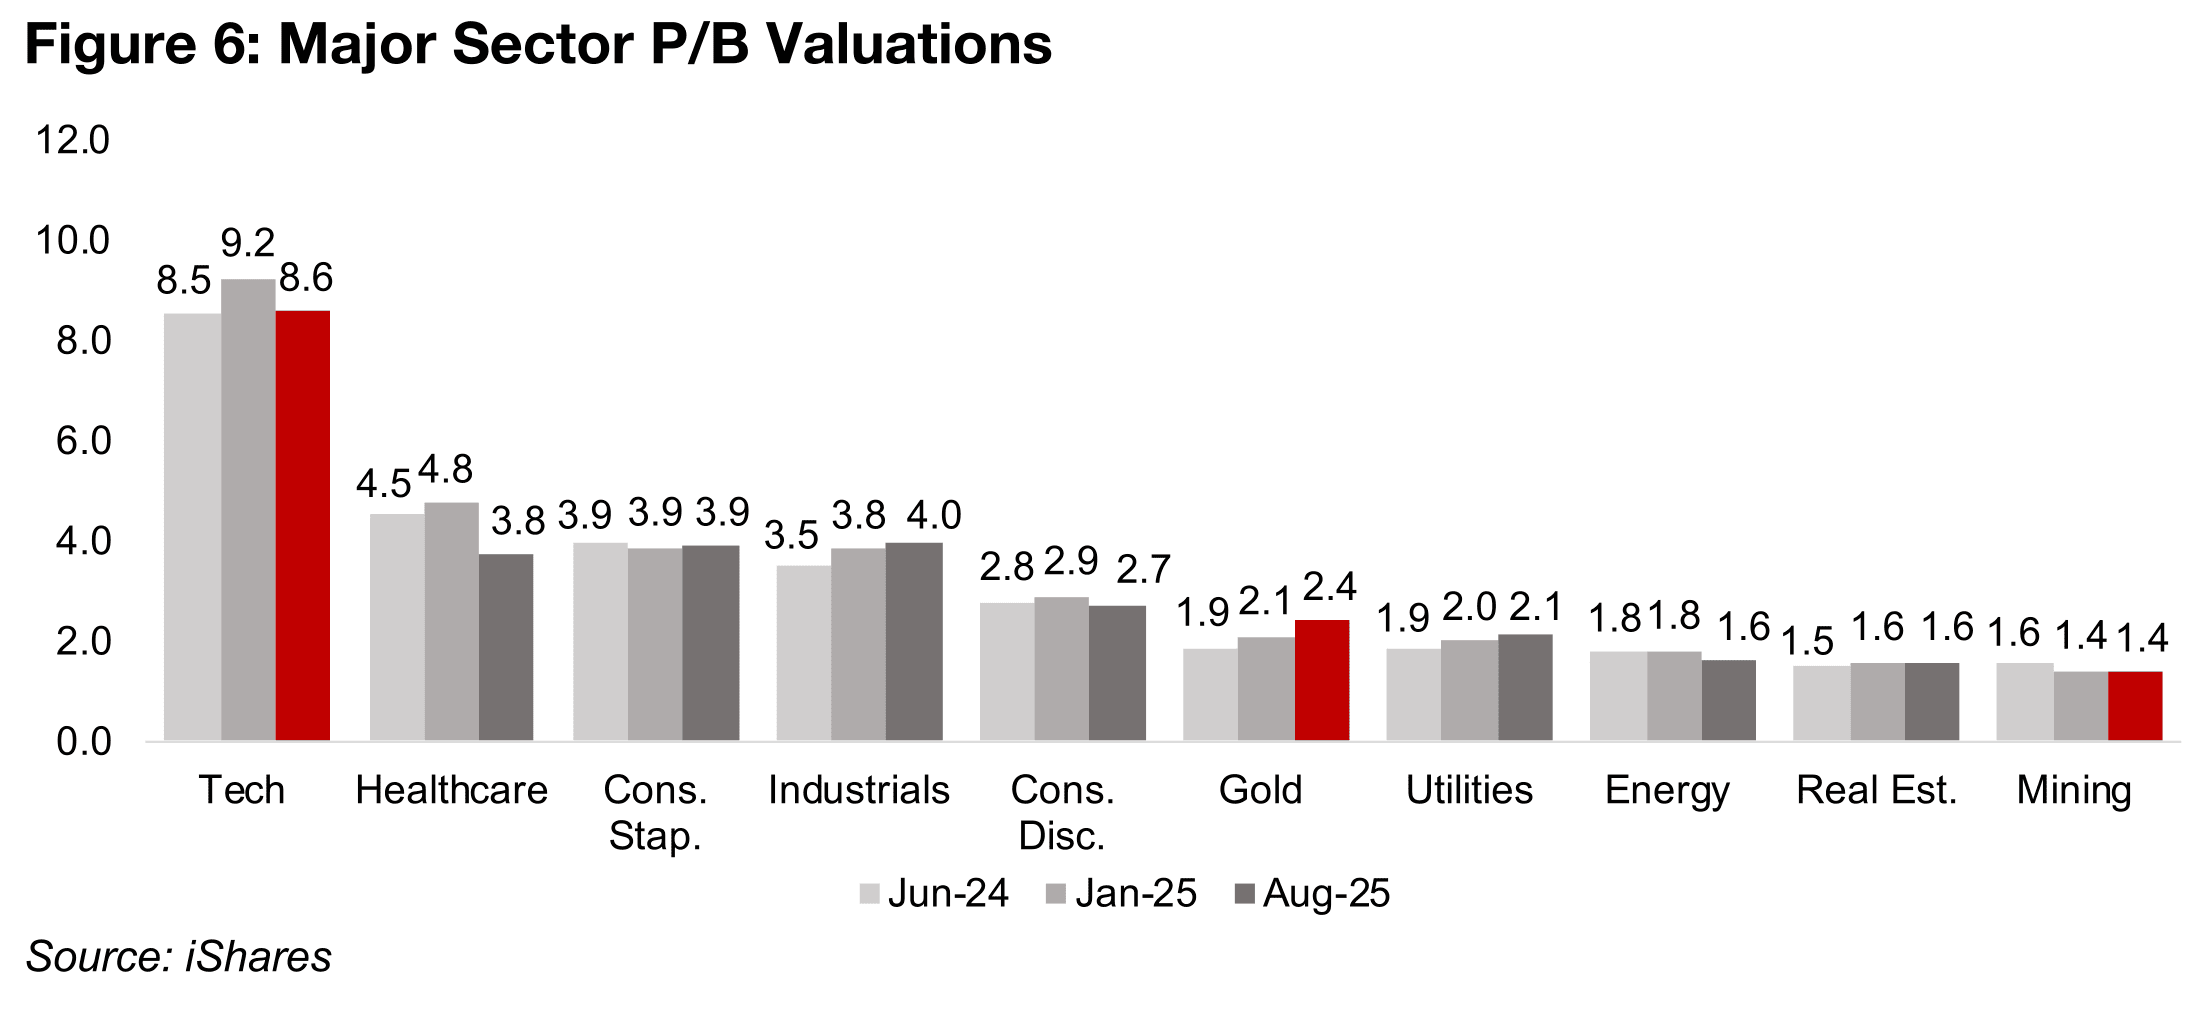
Gold is one of the only major global sectors to have seen a substantial increase in its
multiple over the past year, with the P/B of the GDX up to 2.4x from 1.9x P/B in June
2024, while most other sector P/Bs have either been flat or declined (Figure 6).
However, this still sees its multiple at the middle of the group, with global tech
standing out with for its extreme multiple at over 8.0x, twice the levels of the three
next most expensive sectors which trade at around 4.0x. In this context the gold
sector certainly does not look overly expensive yet, although it could if it starts to
move substantially ahead of a 3.0x P/B. The mining sector overall has the lowest
multiple of the group at just 1.4x mainly on its very high weighting to iron ore. Utilities,
one of the two major defensive sectors in addition to gold, has seen its P/B edge up
to 2.1x from 1.9x in June of 2024. The other, consumer staples, has had a flat P/B
over the past year at 3.9x, although it also started from a much higher base than gold
and utilities.
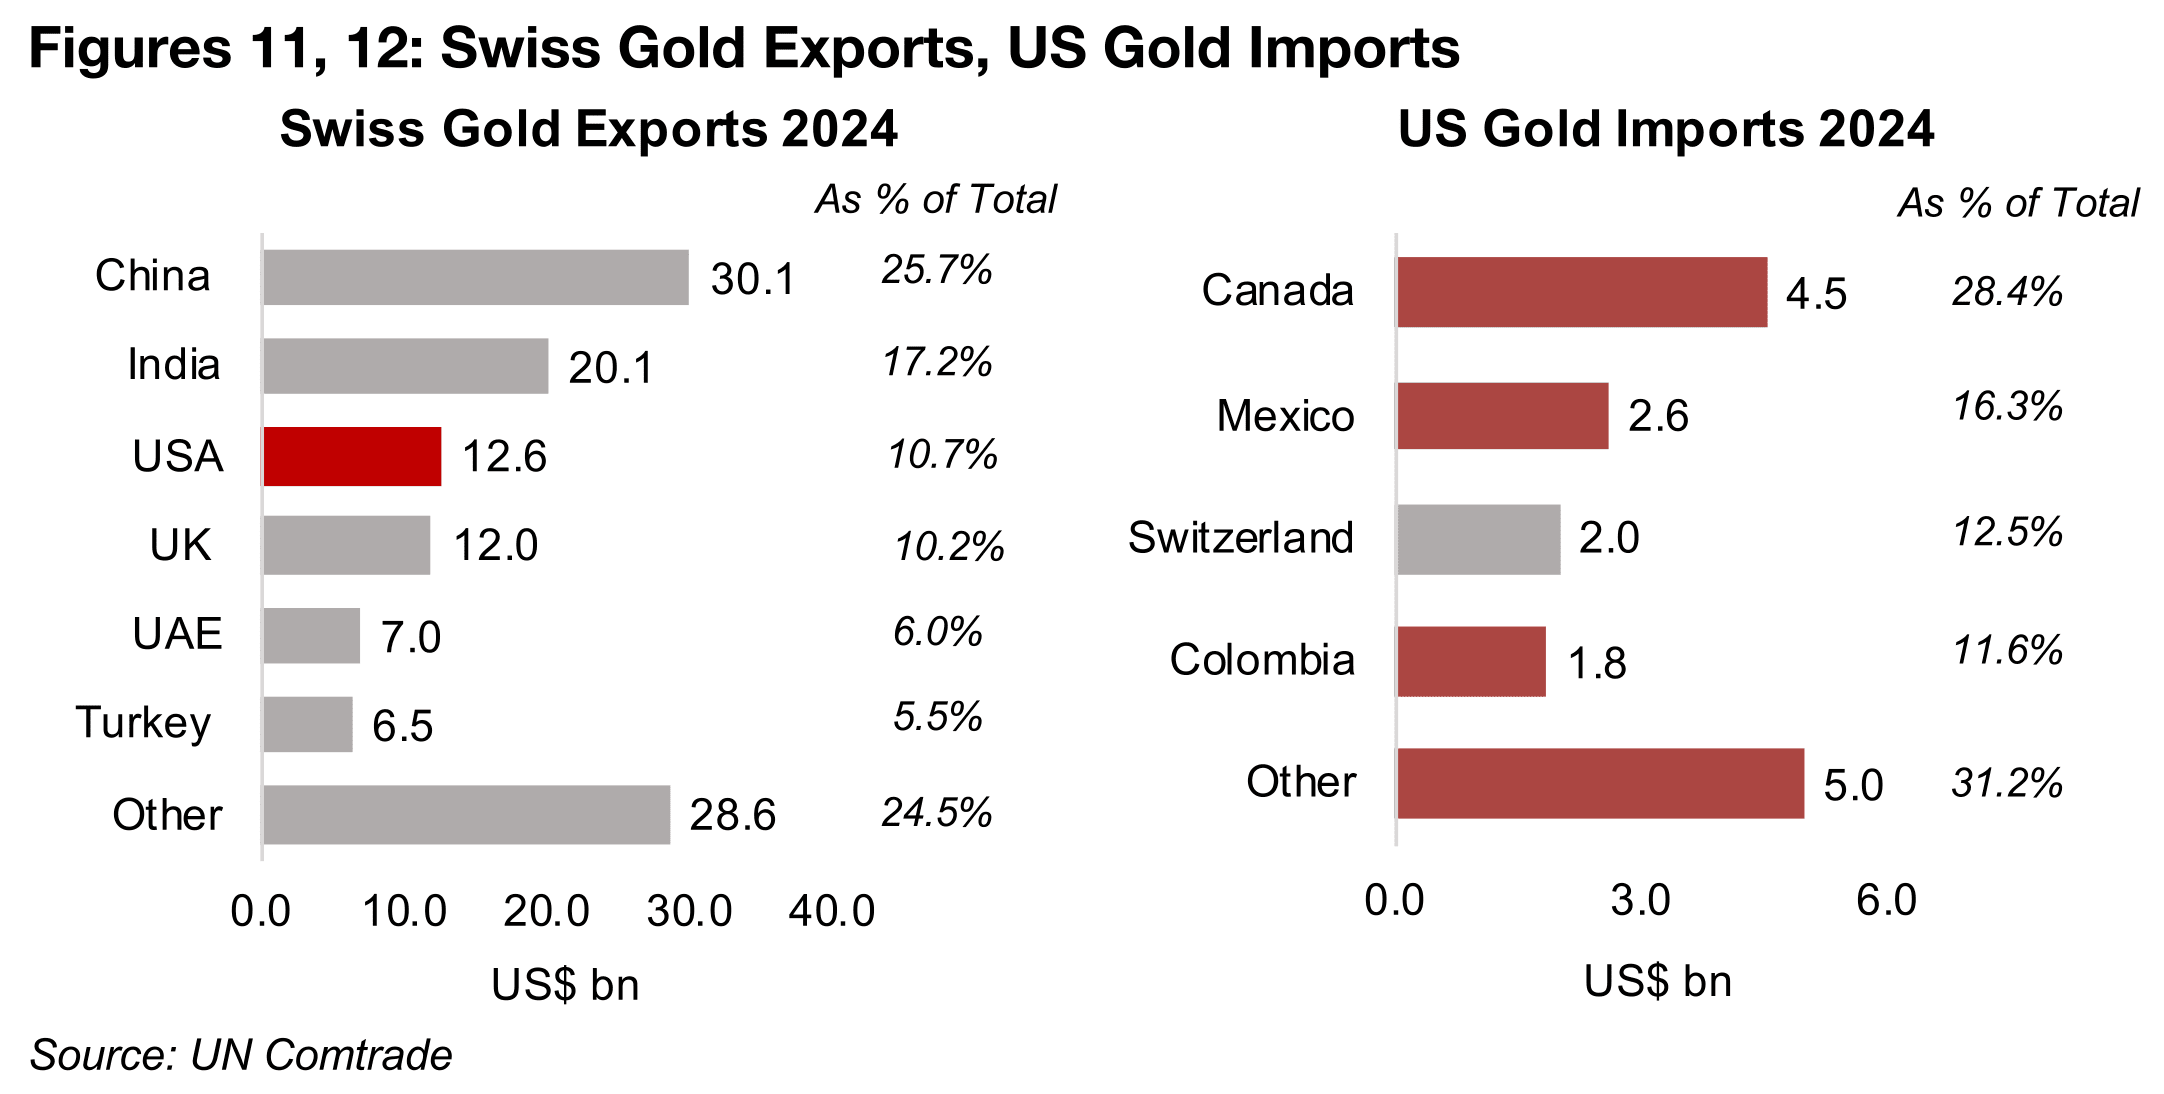
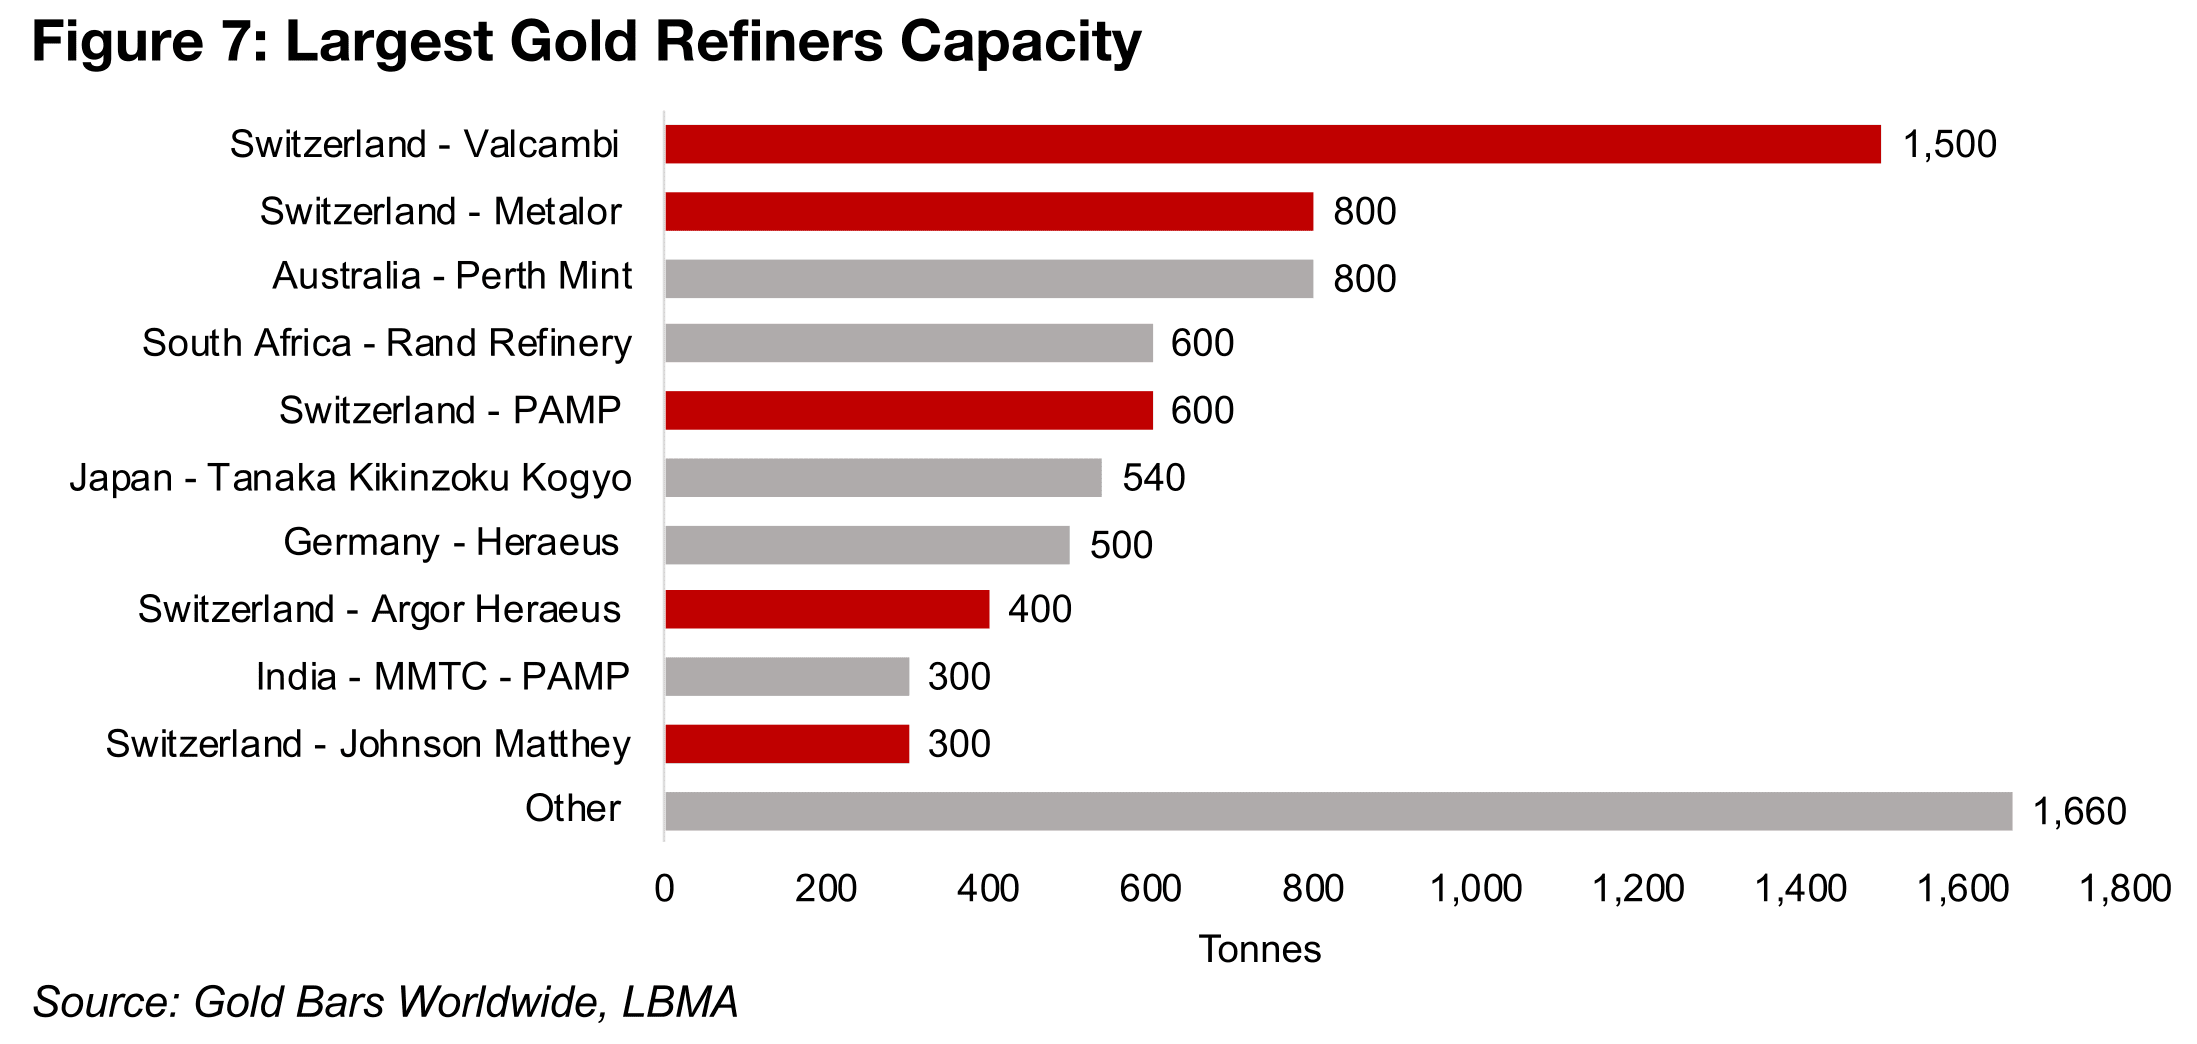
The potential new gold tariffs from the US especially had a negative indication for Switzerland, with the country by far the largest refiner and exporter of gold, with the US one of its major markets for these products. The country’s five major refineries are Valcambi, the largest gold refiner in the world, with a capacity of 1,500 tonnes, Metalor, at 800 tonnes, PAMP, at 600 tonnes, Argor Heraeus, at 400 tonnes, and Johnson Matthey, at 300 tonnes (Figure 7). These five combined have a total 3,600 tonnes of capacity, and account for 45% of the world capacity of 8,000 tonnes (Figure 7). The next largest major global gold refiners are Australia, with the Perth Mint capacity at 800 tonnes and South Africa, with the Rand Refinery having a capacity of 600 tonnes.
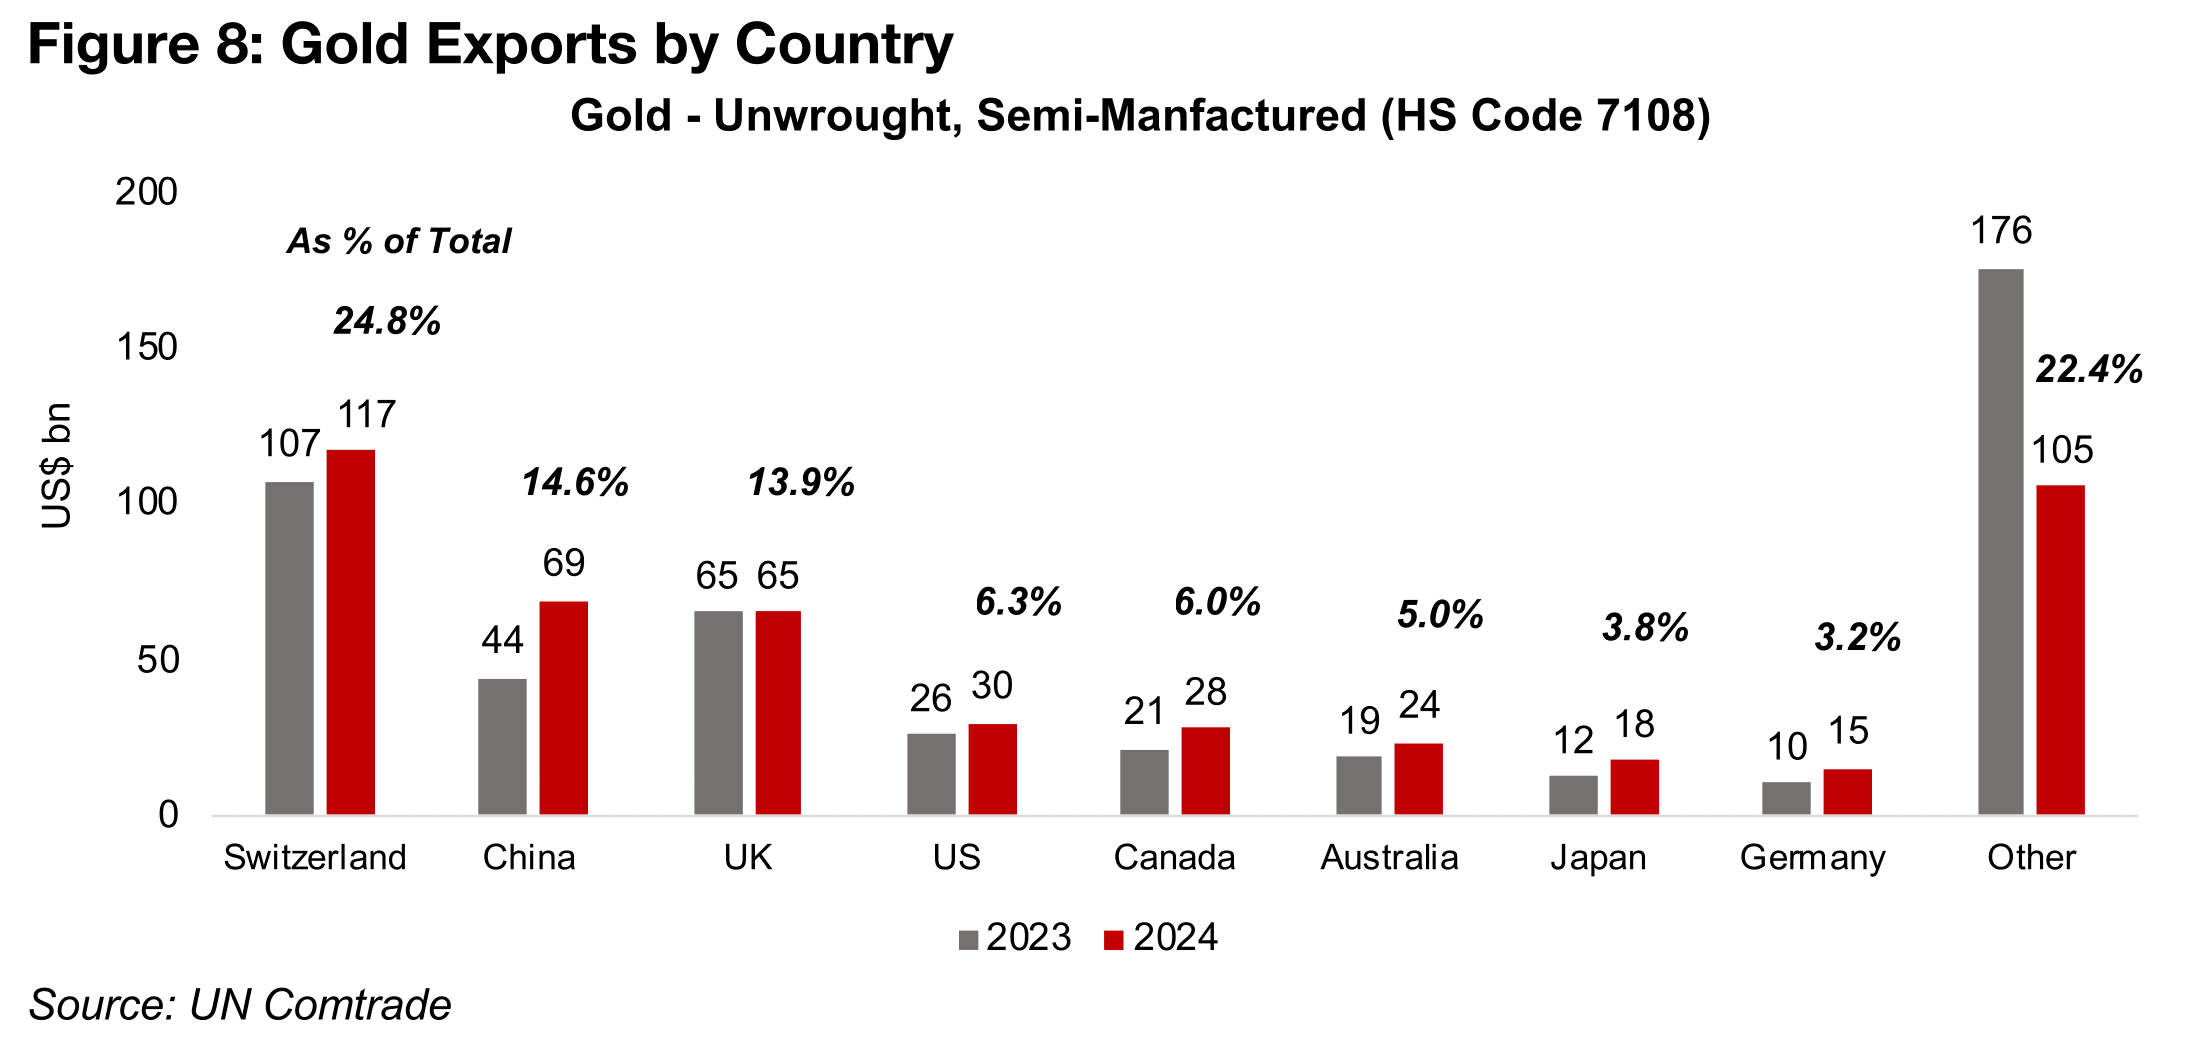
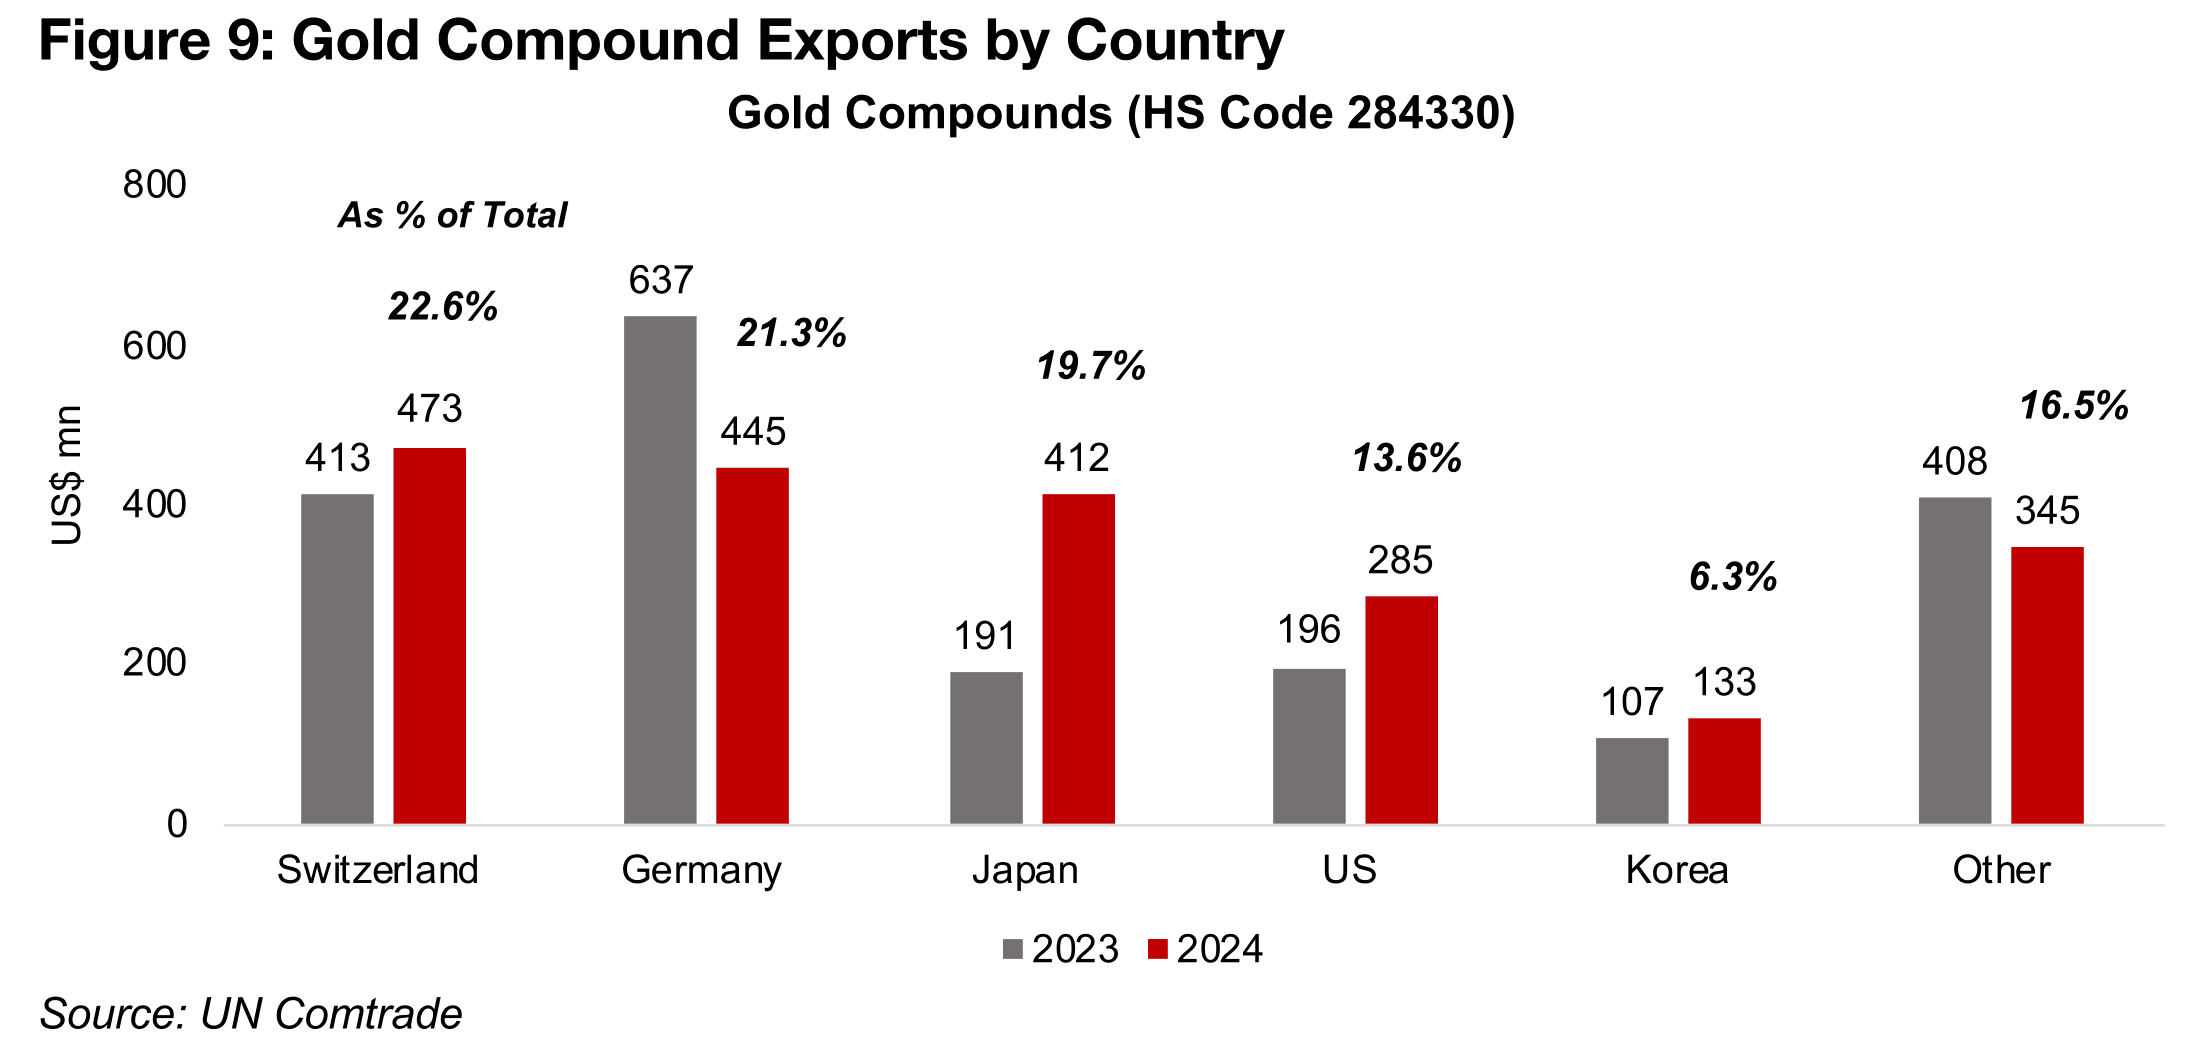
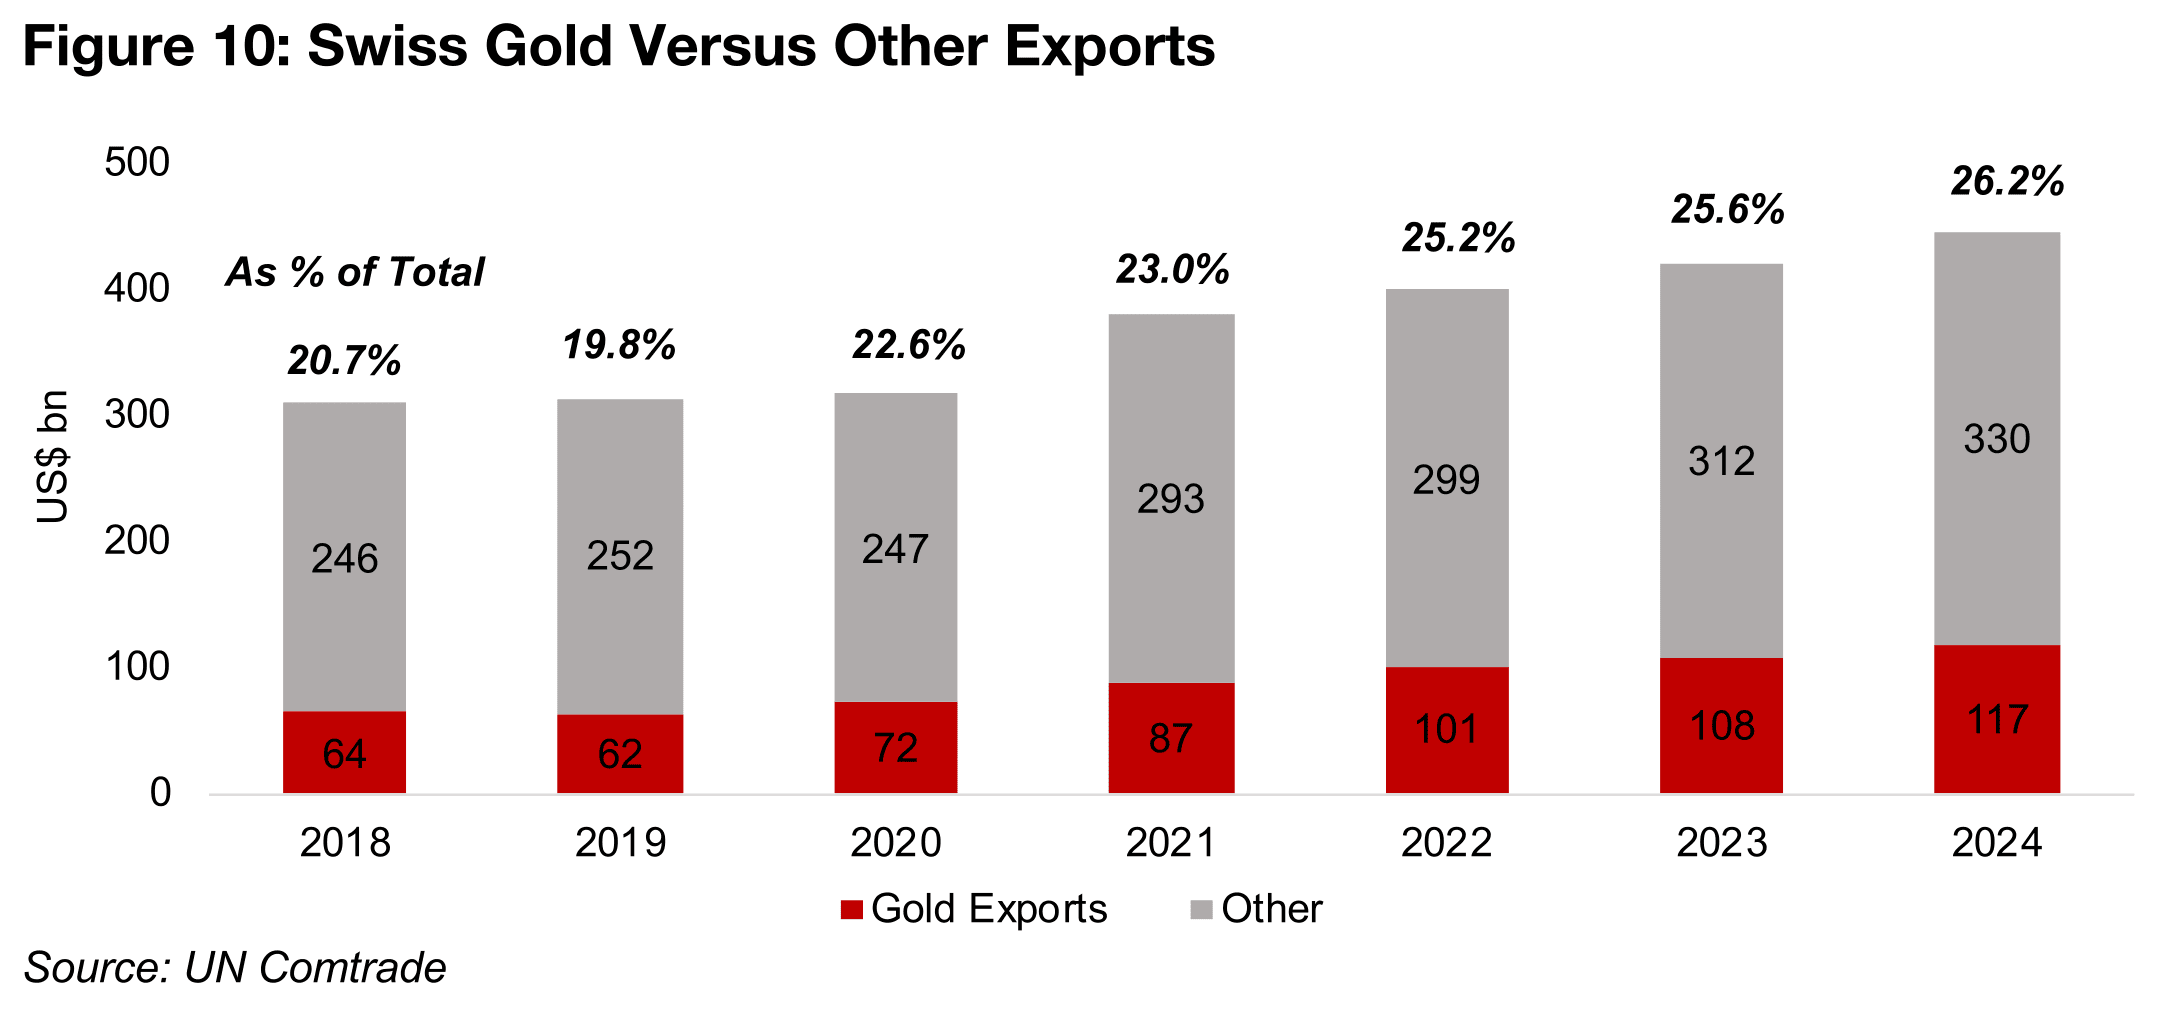
The country exported US$117bn of unwrought or semi-manufactured gold in 2024, based on UN Comtrade data, or 24.8% of the global total (Figure 8). There is a much smaller market for exported gold compounds, with Switzerland also the leader in 2024 at US$0.5bn, at 22.6% (Figure 9). These exports are critical to the country, accounting for 26.2% of total exports in 2024 and averaging 23% from 2018 to 2024 (Figure 10). The US is the country’s third largest market for gold exports, at US$12.6bn in 2024 and Switzerland is the third largest supplier of gold to the US, at 12.5% of the total (Figures 11, 12). There is a discrepancy with these numbers as Switzerland’s exports should match the US imports, but the US figure is more than US$10bn lower. However, such differences in trade data are common and regardless both sets of data indicate that the US is a key market for Switzerland’s gold.
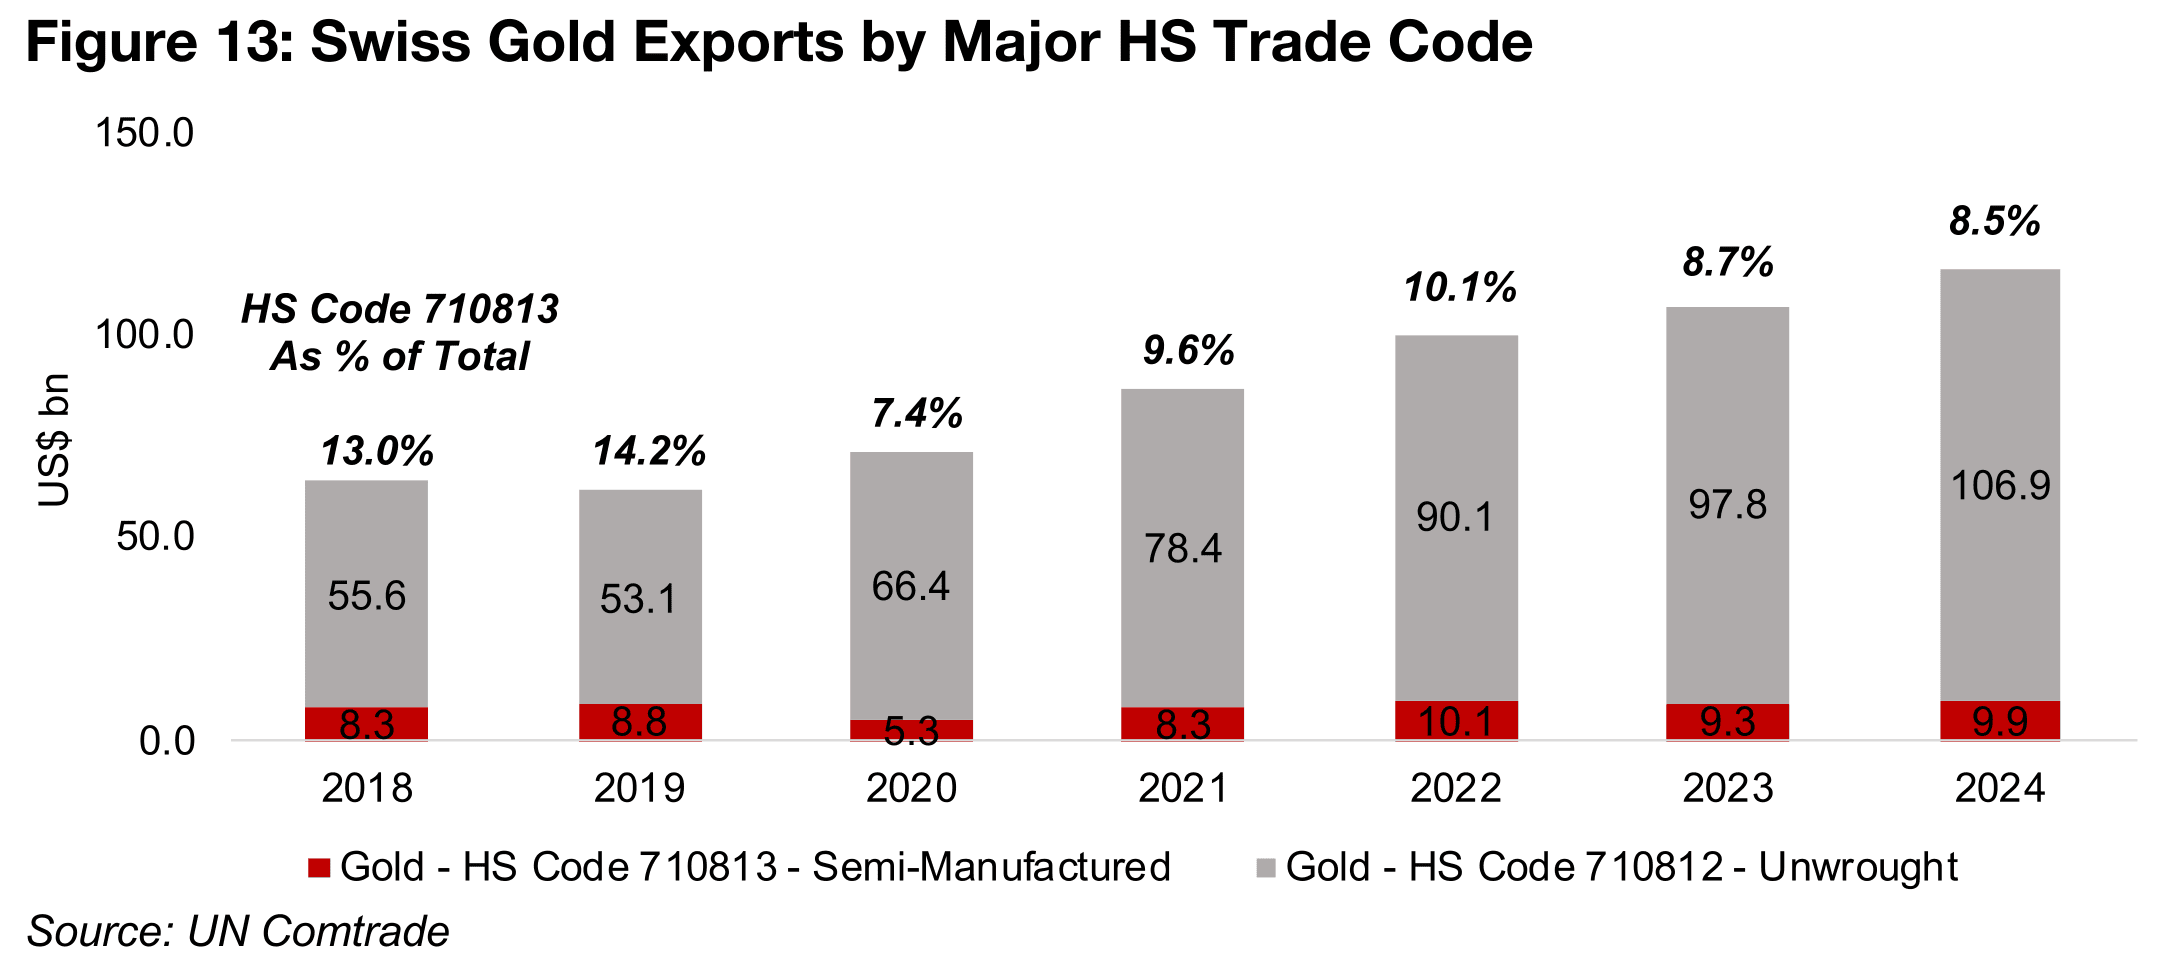
The main issue causing the market concern over potential gold tariffs regards mainly
two trading HS trading codes for gold. Switzerland’s total gold exports are mostly
under the HS Code 710812, which is unwrought gold, which accounted for 91.5% of
the total in 2024, with 71081210 a more specific category under this broader code
(Figure 13). The rest of the gold exports are under HS Code 710813, for semi-
manufactured gold, which accounted for just 8.5% of gold exports in 2024, with a
71081355 a more specific category under this code. The current US trade terms
indicate that tariffs do not apply to the unwrought bullion under 710812, or the
majority of US gold imports, but are applied to semi-manufactured gold imports.
The majority of gold in the US is traded on the Comex in units of one-kilo and 100-
ounce bars, which mainly is under the unwrought 71081210 code. The shock to the
market came when the US Customs appeared to be changing the definition for these
standard bars from unwrought to semi-manufactured, or coming under the 71081355
code. This would imply that Switzerland could face tariffs on nearly all its gold exports
to the US, up from just under 10% previously. This has already led the country to
starting diverting gold exports away from the US to other markets and driven a jump
in the metal price. The US government has subsequently indicated that the majority
of gold exports would not face a rise in tariffs, and an executive order would be
released to clarify the issue, although there still has been no further announcements.
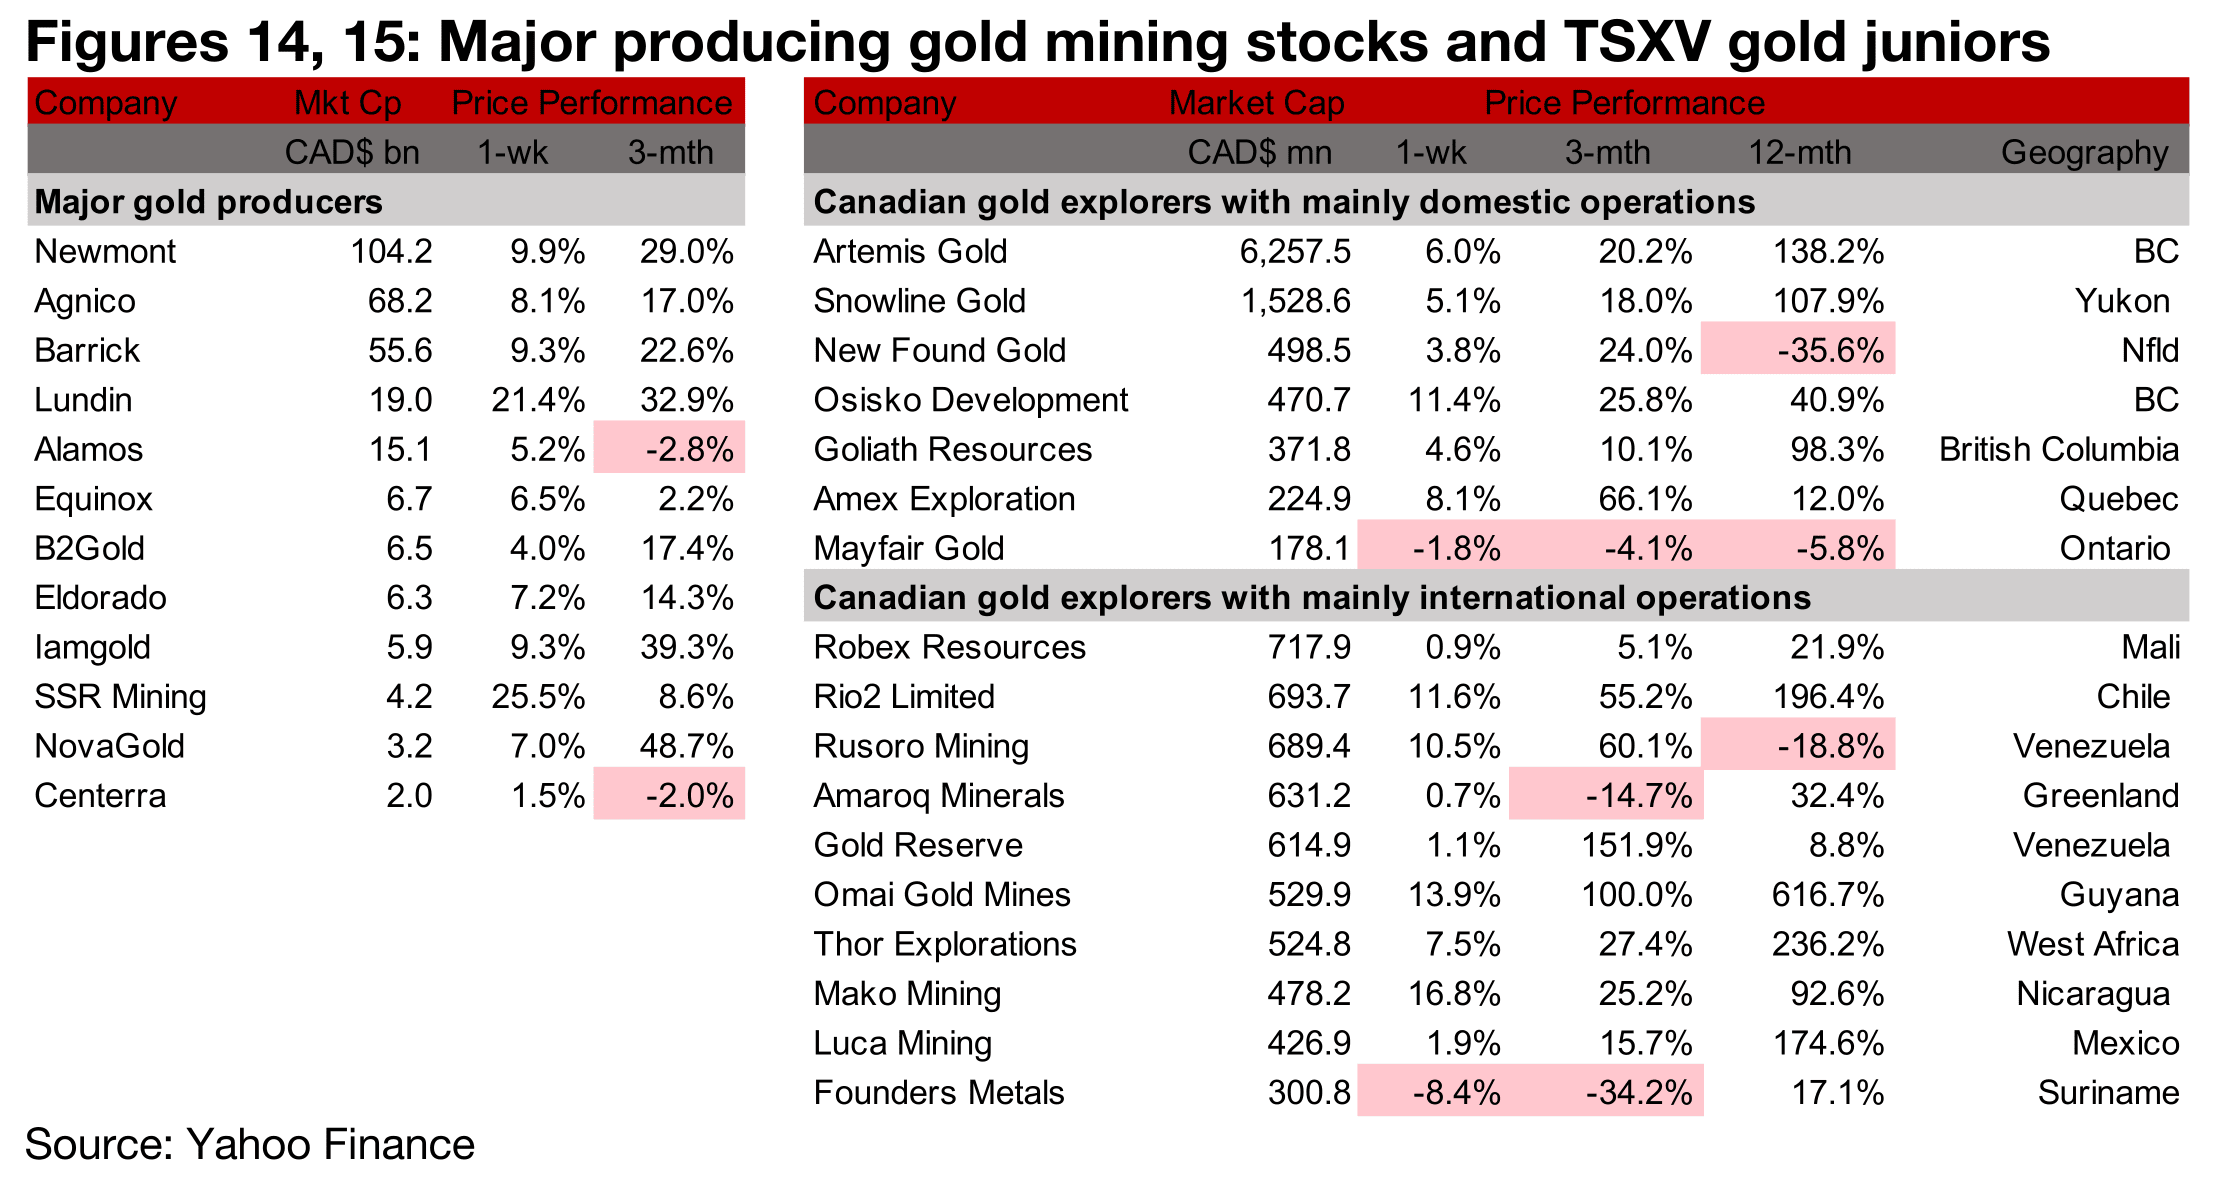
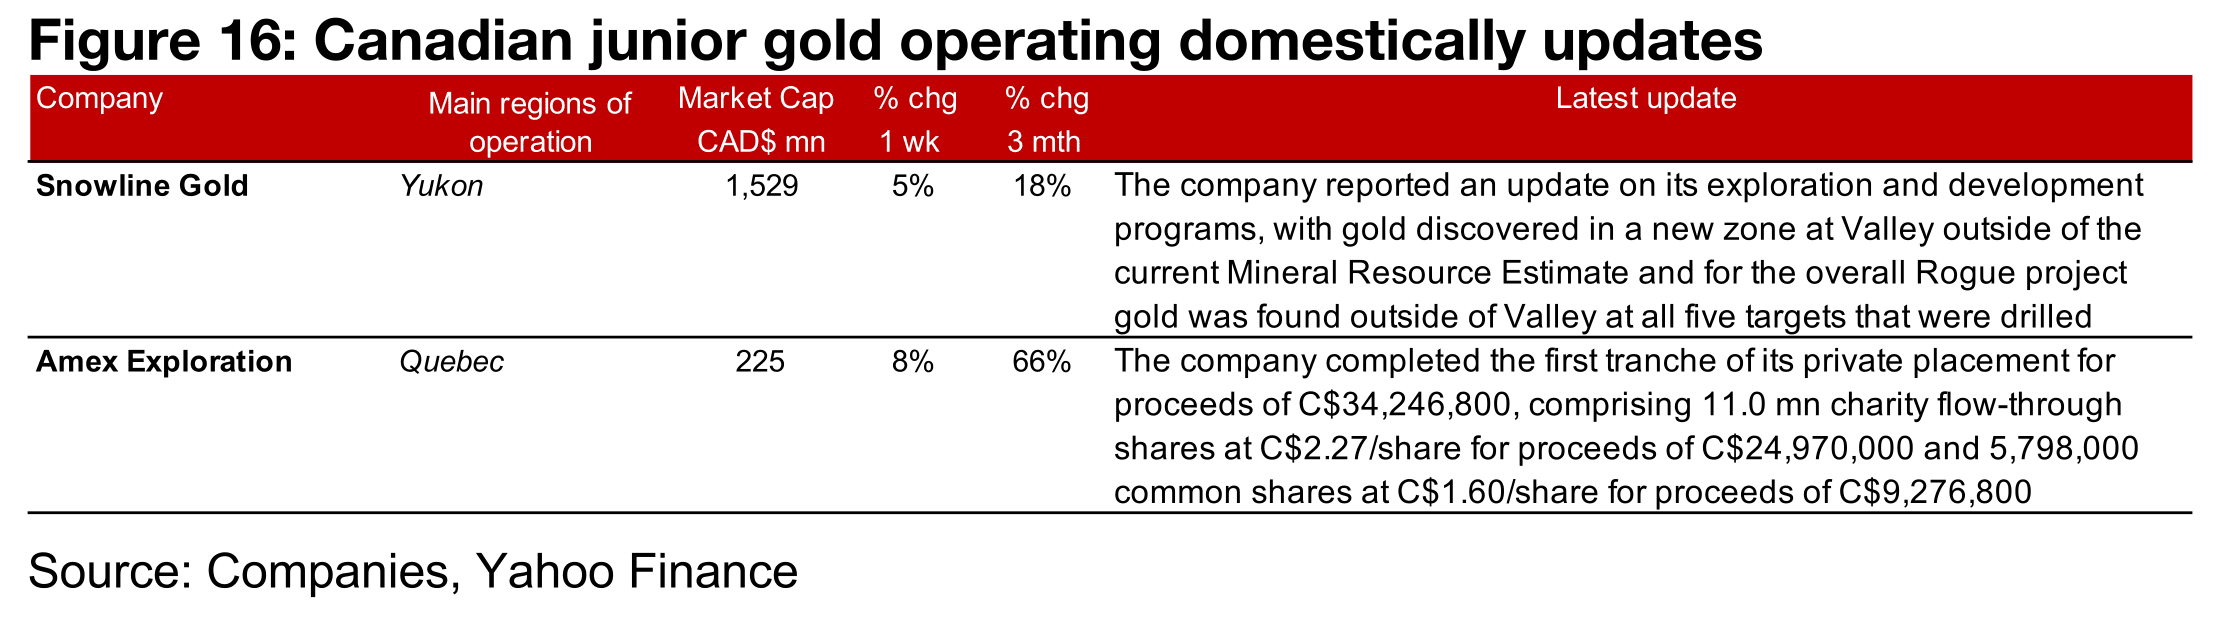
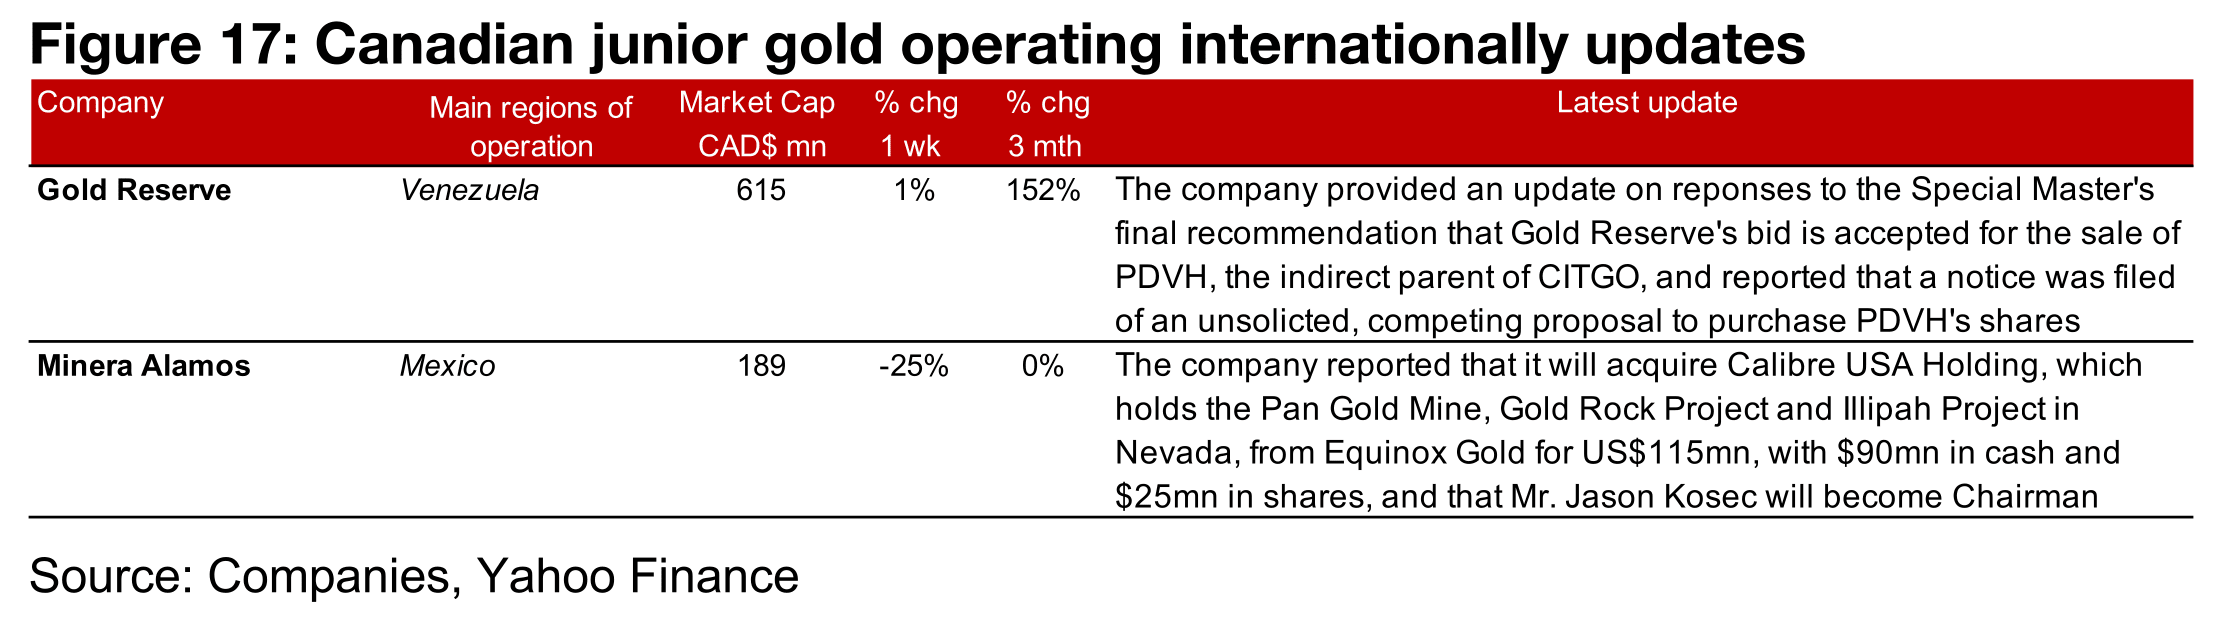
There were some major gains for some producers, with two up over 20%, while almost all of the TSXV gold stocks rose, with several up more than 10% (Figures 14, 15). For the TSXV gold companies operating mainly domestically, Snowline reported an update on its exploration and development at the Rogue project, with a new zone discovered at Valley and gold found at five other targets and Amex Exploration completed the first tranche of its private placement (Figure 16). For the TSXV gold companies operating mainly internationally, Gold Reserve provided an update on responses to the Special Master’s recommendation that the company’s bid is accepted for the PDVH sale and reported that a notice was filed of an unsolicited, competing proposal and Minera Alamos reported that it would acquire Calibre USA Holding, which holds the Pan Gold Mine, Gold Rock Project and Illipah Project in Nevada (Figure 17).
Disclaimer: This report is for informational use only and should not be used an alternative to the financial and legal advice of a qualified professional in business planning and investment. We do not represent that forecasts in this report will lead to a specific outcome or result, and are not liable in the event of any business action taken in whole or in part as a result of the contents of this report.
Author
Ben McGregor authors the Weekly Roundup at CanadianMiningReport.com, providing sharp analysis of the metals and mining sector. With a talent for spotting trends, Ben distills complex market shifts into clear, engaging insights on TSXV junior miners. His weekly updates cover gold, copper, uranium, and more, blending data-driven perspectives with a knack for identifying opportunities. A vital resource for investors, Ben’s work navigates the dynamic junior mining landscape with precision.