
July 18, 2022
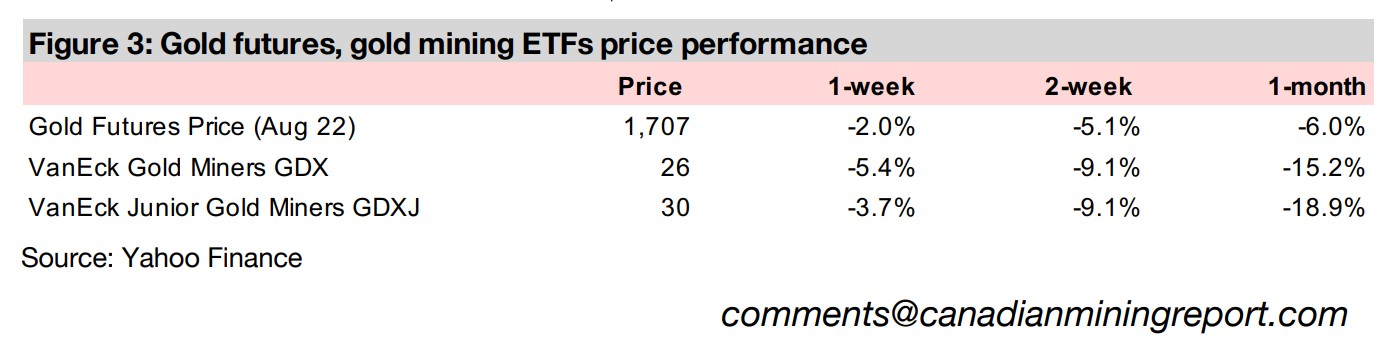
Gold declined -2.0% to US$1,707/oz as US inflation shocked again, rising to 9.0%, marking yet another four-decade high, with the market likely expecting the news to further embolden the US Fed to continue its current aggressive rate hike path.
While gold price's recent slide is concerning, it is still very high in the context of the past decade and out of any 'Danger Zone' for the industry, which we provide a rough measure for this week using the gold price to AISC spread for Newmont and Barrick.
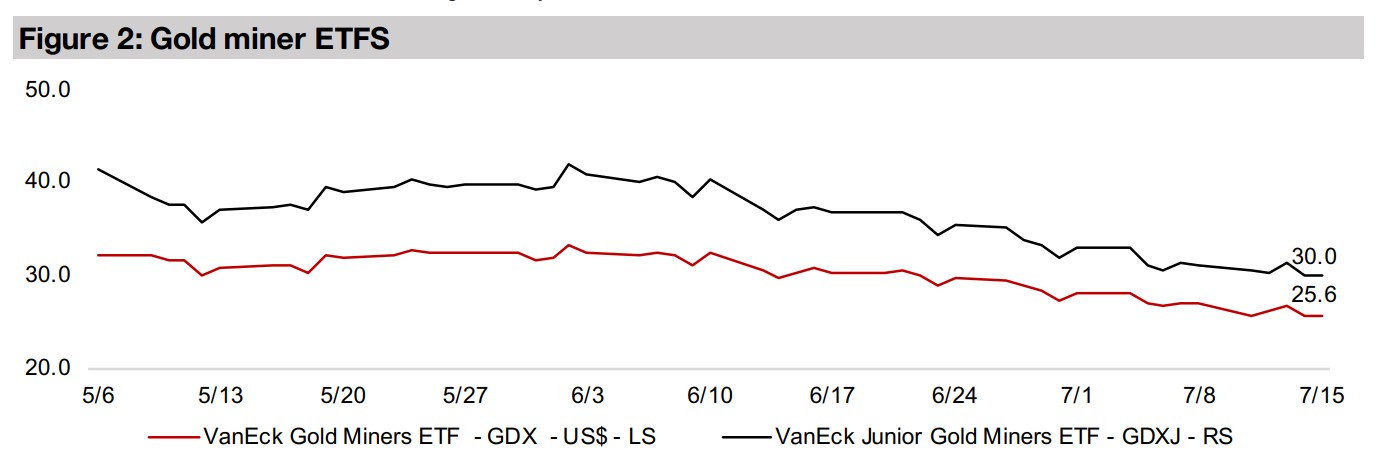
The producing and junior miners dropped, with the GDX sliding -5.4%, the GDXJ down -3.7%, and the larger TSXV-listed Canadian junior gold stocks mostly down on the continued slide in gold, even as broader equity markets were flat this week.


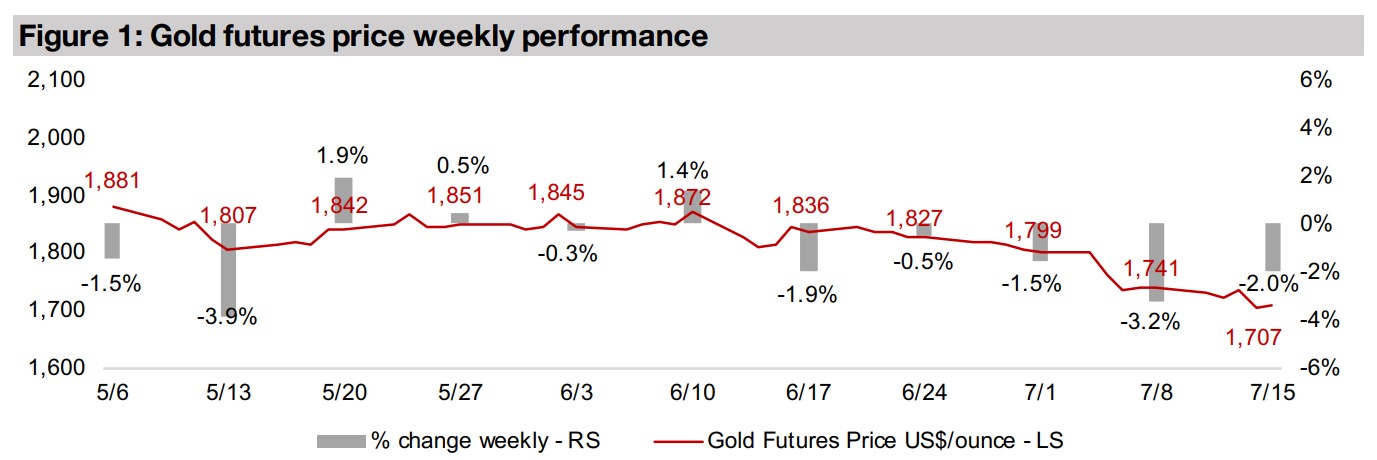
Gold declined -2.0% for the week to US$1,707/oz and is now down -8.8% from its
high of the past two months, at US$1,872/oz, five weeks ago. While this is obviously
concerning for gold and gold stock investors, this week we put this recent decline
into a longer-term context and determine that we are far from entering a 'Danger Zone'
for the gold price and the overall industry. We also believe that there are several
factors that are likely to prevent the industry from entering the 'Danger Zone', even if
gold sees continued pressure short-term, which we acknowledge is a possibility. The
main worry for gold investors currently will likely be whether we are about to have a
repeat of the situation we saw from 2008 to 2013, where there was a major ramp up
in gold and then a collapse.
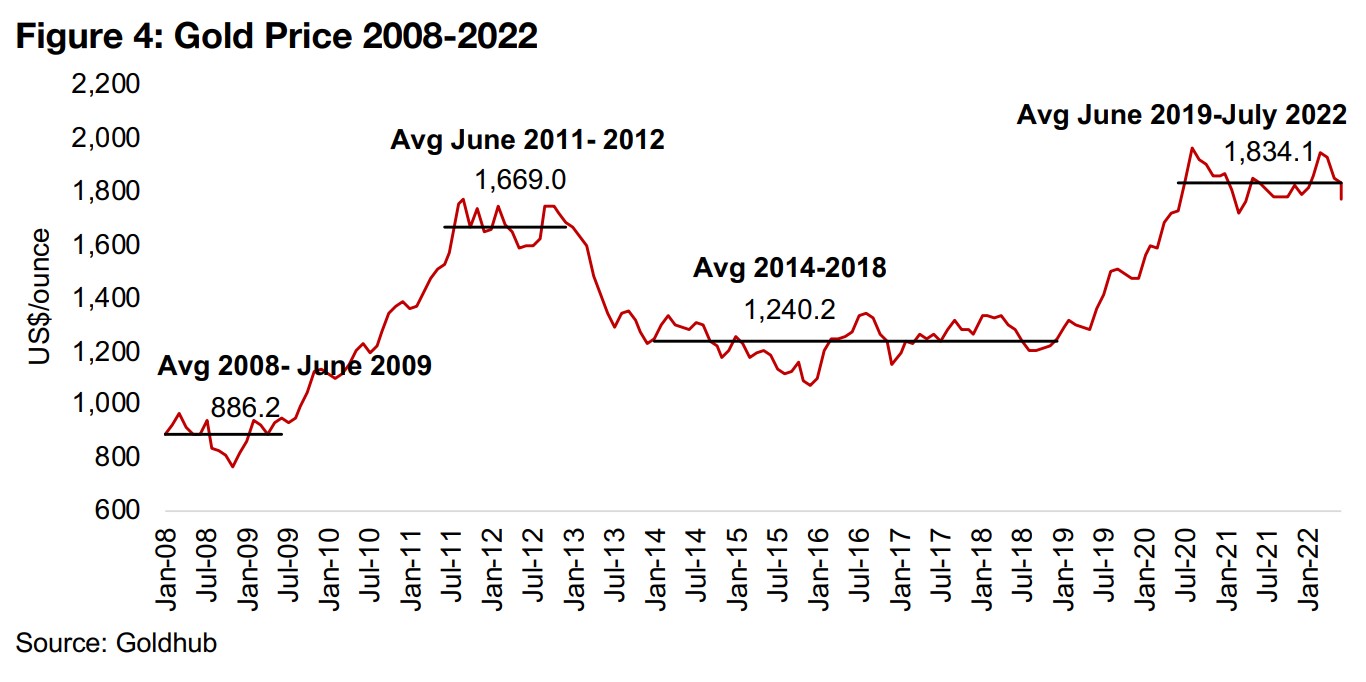
Gold averaged just US$886.2/oz from 2008 to June 2009 in the depths of the global
financial crisis, then more than doubled to an average US$1,669.0/oz from June 2011
to the end of 2012, and then plunged into a long gold bear market from 2014-2018,
averaging just US$1,240.2/oz (Figure 4). While the gold price surged again to an
average US$1,834.1/oz from June 2019 to July 2022, with the gold price slipping
firmly below this average so far in July, some investors may be concerned that the
downward trend may continue, similar to 2013. However, the period from 2014 to
2018, was a very unique one, with a massive monetary expansion that drove strong
economic growth and a surge in equity and other asset markets but did not lead to
much CPI inflation globally. This is obviously in stark contrast to the four-decade
highs we are currently seeing in inflation. It was also a period of relative geopolitical
stability compared to the one we are in now, where risk was perceived as quite low.
Gold tends to do well in times of high inflation, as it is a currency that cannot be
inflated away and also acts as a general risk hedge. With both inflation and general
risk having spiked in the past few years, and not likely to subside anytime soon, the
underlying macro conditions now seem quite supportive of gold and are entirely
different to that of the last gold bear market. Therefore, while we do acknowledge
that gold could continue to dip in the short-term, and drag down gold stocks with it,
we do not expect another long gold industry bear market to be developing.
Given this context, below we also show that the giants Newmont and Barrick, which
could be considered to demonstrate the outlook for the industry overall, are
performing strongly and extremely well cashed up. This has a strong read across for
junior gold miners, which even as their share prices have been smashed by the
broader decline in equity markets, are becoming less expensive acquisition targets
for the majors, which are in perpetual need of new finds to offset depletion. In contrast
to 2014-2018, we do not expect the next few years to be a rosy period where risk
hedges are almost completely eschewed, but rather one where risk will be rising, with
gold's properties as a safe-haven becoming of far more interest to investors, and also
gold stocks, as it becomes clear how undervalued they have become.
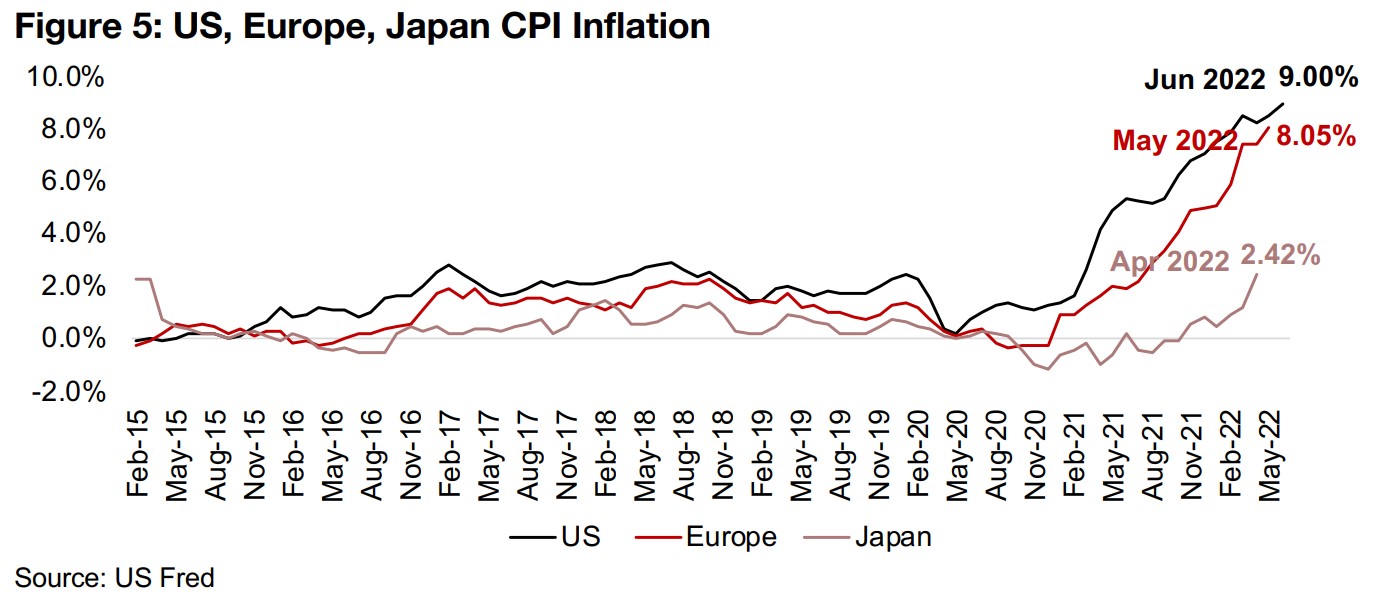
In the immediate term, however, gold could well continue to take a hit, with the recent decline mainly driven by expectations that the Fed's aggressive rate hikes to fight inflation will continue. US CPI inflation rose to 9.00% in June 2022, putting paid to expectation that price rises might have been cooling after they had flattened over the past three months (Figure 5). Global inflation has also continued to rise, with Europe now almost catching up with the US, at 8.05% as of the most recently reported May 2022 data, and even perpetually deflationary Japan has reached 2.42% in April 2022.
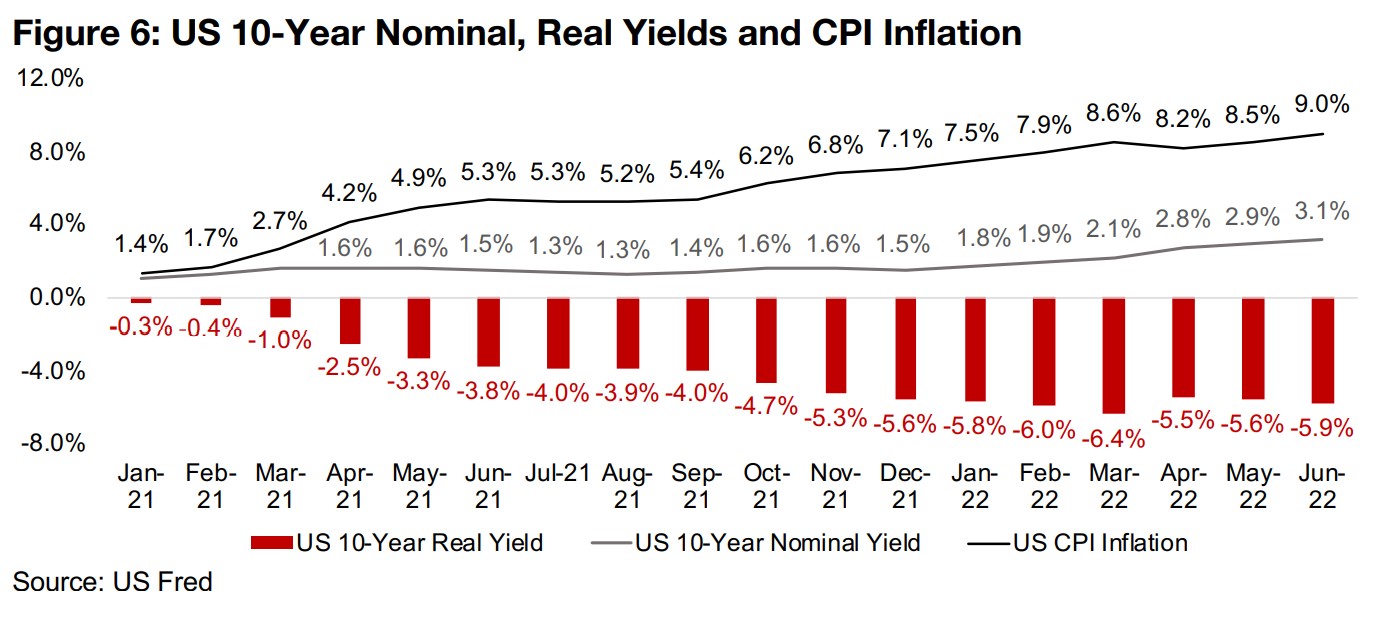
Theoretically the Fed's rate hikes can hit gold in a few ways. First, gold could be
considered in competition with bonds for fund flows. As real yields rise on bonds, we
would expect investors to move into them and away from yieldless gold. With 10-
year real yields plummeting from -0.3% in January 2021 to a low of -6.4% in March
2022, the opportunity cost of holding gold or gold ETFs, with only a 1.0%-2.0%
storage or holding fee, became far lower, making bonds increasingly less attractive
and therefore supporting the gold price (Figure 6). However, with the Fed's major rate
hikes starting from March 2022, these yields became substantially less negative,
rising to -5.5% in April and -5.6% in May. While this was still not a great return, it was
relatively more attractive, which could have pressured gold.
However, with the most recent inflation numbers, we see again the US 10-year real
yield getting more heavily negative, down to -5.9%, which would suggest a rise in the
gold price, not the abrupt decline we have seen in recent weeks. This is evidence that
while the Fed is aggressively hiking rates, it is still playing a game of catch up with
inflation, and we believe that if we see another couple of months of such a trend of
increasingly negative real yields, that the gold price could see support.
Second, we have the rising interest rates driving up the US$, as global investors
chase the currency's high relative yields, as the central banks of both Europe and
Japan have not yet begun a rate hike cycle. However, it seems likely that with inflation
also clearly ramping up in these regions, that both could need to also start hiking
rates, making the US$ relatively less attractive, and its potential decline could boost
the gold price, with gold tending to move inversely to the US$.
So while both of these drivers could potentially weigh on gold for the next few months,
we see just as much room for a turn around where these factors become positive
drivers for the gold price. Also, over the medium-term there is a major question of
when the fallout from the Fed's aggressive rate hikes starts to become politically
unfeasible. There is already a plunge in the equity markets and there are increasing
concerns that we may already be in the midst of an overall economic decline which
could be showing up in the data soon. The rate hikes will also be putting pressure on
the US government's servicing of its massive debt, with just a rise in rates to around
5.0% potentially driving debt service up to the largest single line item in the US
Federal budget.
And as we have seen, even US 10-year yields already at over 3.0% have failed to
actually curb inflation, and historically the Fed Effective Funds Rate has had to near
equal inflation before it is completely brought under control. Given the negative
effects already caused by just 3.0% rates, it seems that the problems caused by a
spike to 9.0% would be untenable and cause more damage than the actual inflation
itself. Given all this, we expect that as early as 2023, the Fed will be forced to pull
back on its aggressive hikes and move to easier monetary policy. Coupled with the
massive market and economic fallout that may have been caused by then, gold could
again find very strong support as a both a hedge against a likely renewed monetary
expansion and broader rising risks.
Even given the above factors in favor of gold, nonetheless we can consider the
downside where gold does continue to drop for the rest of 2022 to determine where
we might see the start of the 'Danger Zone' for the gold industry. We use Newmont
and Barrick as our proxy for the gold industry overall, given their very high combined
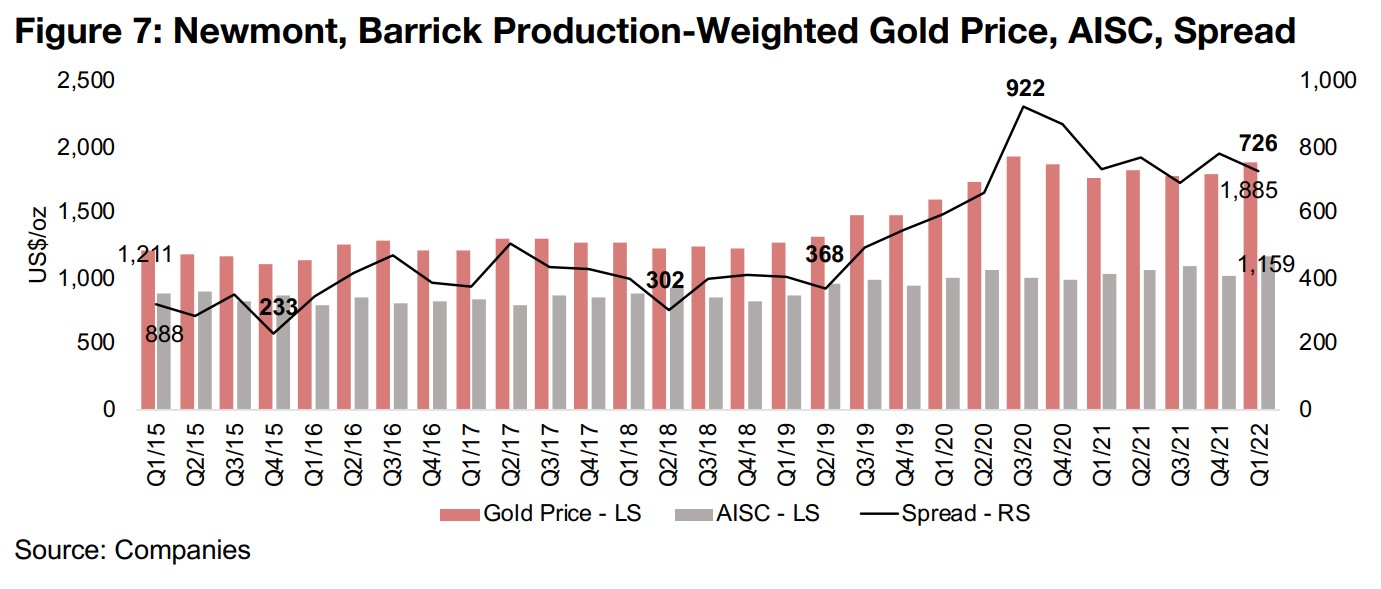
share of the global gold production. Looking at the spread between the realized gold
price and the all-sustaining cost per ounce using an average for Newmont and Barrick,
weighted by production, we can see that a very bullish period for the industry started
around Q3/19.
The spread rose from just US$368/oz in Q2/19 to peak at US$922/oz by Q3/20 and
was still at a high US$726/oz in Q1/22, compared to the US$379/oz average in the
gold industry bear market from 2015 to Q2/19 (Figure 7). This US$379/oz spread
gives us roughly the target level of the 'Danger Zone' for the industry, and we can
consider what it would take to get there again. First there is cost inflation, and
applying the most recent US CPI inflation rate of 9.0%, we could see the AISC rise
from US$1,159/oz in Q1/22 to US$1,263/oz. If we further assume a -15.0% drop from
the US$1,885/oz average of Q1/22 to US$1,600/oz, this would see the spread decline
to US$336/oz, or around the 'Danger Zone' levels of the 2015 to Q2/19 average.
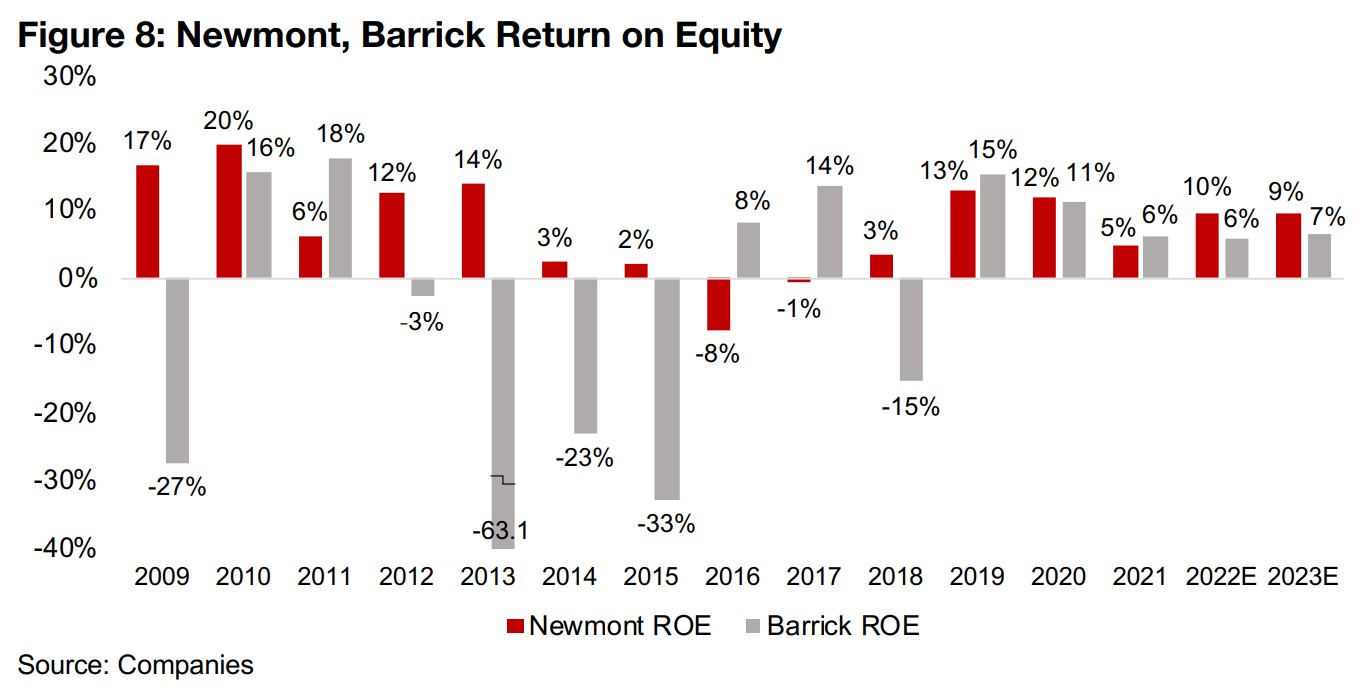
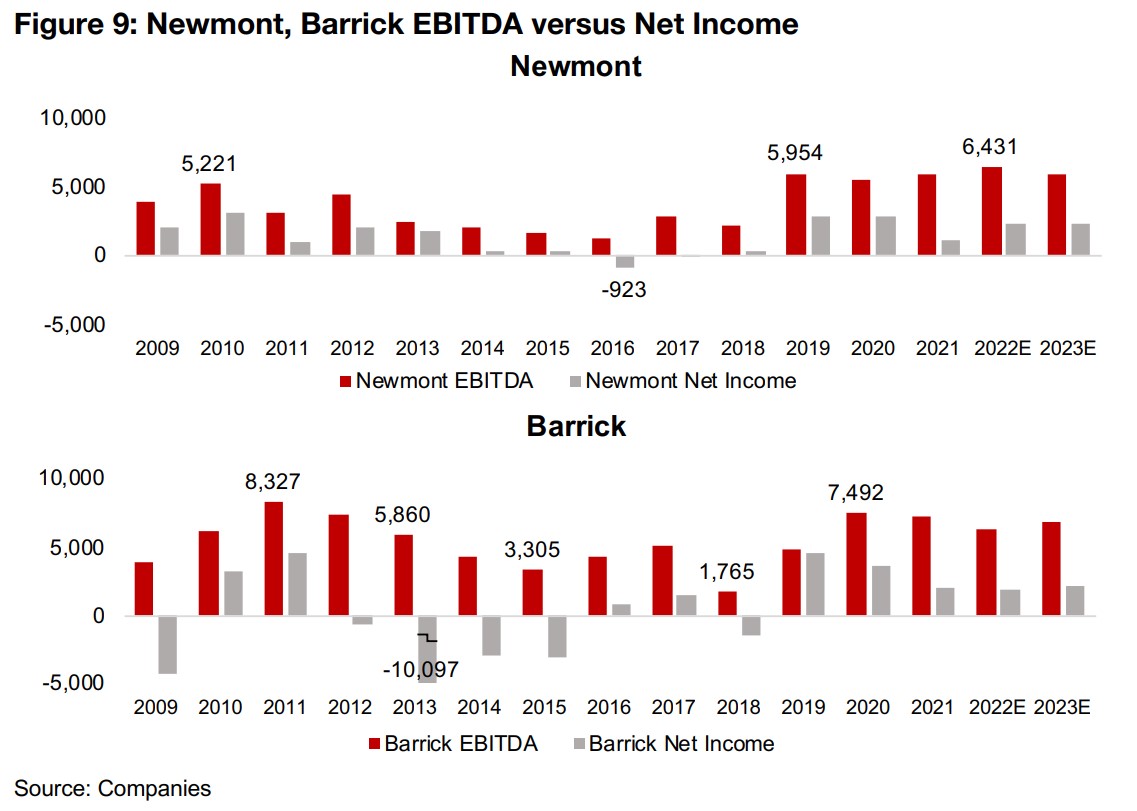
Newmont and Barrick's return on equity during the worst of the last gold bear market were very weak, with especially Barrick getting hit with multiple years of heavily negative returns from 2013 to 2015, and Newmont's returns were near or below zero from 2014 to 2018 (Figure 8). However, return on equity is calculated using the net income of the company, which can contain significant non-cash items, often in the form of exceptional write downs of operations where the cash costs have already been incurred. If we look at the EBITDA, or earnings before interest, taxes, depreciation and amortization, which is a proxy for the cash generation of the company before any exceptional write downs, both Newmont and Barrick's cash generation remains strong even through the bear market, where net income and therefore return on equity were very low (Figure 9).
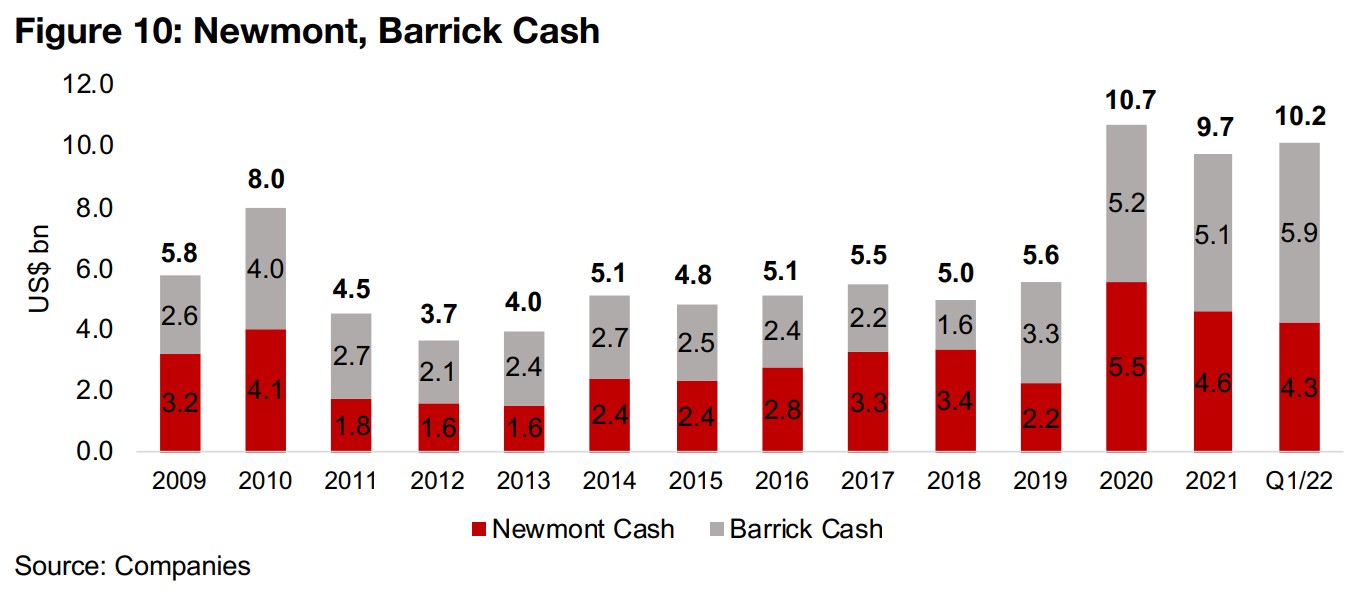
Both Barrick and Newmont are well cashed up, with a combined US$10.2bn on their balance sheet as of Q1/22, double the average level from 2011 to 2019 (Figure 10). While this would help support both companies weathering any move toward to 'Danger Zone' we have outlined above, it also bodes well for continued investment in the junior mining sector, as Newmont and Barrick will be looking to deploy this capital in new projects to offset ongoing depletion of its reserves.
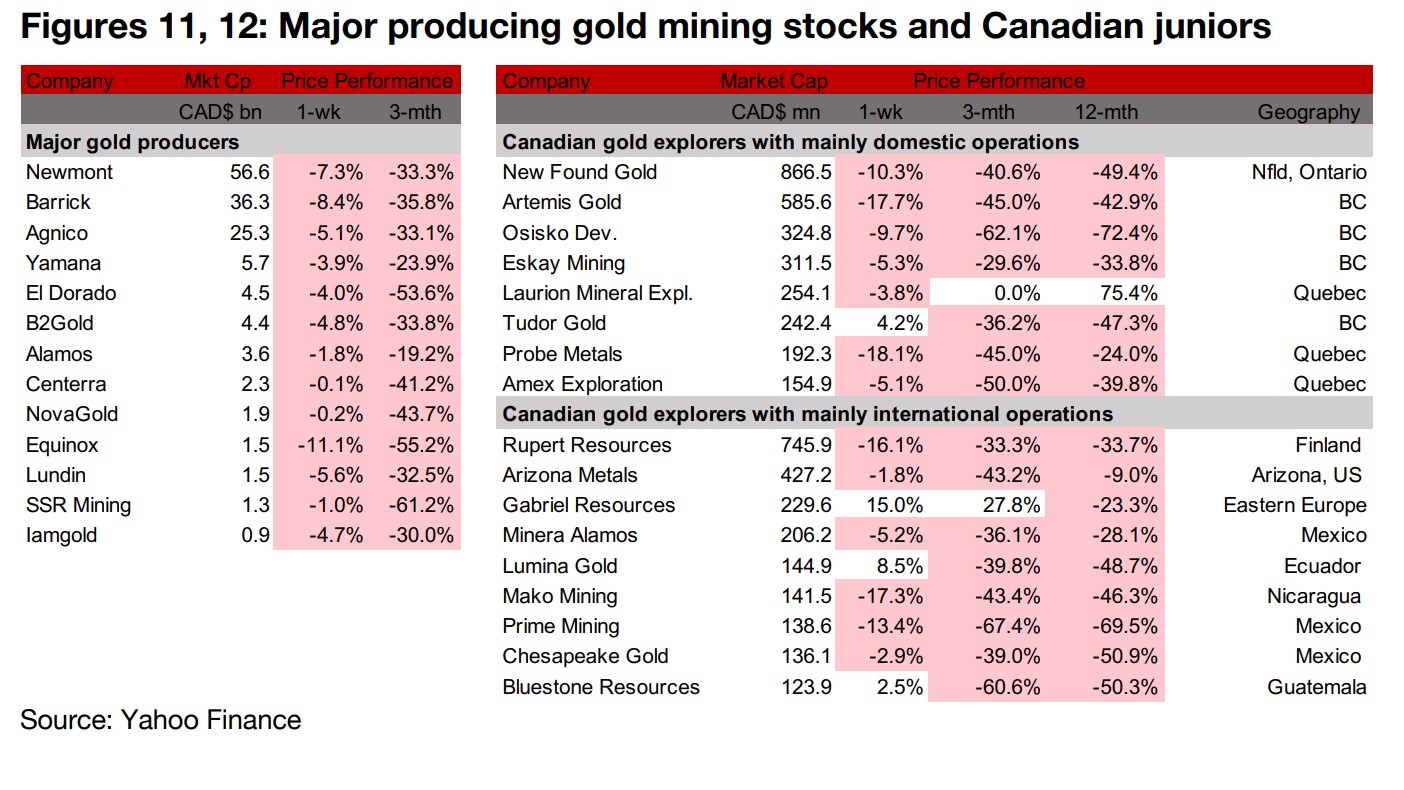
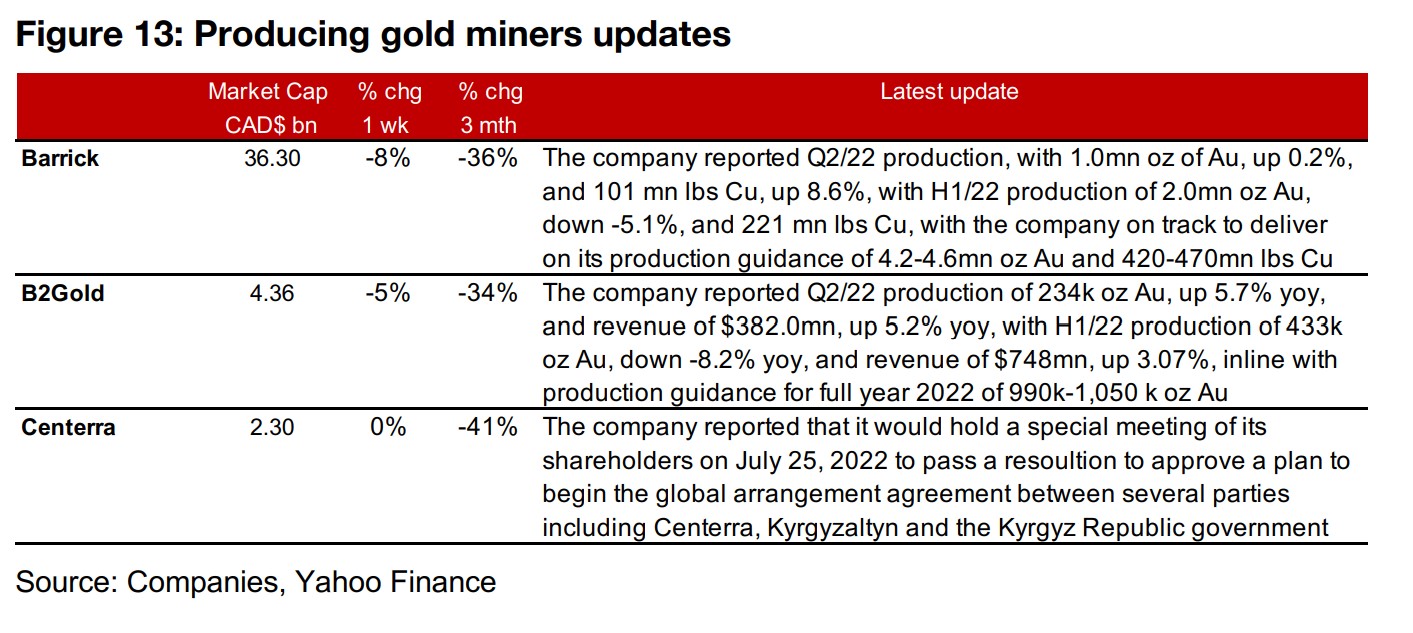
The producing gold miners were all down on the gold decline as equity markets were flat for the week (Figure 11). Barrick reported Q2/22 production in advance of its full results release for the quarter, with production of 1.0 mn oz of gold, up 0.2% yoy and 101 mn lbs of copper, up 8.6%, inline with its full year 2022 guidance. B2Gold also reported Q2/22 production inline with its full year 2022 guidance, at 234k oz of gold, up 5.7% yoy, and revenue of US$382.0 mn, up 5.2% yoy. Centerra announced a special shareholders’ meeting for July 25, 2022 to pass a resolution to begin to implement a plan between Centerra, Kyrgyzaltyn and the Kyrgyz Republic government (Figure 13).
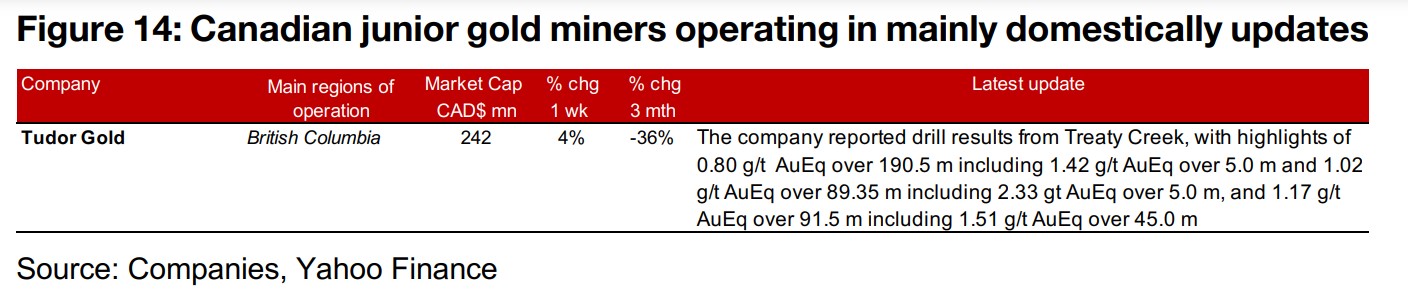
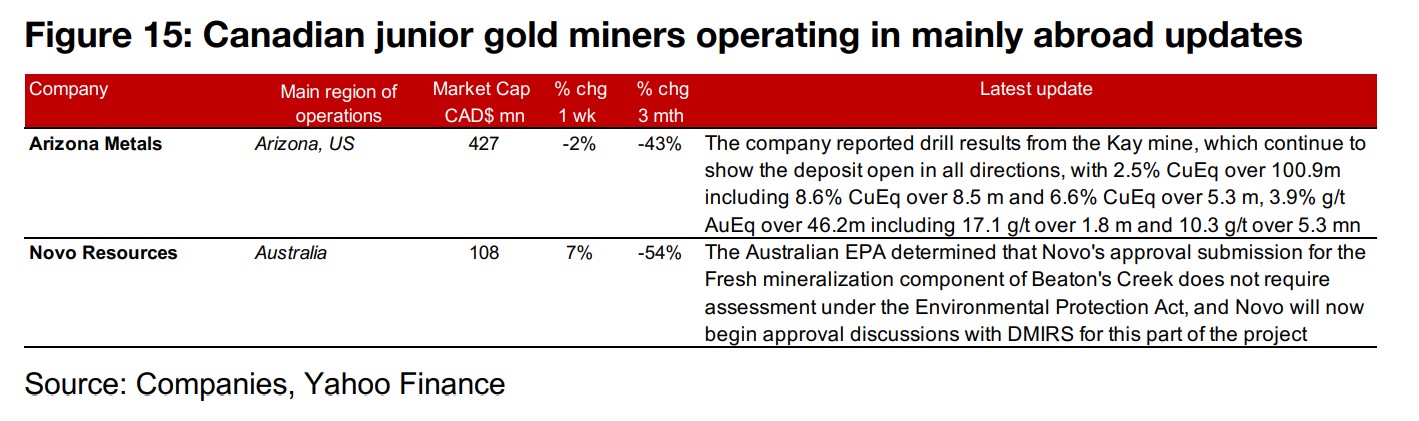
The Canadian juniors were mostly down on the drop in gold (Figure 12). For the Canadian juniors operating mainly domestically, Tudor Gold reported drill results from Phase I of its 2022 exploration at Treaty Creek (Figure 14). For the Canadian juniors operating mainly internationally, Arizona Metals reported drill results from the Kay mine, which continue to show the deposit open in all directions, and Novo Resources reported that an approval submission for the Fresh mineralization component of Beaton’s Creek will not require an EPA assessment, allowing Novo to begin approval discussions with DMIRS for this part of the project (Figure 15).
Disclaimer: This report is for informational use only and should not be used an alternative to the financial and legal advice of a qualified professional in business planning and investment. We do not represent that forecasts in this report will lead to a specific outcome or result, and are not liable in the event of any business action taken in whole or in part as a result of the contents of this report.
Author
Ben McGregor authors the Weekly Roundup at CanadianMiningReport.com, providing sharp analysis of the metals and mining sector. With a talent for spotting trends, Ben distills complex market shifts into clear, engaging insights on TSXV junior miners. His weekly updates cover gold, copper, uranium, and more, blending data-driven perspectives with a knack for identifying opportunities. A vital resource for investors, Ben’s work navigates the dynamic junior mining landscape with precision.