
September 25, 2023
Gold barely moved this week to US$1,945/oz, holding flat for a second consecutive week as the Fed did not hike at its meeting but made hawkish comments indicating that rates could increase further this year and will remain high for an extended period.
This week we look at the relationship between gold and silver, with both holding up well over the past three years and the ratio between them converging to near its three-year average, while silver has outperformed in recent years on a supply deficit.
Gold stocks declined with the GDX down -2.9%, just below a -2.8% fall in the S&P 500 and the GDXJ fell -4.6%, compared to a -3.9% dip from the Russell 2000, on higher interest rate expectations, and the larger TSXV gold stocks were mixed.


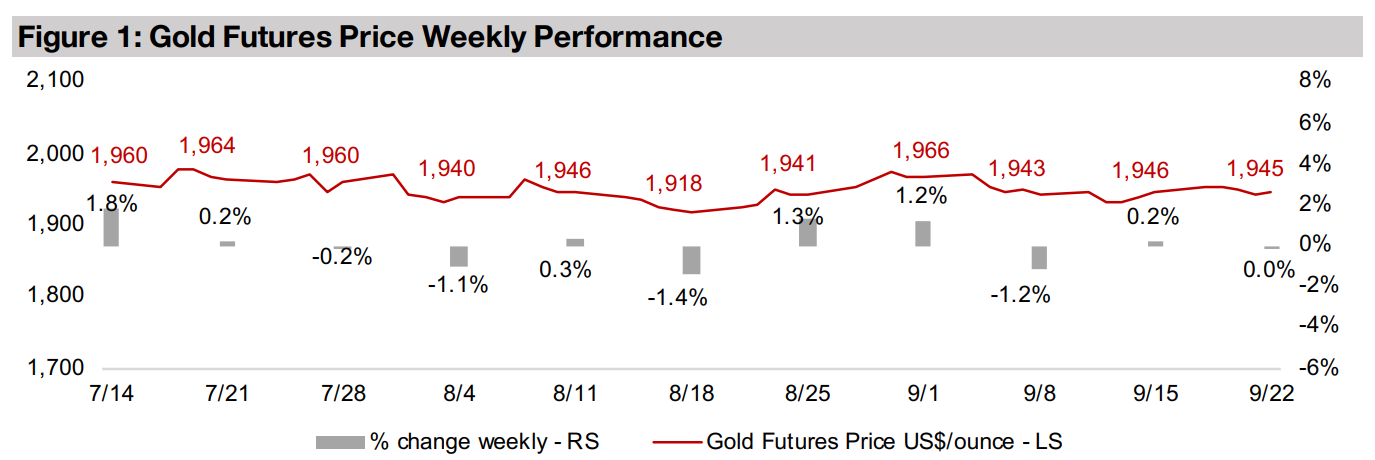
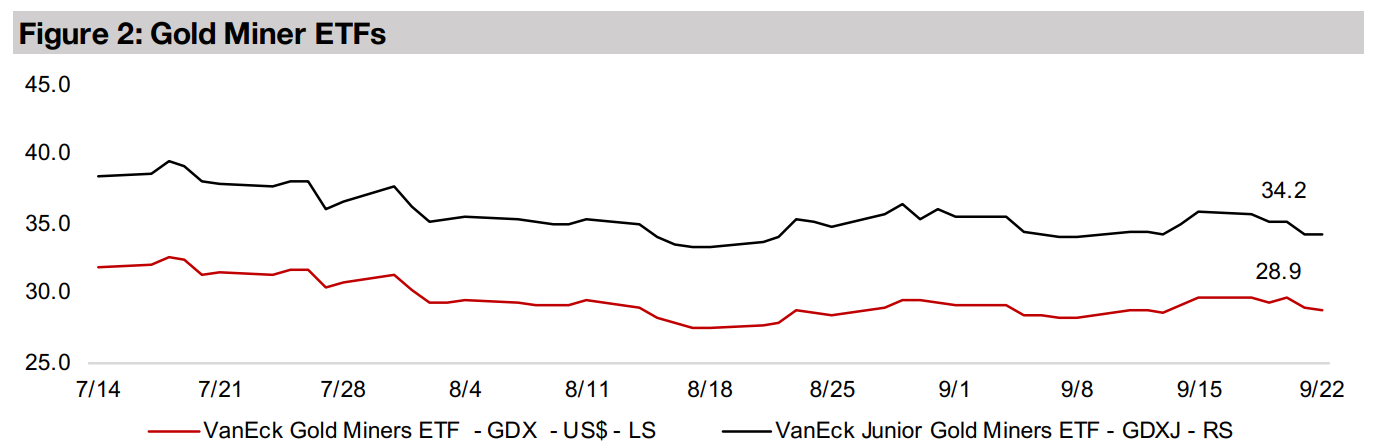
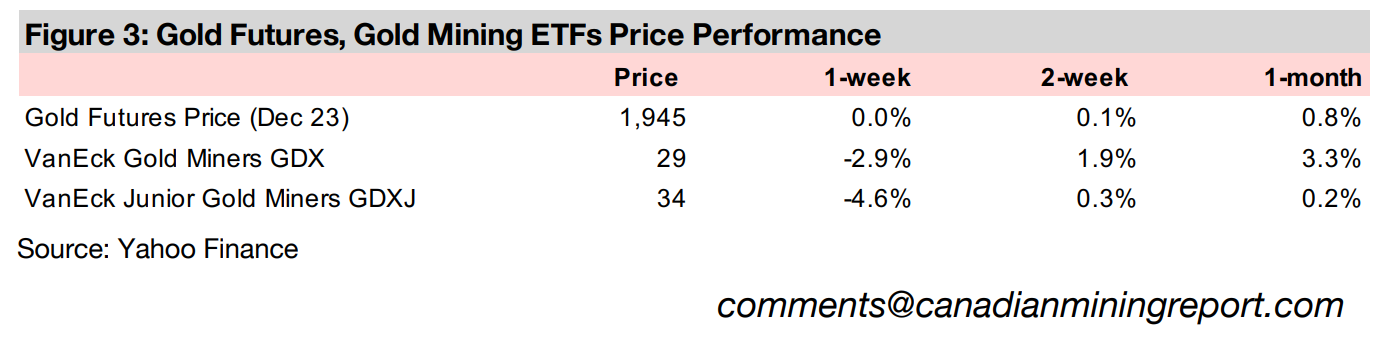
Gold barely moved this week to US$1,945/oz, holding near flat for the second week as the Fed did not increase its base rate at its meeting, but followed up with hawkish comments. Fed Chairman Powell indicated another rate hike could be coming this year, and that interest rates were likely to stay higher for longer. Equity markets reacted negatively, with the S&P 500 down -2.8%, pulling down producing gold stocks, with the GDX off -2.9%, with no support from a flat gold price. Small caps were hit harder by the continued move to risk off permeating markets, with the Russell 2000 off -3.9%, dragging down gold juniors, with the GDXJ losing -4.6%.
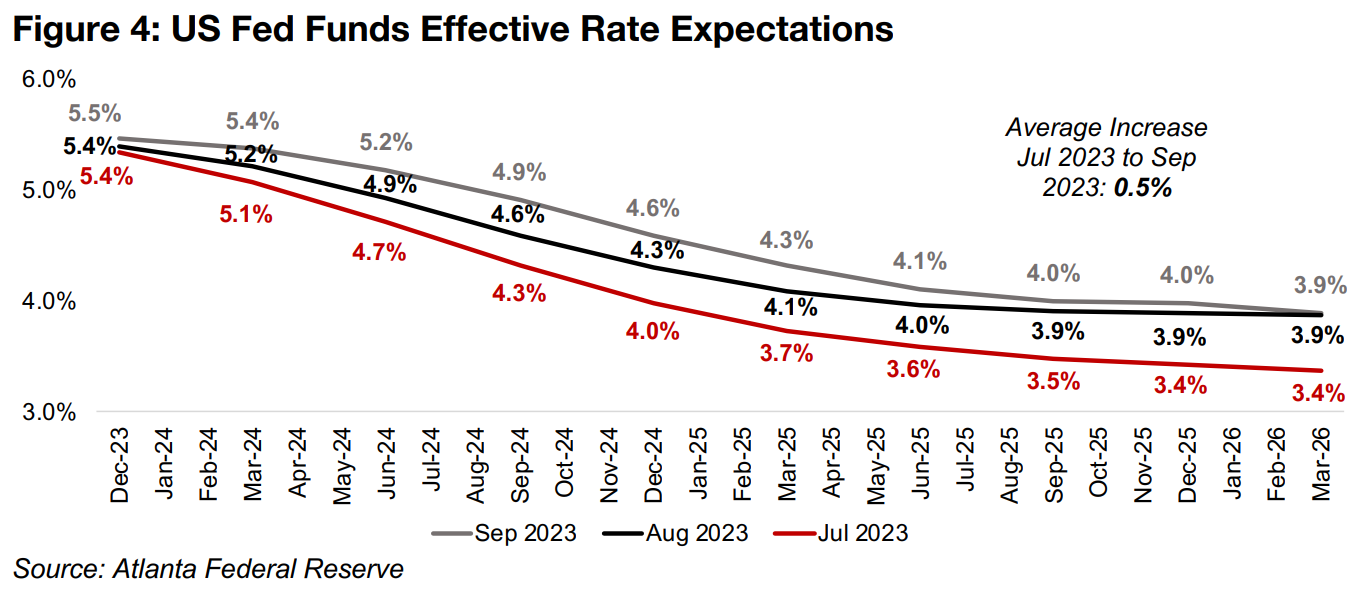
The continued pressure on equities has been driven partly by increasing rate
expectations, further enflamed by the Fed’s comments this week, as shown by the
Atlanta Federal Reserve’s Market Probability Tracker (Figure 4). The US Effective
Federal Funds rate forecast has risen by an average 0.5% across the curve from July
2023 to September 2023. The market now expects the Fed Funds Rate rates to
remain above 5.0% until at least mid-2024, and to be at 4.0% as late as December
2025, where just 3.4% was expected for that month in July 2023.
Even with the pressure of rates near thirty-year highs, the global economy continues
to hold it together for now, with growth reasonable and unemployment low in the US
and the EU. However, Japan has remained cautious with its rate hikes, and there are
signs of fraying at the edges, with China seeing weak data and cutting rates, and
crises erupting in many emerging economies, especially related to inflation. Severe
economic fallout is becoming more probable the longer global rates stay high, and
another year with the US rate near or above 5.0% could potentially provoke some
unintended negative consequences.
Gold seems likely to benefit from such disruption in our view, on a flight to safety,
while for gold stocks it remains a question of whether a boost from a rising gold price
can offset downward pressure from a major decline in equity markets that could
ensue. For silver, the outlook is less clear, as a cyclical downturn is likely to drag it
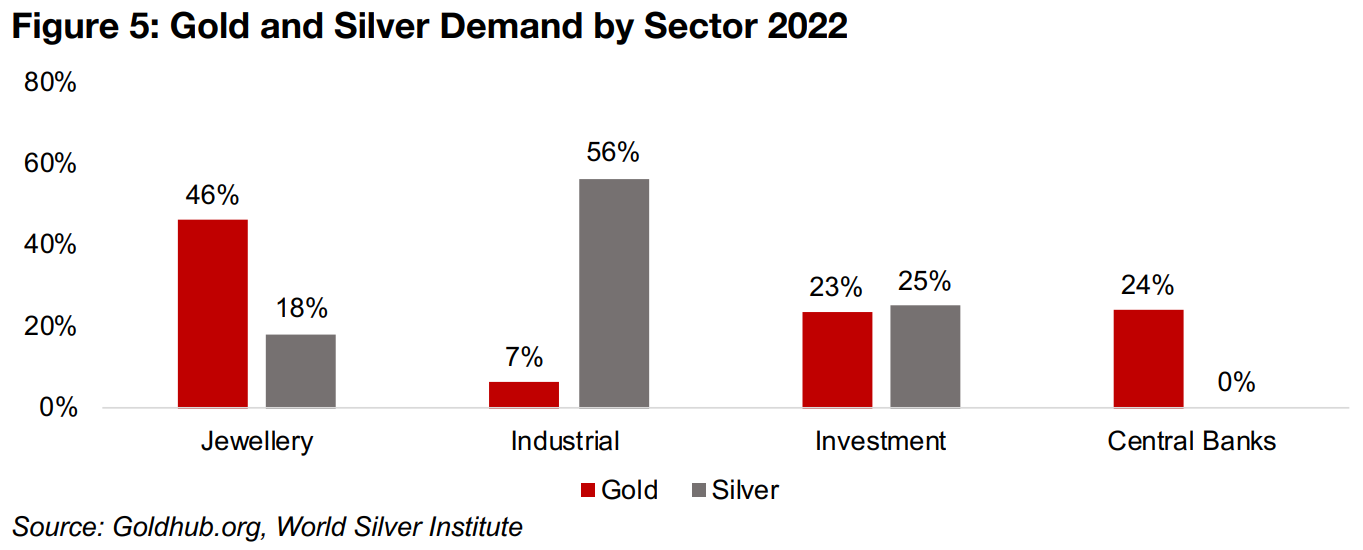
down given that 56% of its demand comes from industrial uses, in contrast to gold,
with industrial demand just 7% of the total (Figure 5).
Gold is almost entirely driven by its role as a monetary substitute. Even jewellery
demand, at 46% of the total, could be considered part of this, as such purchases are
often made because of gold’s function as a long-term store of value, while investment
and central bank demand are clearly monetary factors. Silver also has a large
component of demand as a monetary substitute, with 18% from jewellery and 25%
from investment, but has no significant demand from central banks. So the outlook
for silver in a recession would depend on whether the downward pressure on demand
from the industrial drivers is offset by its gold-like monetary drivers.
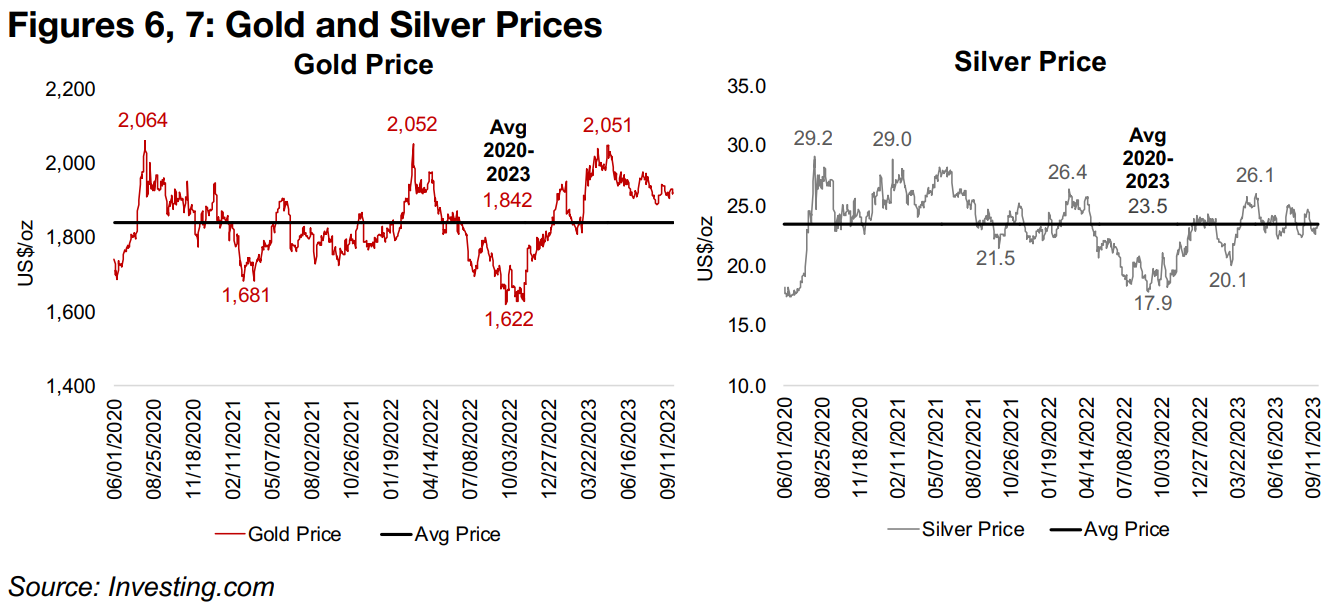
Rising concerns about recession and an eventual return to monetary easing, as well
as geopolitical issues, have supported gold this year, with the spot price now at
US$1920/oz, 4.3% above its US$1,842/oz average since mid-2020 (Figure 6). Gold
peaked just above US$2,050/oz three times in this period, and needed a major crisis
to get there each time, with the onset of the global health crisis, Russia’s invasion of
Ukraine and the US banking crisis. It hit lows of nearly US$1,600/oz briefly in late
2022 when inflation was falling and there had still been limited economic fallout from
high interest rates, increasing expectations of a ‘soft landing,’ which were curbed by
the banking crisis. We expect that there is enough potential risk in the system that
could erupt and send gold past its previous highs by 2024.
For silver, so far this year the industrial and monetary factors seem to have been
balanced, with price not deviating too severely from the average since 2020 of
US$22.7/oz. It hit a low of US$20.1/oz in March 2023 and a high of US$26.1/oz in
May 2023, and is now trading at exactly the US$23.5/oz average since 2020 (Figure
7). While there is still a debate whether a global recession will occur, historically the
extremely inverted yield curves seen this year are a very negative indicator, and the
outlook for industrial demand is precarious. However, as half of silver’s demand could
benefit from a flight to safety, which factor will dominate remains to be seen.
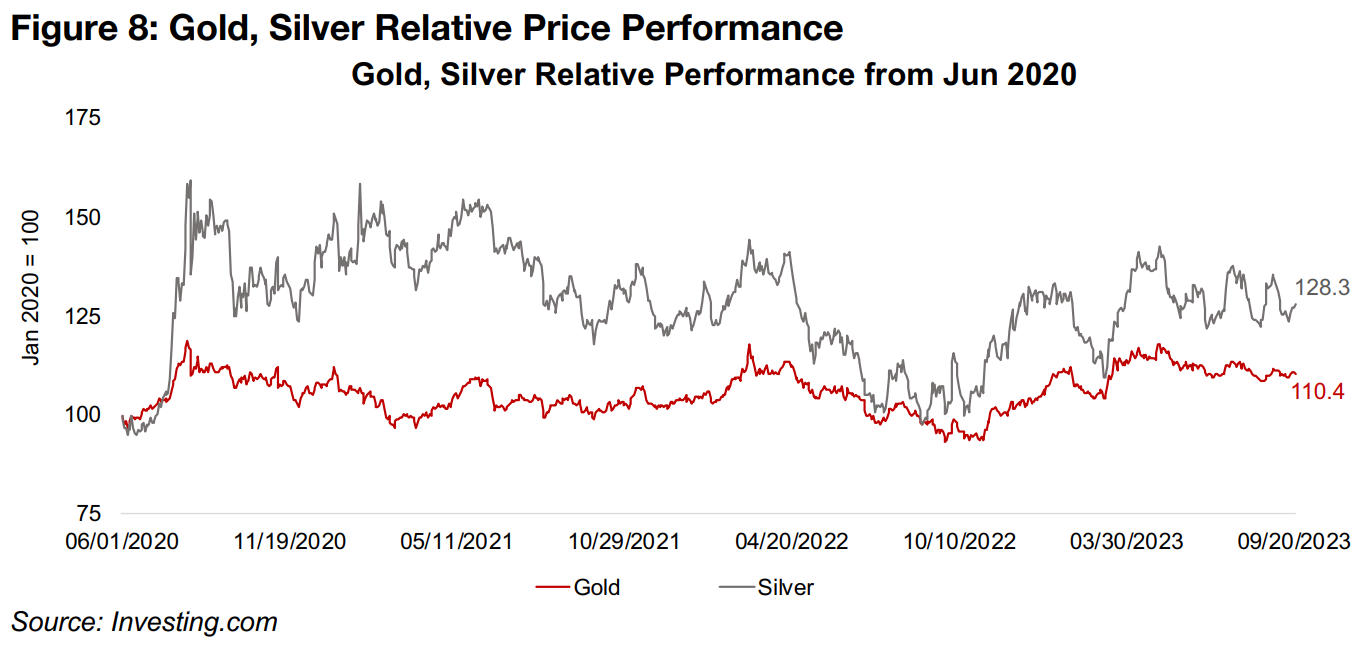
Silver has outperformed gold over the past three years, mainly because it was somewhat late to the party, with gold already having experienced a surge from mid-2019 and silver only catching up in the second half of 2020. It has maintained these gains in most of the period since, only converging with gold’s performance from July to September 2022, and again in March 2023, and is up 28.3% since June 2020 versus a 10.4% rise for gold (Figure 8). Silver’s outperformance through 2021 and 2022 was also boosted by the huge industrial rebound after the global health crisis, but this driver seems to have lost steam especially since Q4/22.
One gauge to determine where the relative levels of the two metals may be heading is the gold to silver ratio (Figures 9, 10). In a very long-term context, at the current level of 81.8x, gold certainly looks overvalued versus the average ratio from 1915- 2020 at 52.6x and is about four times the lows reached in 1920 at 20.0x and in 1979 at 15.1x. However, the pre-1990s figures maybe not an appropriate comparison, given structural changes in the global economy over time. The average since 1990 of 69.0x is likely a more appropriate benchmark, and still suggests a quite substantial overvaluation of gold versus silver.
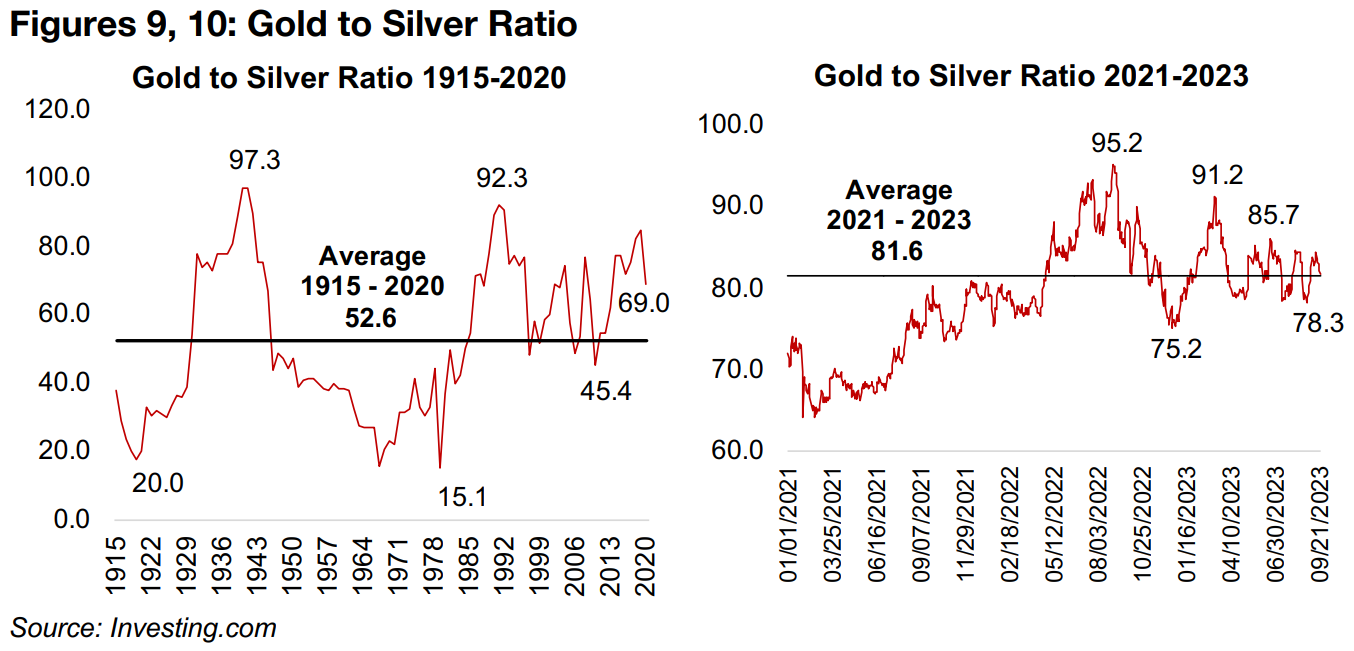
Shorter-term, the ratio has averaged 81.6x from 2021 to 2023, after a surge from 2021 as the gold price rose and silver pulled back. The ratio was quite volatile in 2022, reaching a high of 95.2x in August 2022 and hitting a low of 75.2x in December 2022. While it jumped to 91.2x again in March 2023 during the banking crisis, the ratio has settled since May 2023 into a much tighter range, between 85.7x and 75.3x. Currently it is at 81.8x, almost exactly at the average since 2020, which obviously does not indicate a particularly strong direction one way or the other for these metals in terms of reversion to this short-term term mean.
There is certainly a chance for gold to outperform silver next year, if it is boosted by
an economic disruption which hits silver’s industrial demand, offsetting gains for the
latter from monetary drivers on a flight to safety. However, silver could also continue
to beat out gold, if a significant supply demand deficit that has developed over the
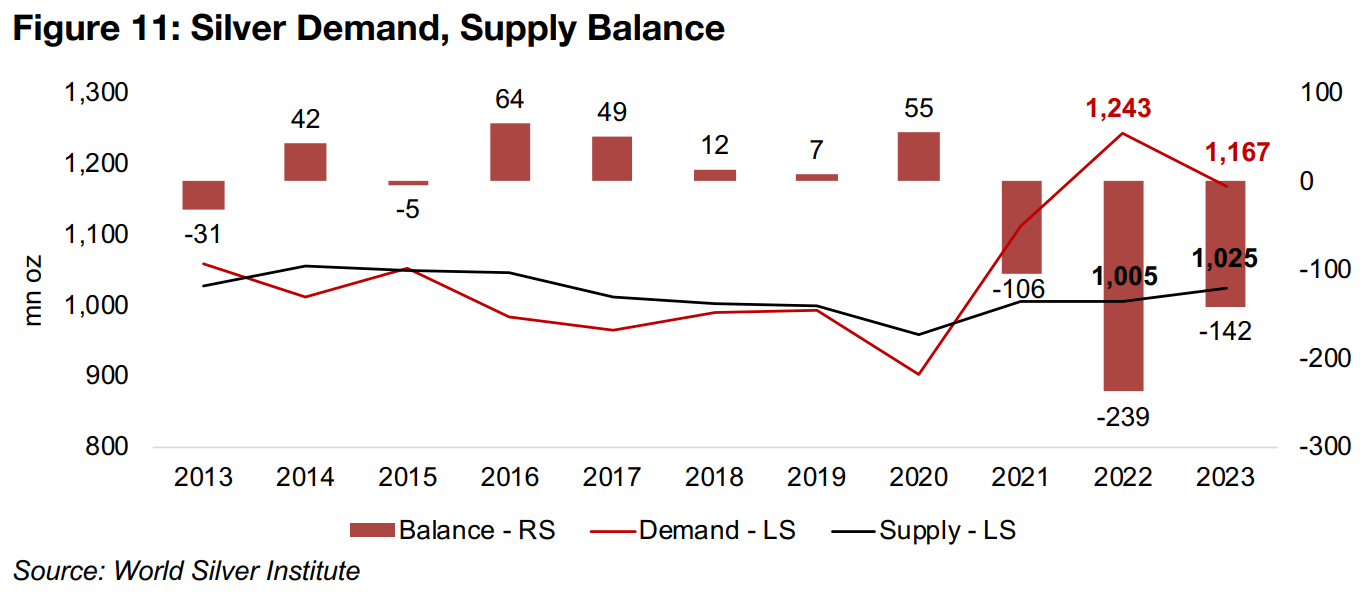
past three years persists. Silver demand in 2022 was 1.24mn ounces, versus supply
of 1.00 mn oz, for a deficit of -0.24mn oz, widening from -0.11mn oz in 2021, following
a market near flat or in surplus from 2013 to 2020. While the deficit is expected to
contract to -0.14mn oz in 2023, this is still relatively high (Figure 11).
The degree of a potential recession will be key to silver performance; a major decline
could see the deficit reverse as demand slumps, but a milder recession could see a
negative balance continue. Major shocks seem less likely on the supply side
especially in contrast to the disruption of 2020 to 2021. In the case that a recession
is entirely avoided, a continued silver deficit and even moderate industrial demand
growth could see silver continue to outperform gold, although we view this as a
reasonably low probability given mounting risks.
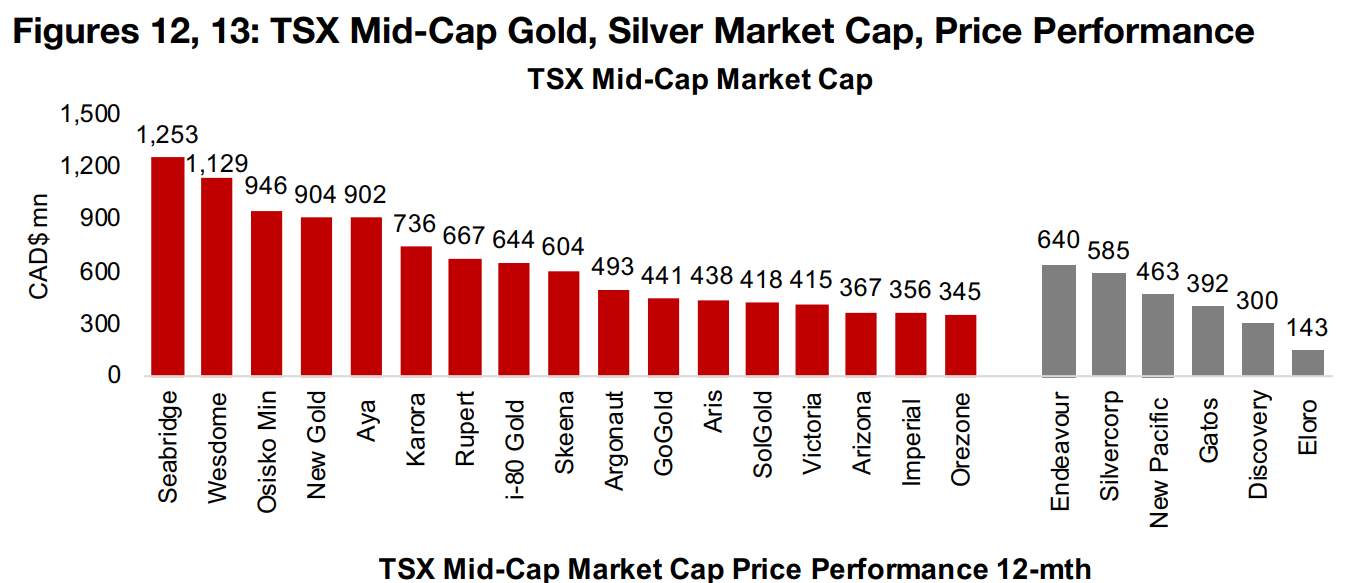
Even with both the gold and silver prices holding up well over the past twelve months,
the TSX mid-cap and larger TSXV gold and silver stocks overall have struggled
(Figures 12, 13). A key issue has been rising interest rates driving higher discount
rates, which mathematically reduces stock valuations, other factors held fixed. To
keep stock prices rising, expected cash flows need to outpace rising rates and this
has not been happening this year. Even for producing gold and silver stocks, which
are generating cash flows, and therefore are substantially lower risk than junior miners,
this remains an issue. The rising rates further hit producers given that they often hold
debt, in contrast to mainly equity-financed juniors, and an increasing amount of cash
flow goes towards servicing larger debt payments given high rates.
This explains the overall weak performance we see from the TSX mid-cap gold and
silver stocks, which are a mix mainly of producers and companies with advanced
stage development projects. Of seventeen gold stocks, only five have risen over the
past year, and of six silver stocks, only one has risen, with four down more than 35%.
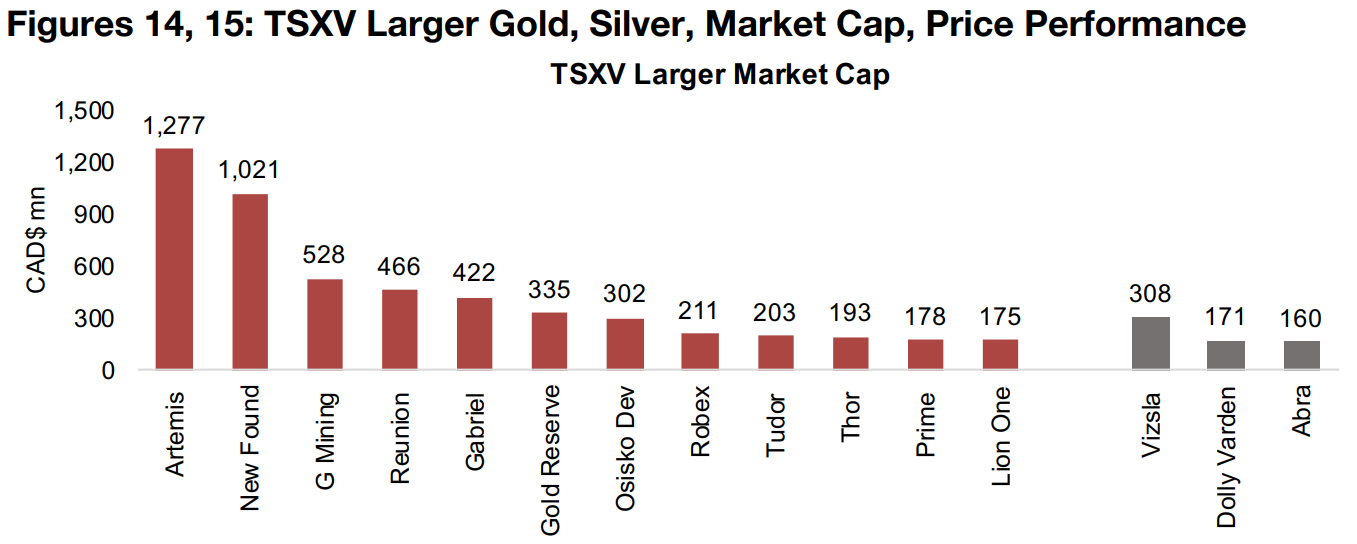
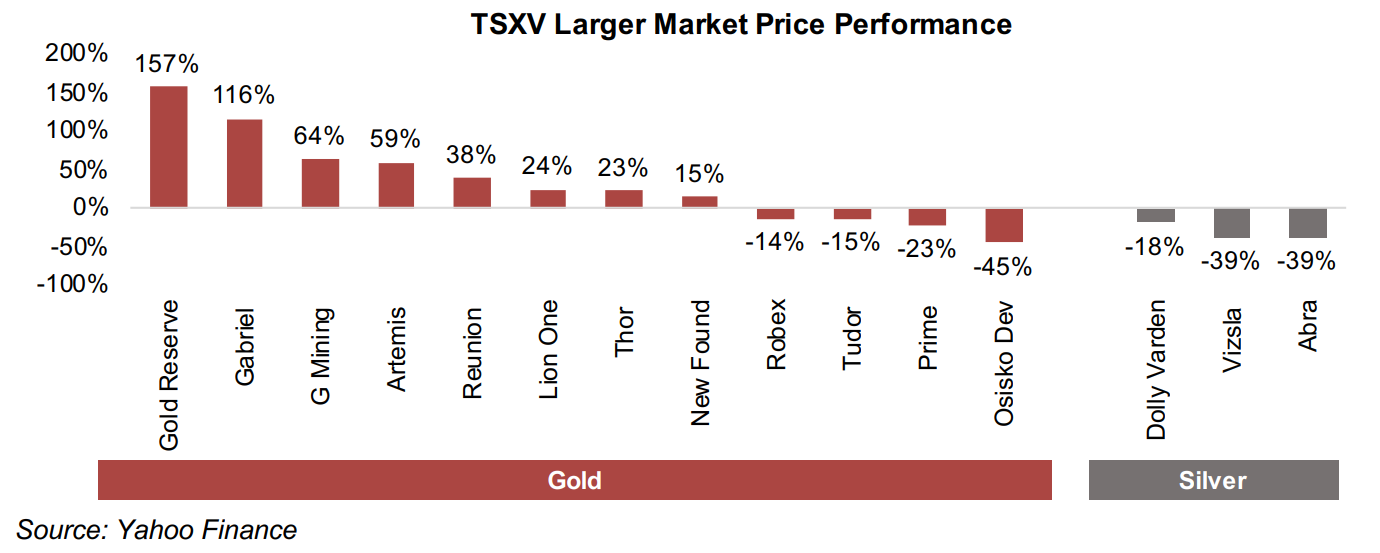
For pre-production gold and silver juniors the problem is worse, as many earlier stage projects investors would be interested in at a lower rates suddenly look less compelling and keeping a flow of new capital to continue exploring becomes more difficult. Interestingly, however, overall the price performance of the junior miners comprising the larger TSXV gold stocks has leaned more towards gains than the TSX mid-cap stocks, with eight of twelve rising (Figures 14, 15). The TSXV silver stocks, in contrast, have been weak, similar to TSX mid-cap silver. While the top two TSXV gold performers, Gold Reserve and Gabriel, have been driven by advances in court decisions, rather than strong operations, the others have increased output, progressed toward production, or shown outstanding drilling results for their projects.
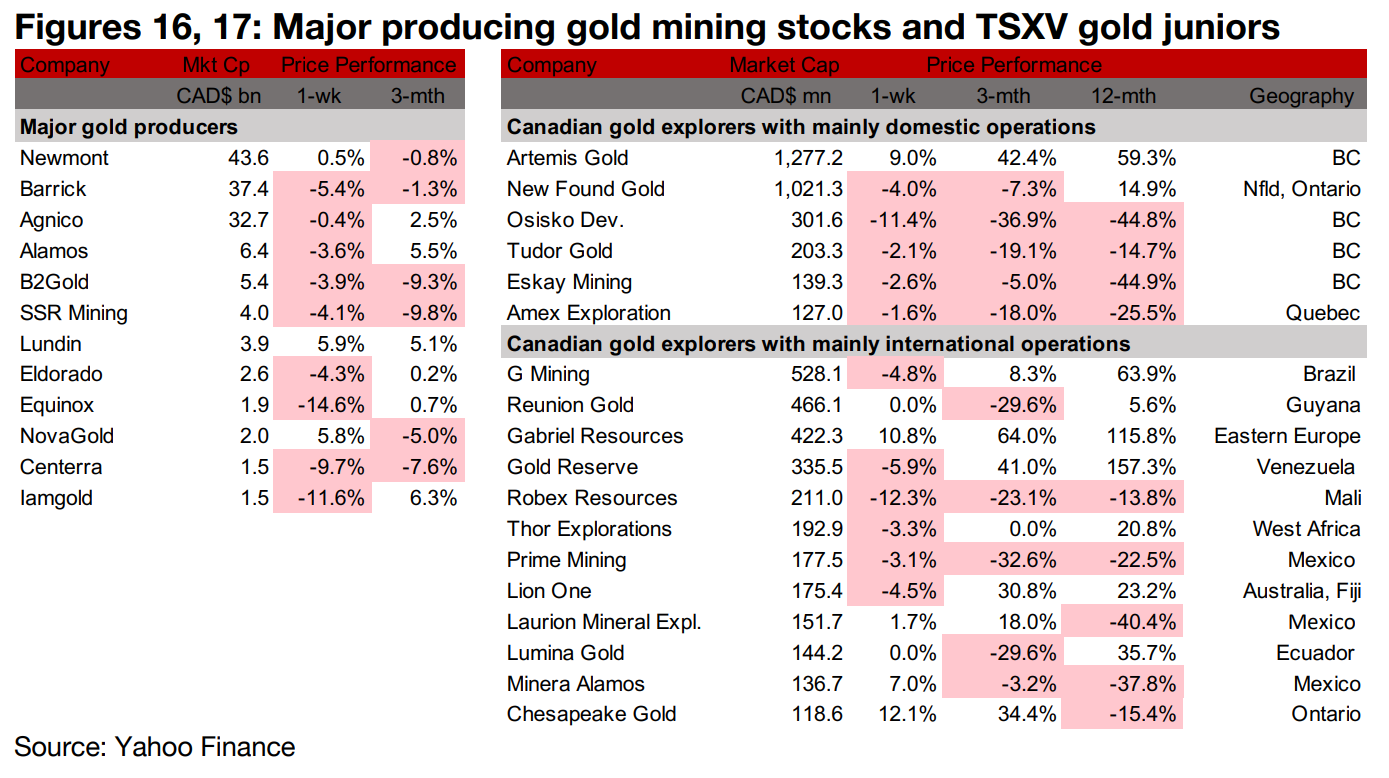
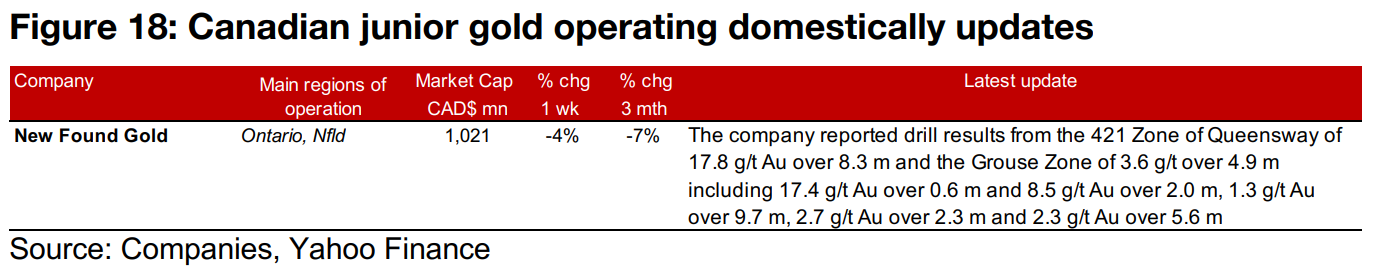
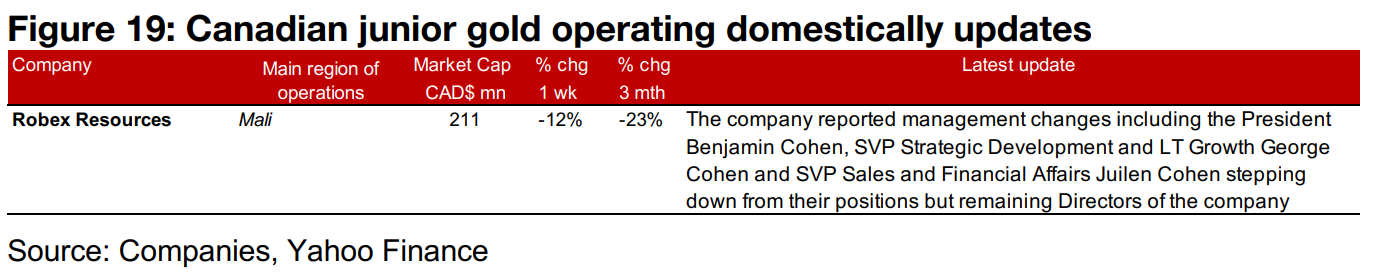
Most of the major gold producers fell and larger TSXV gold was mixed (Figures 16, 17). For the TSXV gold companies operating domestically, New Found Gold reported drill results from the 421 and Grouse Zones of Queensway (Figure 18). For the TSXV companies operating internationally, Robex Resources announced management changes with several current senior executives stepping down from their roles and continuing as directors (Figure 19).
Disclaimer: This report is for informational use only and should not be used an alternative to the financial and legal advice of a qualified professional in business planning and investment. We do not represent that forecasts in this report will lead to a specific outcome or result, and are not liable in the event of any business action taken in whole or in part as a result of the contents of this report.
Author
Ben McGregor authors the Weekly Roundup at CanadianMiningReport.com, providing sharp analysis of the metals and mining sector. With a talent for spotting trends, Ben distills complex market shifts into clear, engaging insights on TSXV junior miners. His weekly updates cover gold, copper, uranium, and more, blending data-driven perspectives with a knack for identifying opportunities. A vital resource for investors, Ben’s work navigates the dynamic junior mining landscape with precision.