
August 07, 2023
The gold price rose 0.9% to US$1,978/oz, as there were some signs that the equity market rally ongoing since March 2023 was faltering, with the US credit rating downgraded and US employment report continuing to show a mixed picture.
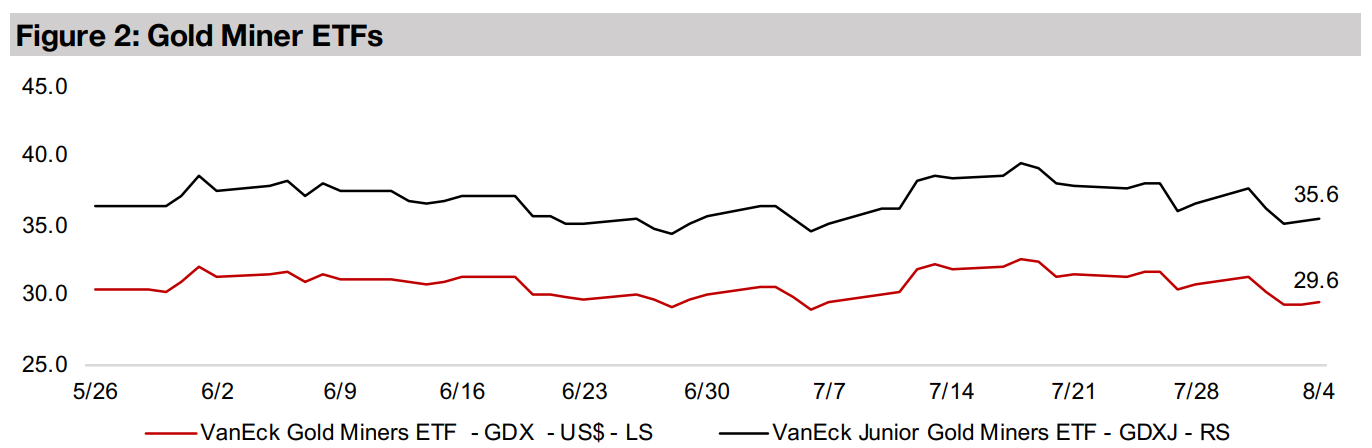
The gold stocks were down with the GDX off -3.8% and GDXJ sliding -2.7% as the gain in gold did not offset a broader downturn in small caps, with the Russell 2000 dipping -1.38% for the week, while the large TSXV gold juniors were mixed.


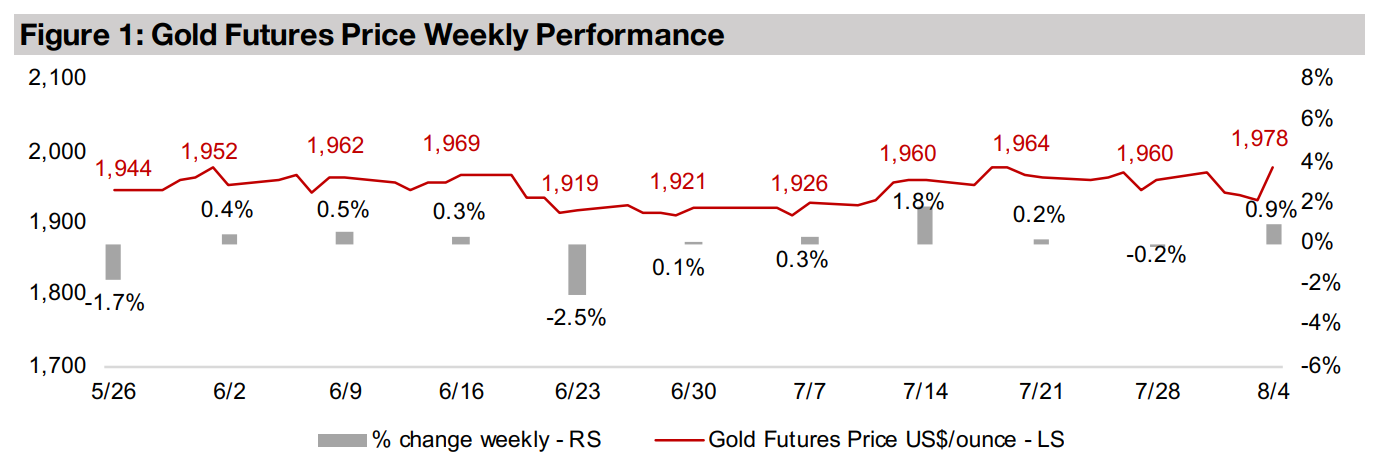
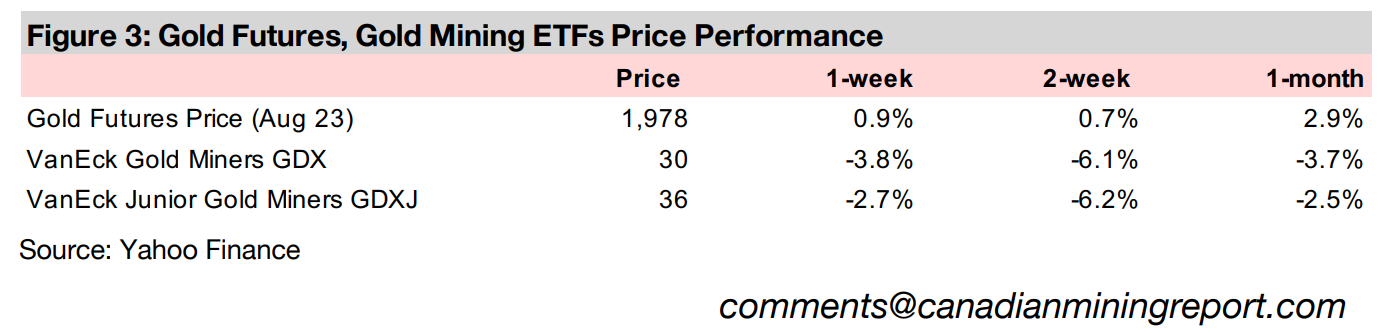
Gold rose 0.9% this week to US$1,978/oz, as the market seems to have shifted once
again to a risk off stance, with the rally in equity markets that began in March 2023
showing some clear signs of faltering. This was especially driven by the downgrade
of US debt from the highest AAA rating to AA+, which was only the second time US
debt has been downgraded by a major ratings agency. US government debt has
historically been rated AAA by all the agencies since the first rating of the country in
1917, by Moody’s. The first major downgrade came in 2011, when S&P cut the US
debt rating to AA+, which it has held since, leaving Moody’s the only remaining ratings
agency with an AAA rating for US debt.
There were also US jobs numbers which continued to report a mixed picture, with
payroll growth just below expectations, but the unemployment rate declining to 3.5%
from 3.6%, lower than forecast, and average hourly earnings rising more than
estimated. While the low payrolls number could be viewed as a positive by markets
looking for weak data to support a Fed pullback in rates, the low unemployment and
earnings jump looked inflationary, in contrast, and would likely support the Fed at
least maintaining rates, if not even hiking again one more time this year.
Combined with the debt downgrade, this was enough to drive an -2.33% decline in
the S&P 500 for the week, with small caps also hit and the Russell 2000 down -1.38%.
This overall equity sell-off hit gold stocks, even though the gold price gained, with the
GDX down -3.8% and the GDXJ down -2.7%. This is somewhat concerning given
that we had seen the gold stocks outperform in an equity downturn earlier this year,
as a rising gold price offset the pressure on the stock market. It appears that the
markets are going to require a bit more of a strong move in gold before they are ready
to make another big buying push into the sector.
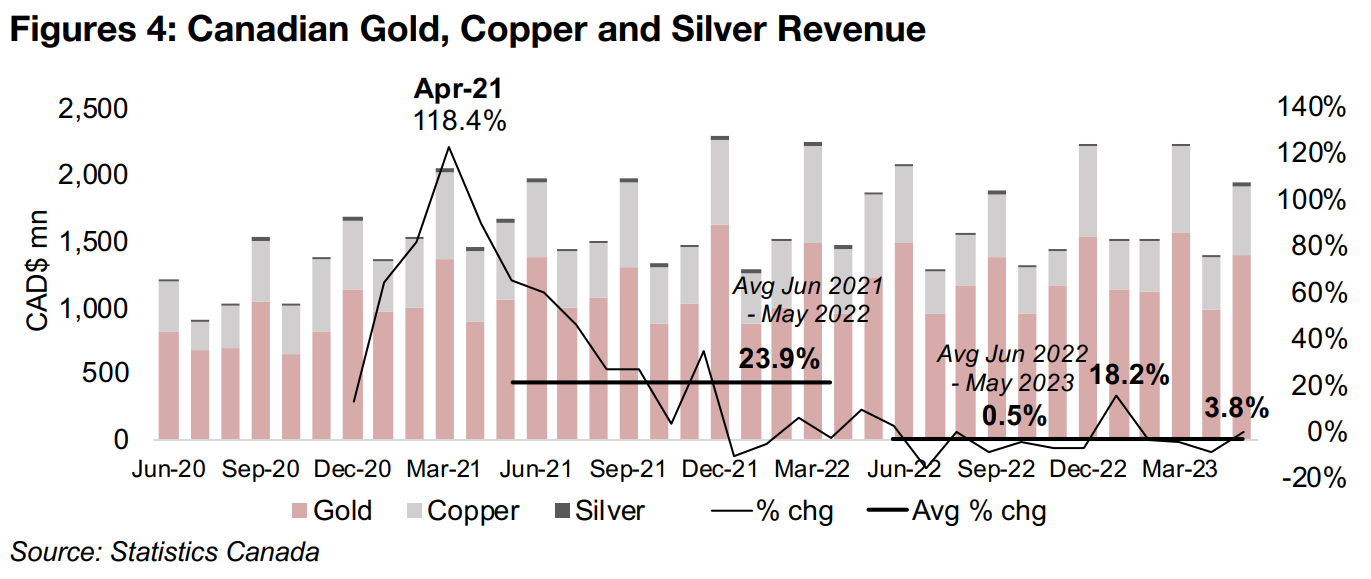
This week we look at the trends over the past three years for Canadian mining
production and shipment value based on monthly data from Statistics Canada
reported through to May 2023, for gold, copper and silver. The aggregate monthly
shipment value for the three combined has grown 0.5% on average to CAD$1.69bn
over the most recently reported twelve months from June 2022 to May 2023. This is
down from CAD$1.70bn on average from June 2021 to May 2022 and growth of 23.9%
(Figure 4). The rates of the past two years are also well off the most recent peak at
118.4% in April 2021.
This near flat expansion for the industry has been driven partly by a muted rise in the
gold price, up 1.5%, and considerable -9.0% and -14.5% declines the silver and
copper prices, respectively, in the year to May 2023. Gold has increased as a
percentage of the shipment value to 72.6% of the total in the twelve months to May
2023, with 26.3% for copper and just 1.1% for silver, compared to 68.0%, 30.7%
and 1.3% in the previous year.
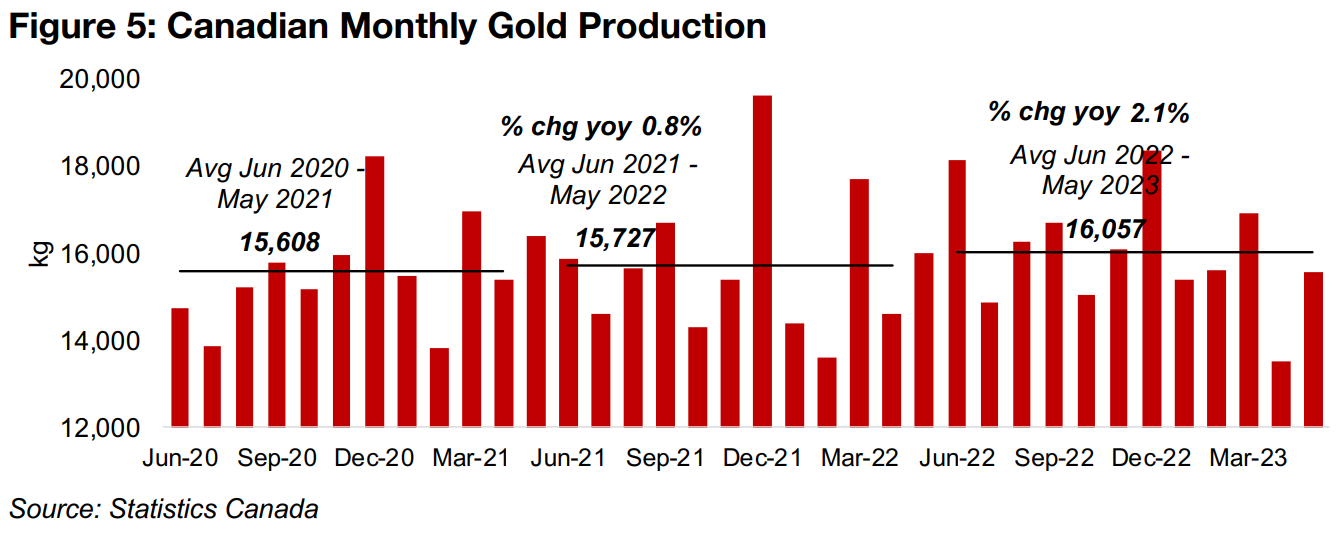
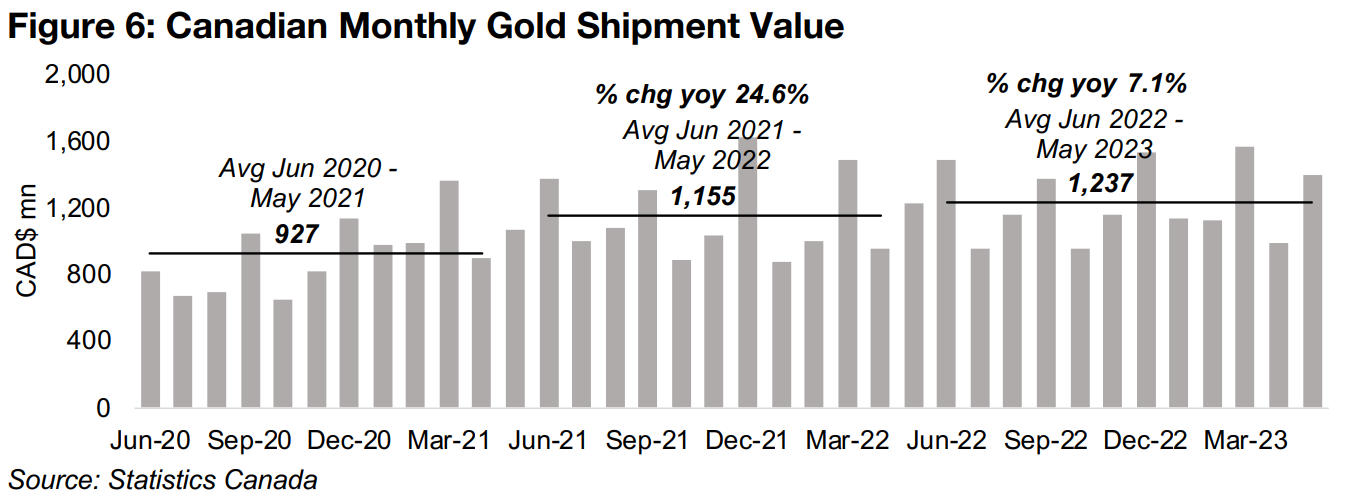
Average monthly Canadian gold production has continued to trend up, with a 2.1% rise over the twelve months to May 2023, to 16,057 kg, compared to an 0.8% rise in the prior year to 15,727 kg (Figure 5). Shipment value has also risen over the past year, by 7.1% to CAD$1.24bn per month, but growth is down substantially from a 24.6% rise in the previous twelve months to CAD$1.16bn (Figure 6). This was driven a rise in the gold price during the June 2021-May 2022 period year on year, with gold still below US$1,700/oz at the start of the June 2020 to May 2021 period.
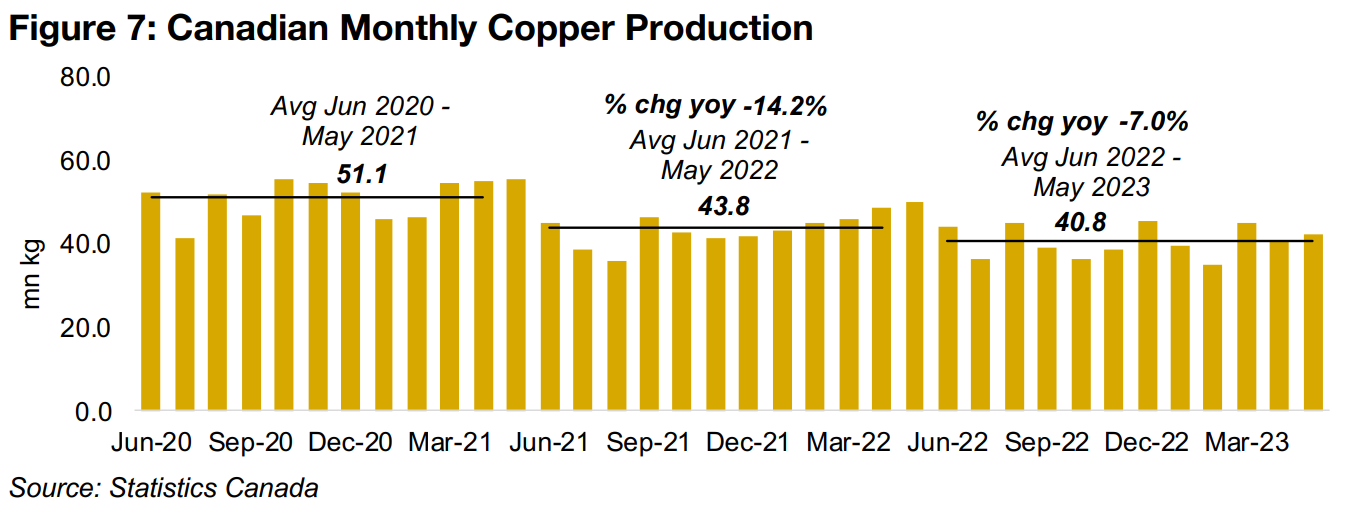
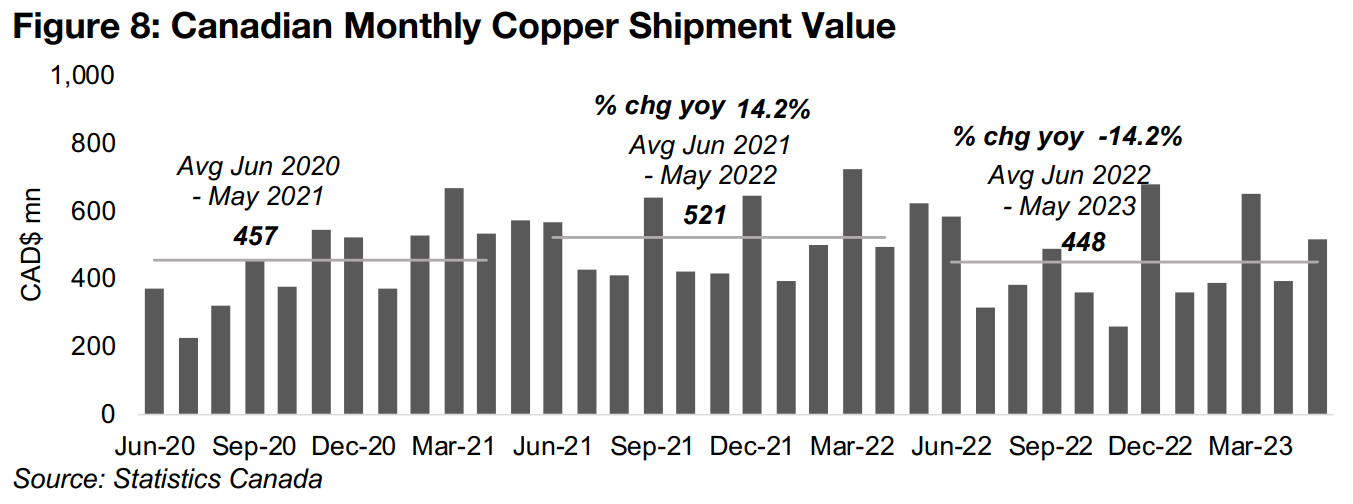
Copper production has trended down, declining -7.0% to an average 40.8 mn kg in the year to May 2023, down from 43.8 mn kg in the year to May 2022, a -14.2% fall from 51.1 mn kg year on year (Figure 7). Copper shipment value was also down over the past year -14.2% to CAD$448mn from CAD$521mn, on the decline in production and the copper price (Figure 8). However, there was 14.2% rise in the year to May 2022, from CAD$457mn in the previous year, on a jump in the copper price.
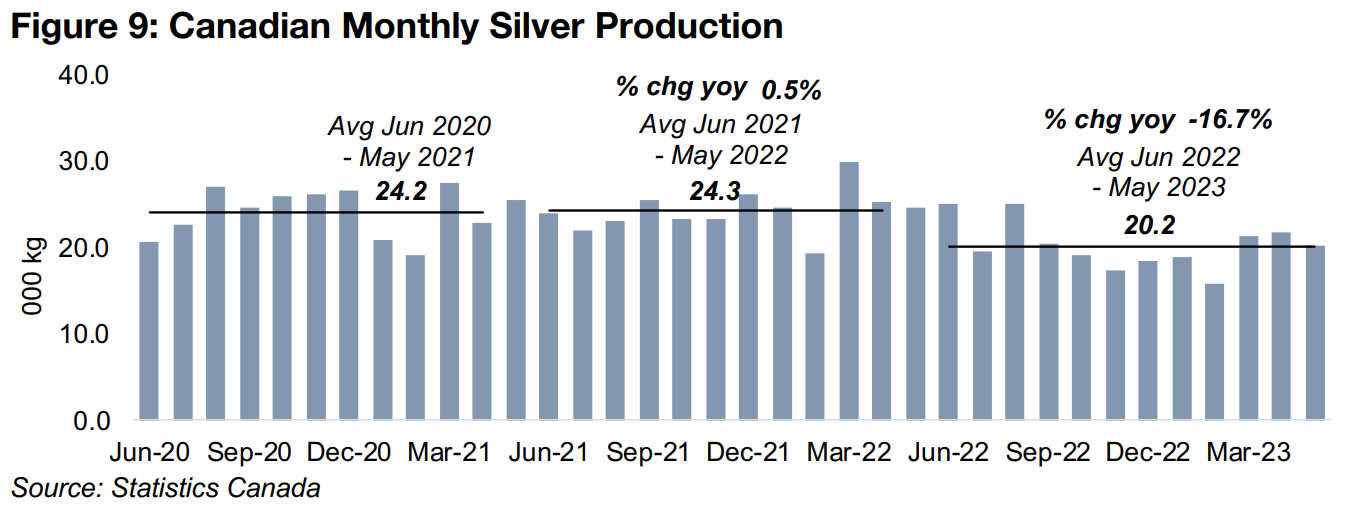
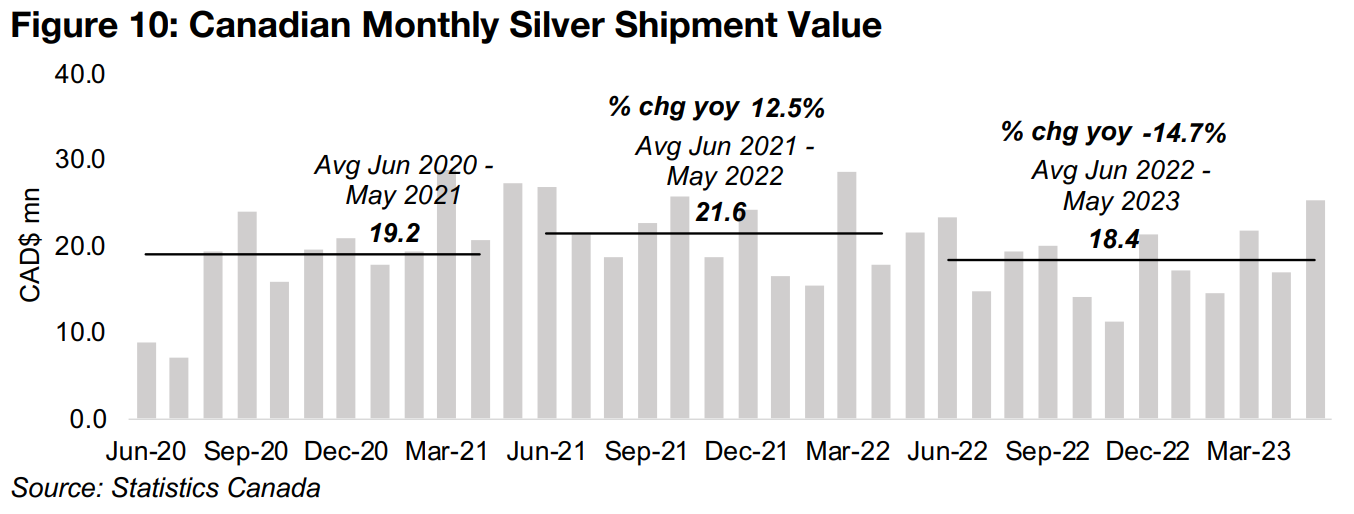
Average monthly silver production and shipment value both declined in the year to May 2023, down -16.7% to an average 20.2k kg, and -14.7% to CAD$18.4mn, respectively (Figures 9, 10). However, this was after a relatively strong rise in the year to May 2022, with production up 0.5% to 24.3k kg and shipments increasing 12.5% to CAD$21.6mn on a gain in the silver price.
Gold will likely continue to be big driver of Canadian mining revenue this year, given that it is well over two thirds of the shipment value of gold, copper and silver combined, and we expect the gold price to have the best chance to outperform of these three metals this year. We see more chance for continued pressure on the copper price given rising recession fears, with global yields at their most heavily inverted in decades. The silver outlook is more mixed, as it is affected by both monetary drivers, seeing it correlated with gold, but also industrial drivers, seeing it correlated with copper, and it is unclear which will be stronger this year.
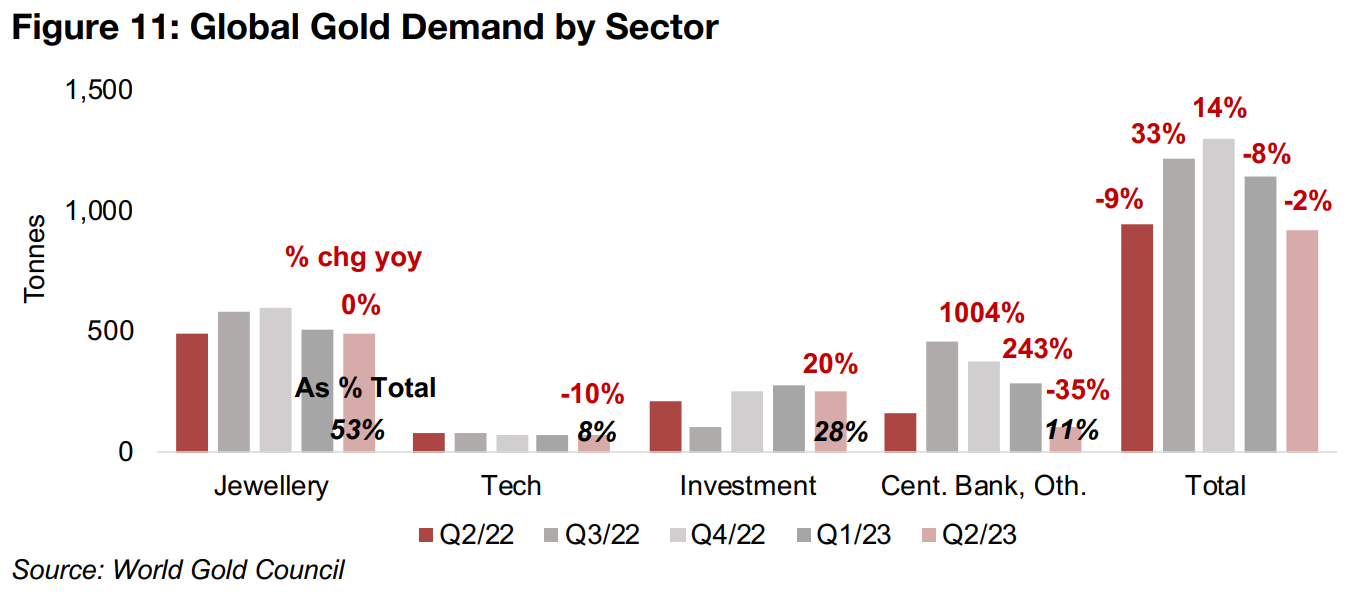
The World Gold Council recently released its Q2/23 report, providing an update on gold demand and supply trends. Global demand growth continued to slow for the third consecutive quarter, down -2% from a peak at 33% in Q3/22 (Figure 11). The largest component of demand is jewellery, at 53% of the total, with growth flat yoy, while tech demand, at 8% of the total, dropped -10%, and investment demand, at 28% of the total, rose 20%. The most volatile component in recent quarters has been central bank demand, at 11% of the total, declining -35% in Q2/23, after a huge surge in the previous two quarters, up 1004% and 243%, respectively.
A large part of the central bank demand decline has been driven by Turkey, although was not because of a negative view from the financial authorities on the outlook for gold. Instead, it was temporary measures with the central bank selling gold not to other countries, but rather within the country itself to help stabilize its financial system, with a severe an inflation problem still continuing.
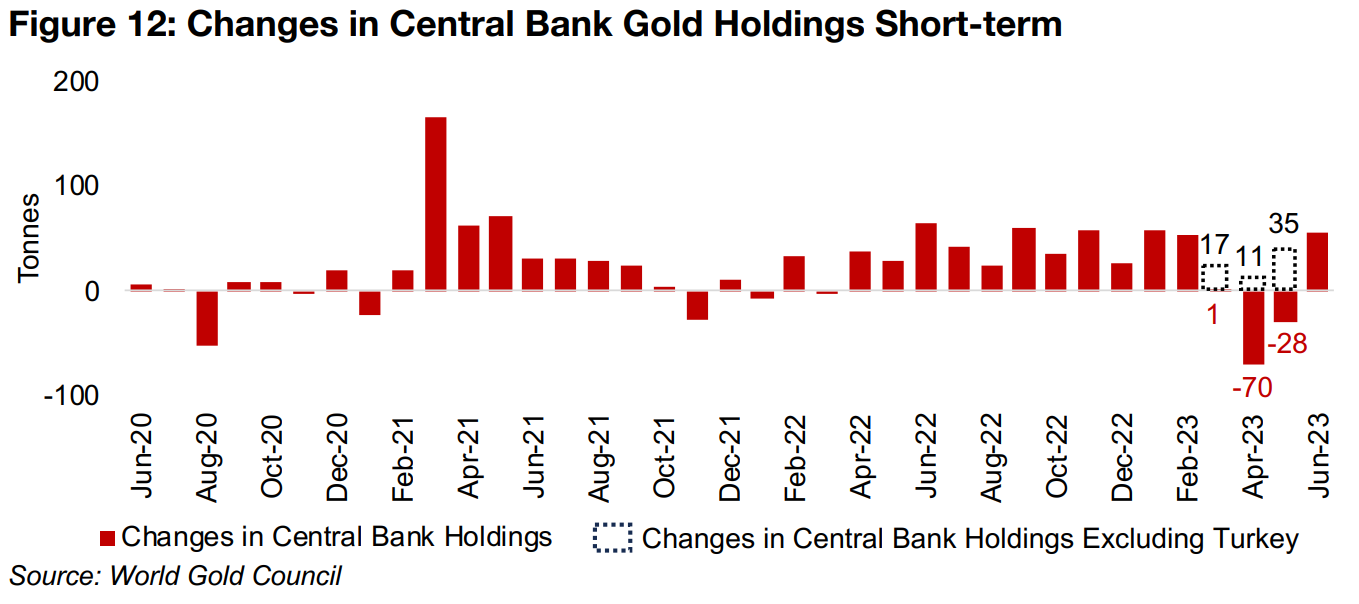
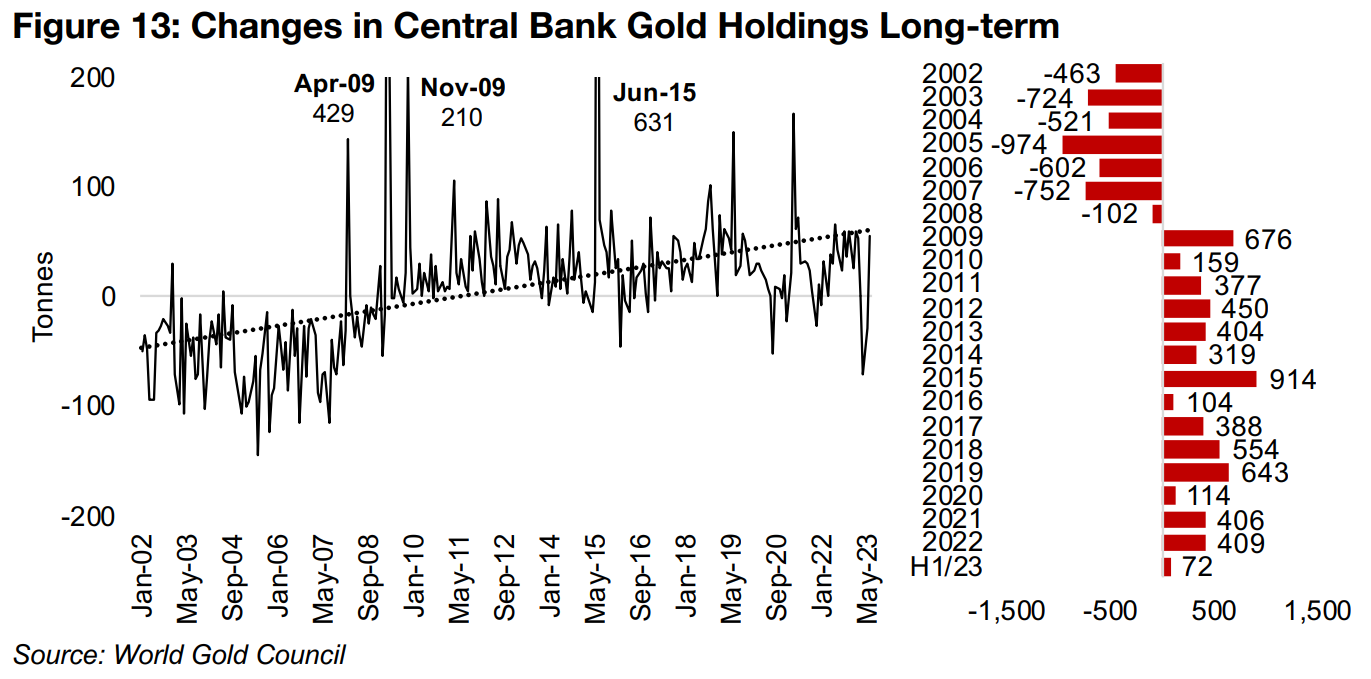
If we exclude Turkey's central bank selling from March 2023 to May 2023 to account for the exceptional situation there, nearly flat net buying by global central banks in March rises to 17 tonnes, the -70 tonnes of net selling in April turns to 11 tonnes of net buying, and -28 tonnes of net sales in May becomes 35 tonnes of net purchases (Figure 12). Central bank buying clearly remains in a strong uptrend over the last twenty years, with the last period of sustained net selling by central banks running from 2002 to 2008 (Figure 13). The financial crisis of 2008 obviously shifted the stance of central banks towards maintaining stronger reserves against risk, with gold the only currency that cannot be easily inflated, while it also has a track record as a currency for a few millenia, in contrast to more recent uninflatable digital currencies.
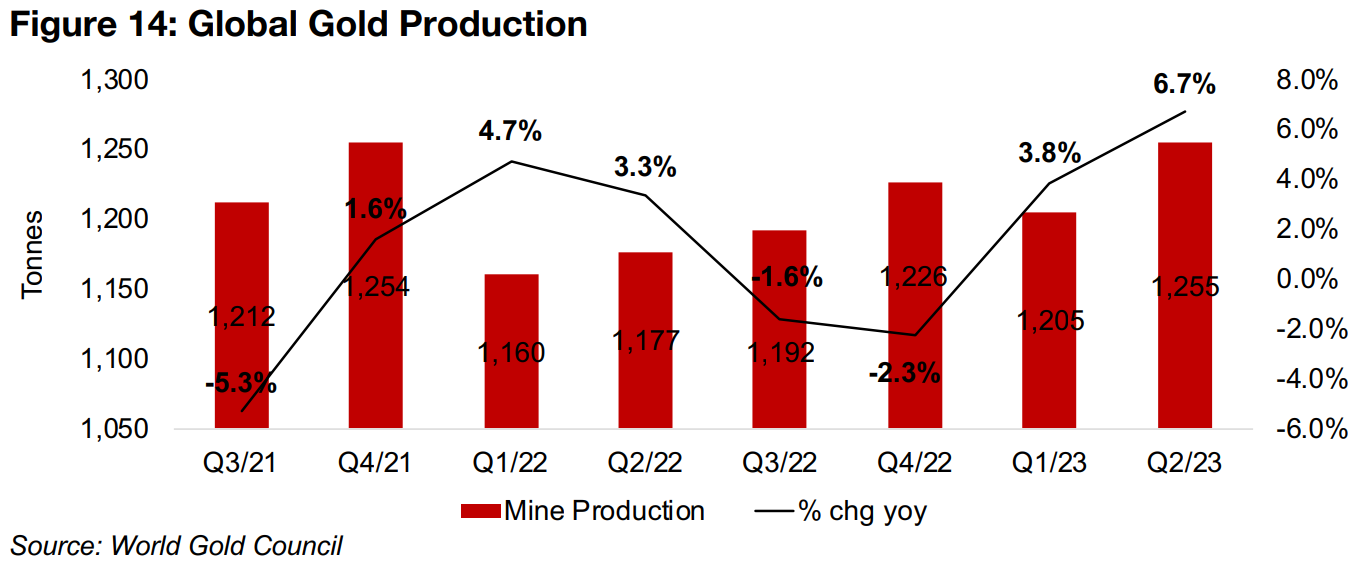
The trend for global gold production has been strong, rising 6.7% year on year to 1,255 tonnes in Q2/23, up from 1,205 tonnes and growth of 3.8% in Q1/23, rebounding from a -2.3% contraction in Q4/22 and -1.6% in Q3/22 (Figure 14). While with other metals, such a large increase in production along with a decline in demand might raise price concerns, the drivers of gold are quite different. These demand and supply statistics tend to have less of an effect on gold than the broader monetary situation, with gold viewed mainly as a currency and store of value, with limited industrial uses compared to copper or silver. The main driver for gold is instead changes in the global money supply, with the value of the global gold stock tending to remain proportional to this aggregate over the long-term. While there can certainly be deviations between the global gold and money supply value in the short to medium term, in recent years the ratio between the two has remained relatively steady.
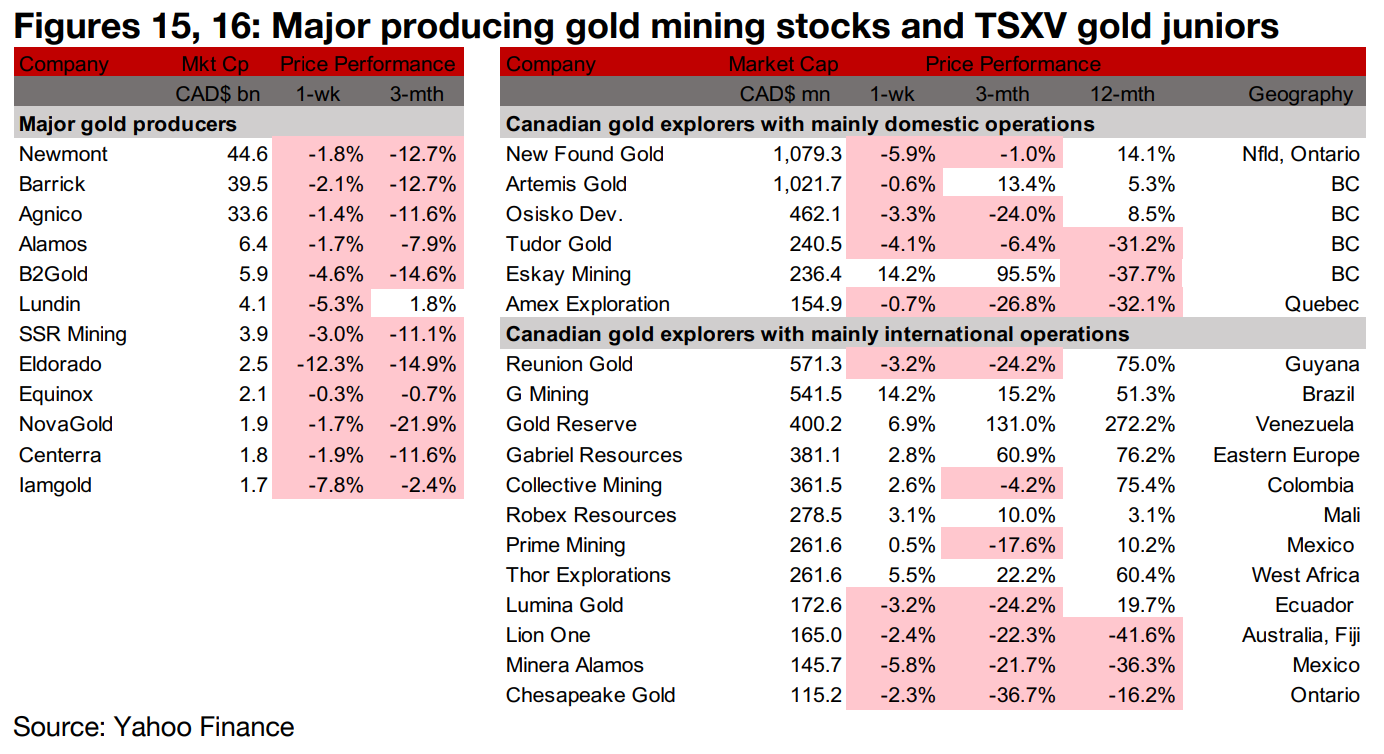
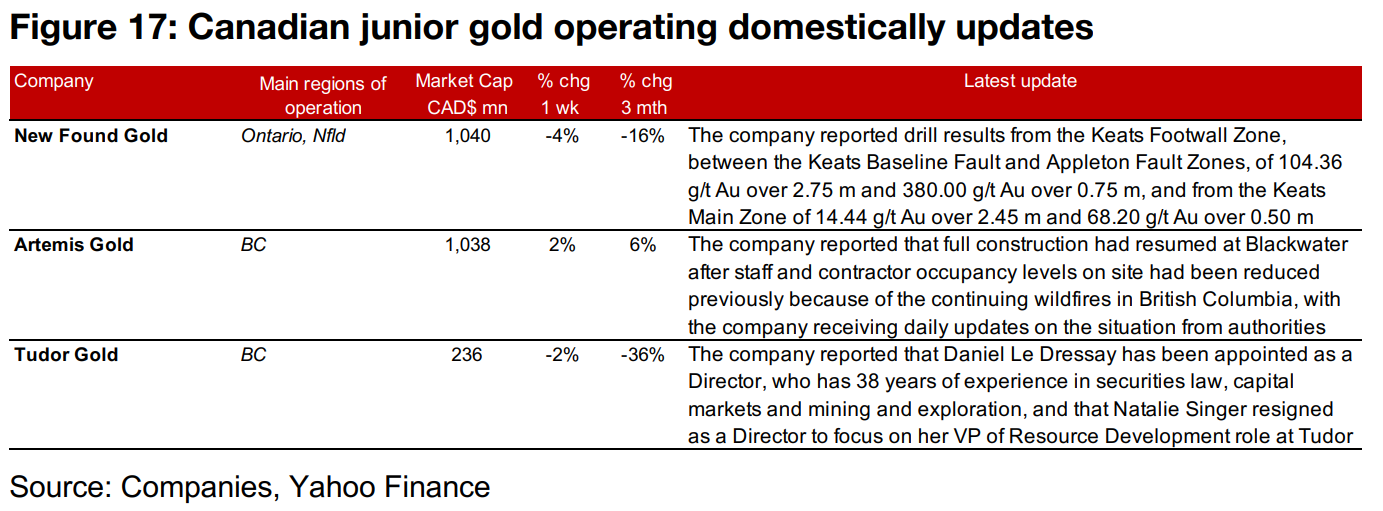
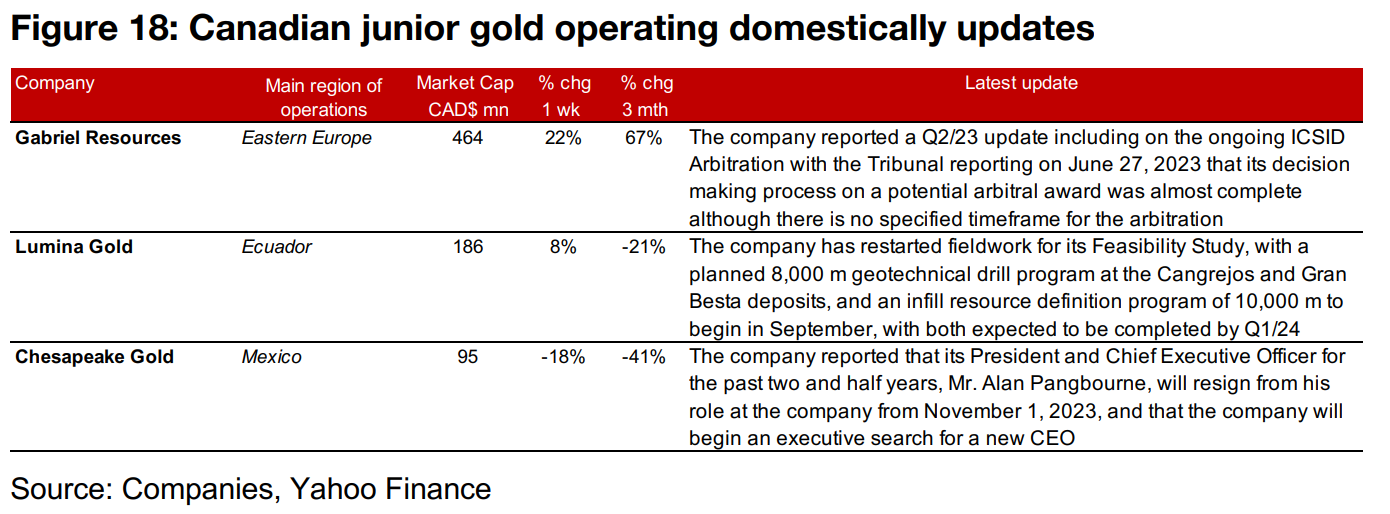
The major gold producers were all down and the large TSXV gold stocks were mixed (Figures 15, 16). For the TSXV gold companies operating domestically, New Found Gold reported drill results from the Keats Footwall and Keats Main Zones of Queensway, Artemis Gold resumed full construction at Blackwater after staff reduction because of ongoing wildfires, and Tudor Gold appointed Daniel Le Dressay as a Director (Figure 17). For the TSXV companies operating internationally, Gabriel Resources reported a Q2/23 update including progress in its ongoing ICSID Arbitration, Lumina Gold restarted drilling to support its Feasibility Study for Cangrejos and Chesapeake Gold announced that its President and CEO Mr. Alan Pangbourne was resigning (Figure 18).
Disclaimer: This report is for informational use only and should not be used an alternative to the financial and legal advice of a qualified professional in business planning and investment. We do not represent that forecasts in this report will lead to a specific outcome or result, and are not liable in the event of any business action taken in whole or in part as a result of the contents of this report.
Author
Ben McGregor authors the Weekly Roundup at CanadianMiningReport.com, providing sharp analysis of the metals and mining sector. With a talent for spotting trends, Ben distills complex market shifts into clear, engaging insights on TSXV junior miners. His weekly updates cover gold, copper, uranium, and more, blending data-driven perspectives with a knack for identifying opportunities. A vital resource for investors, Ben’s work navigates the dynamic junior mining landscape with precision.