
August 25, 2025
Gold rose -1.2% to US$3,374/oz, with the main driver being comments from the US Fed Chairman at a major global financial conference that the market took as implying a reasonably high likelihood of a rate cut at the meeting in September.
This week we look at the drivers of the TSXV Mining sector’s major outperformance of global equity markets, including the Top 50 largest stocks, and continued gold buying by global central banks which is on track to reach a similar level to last year.
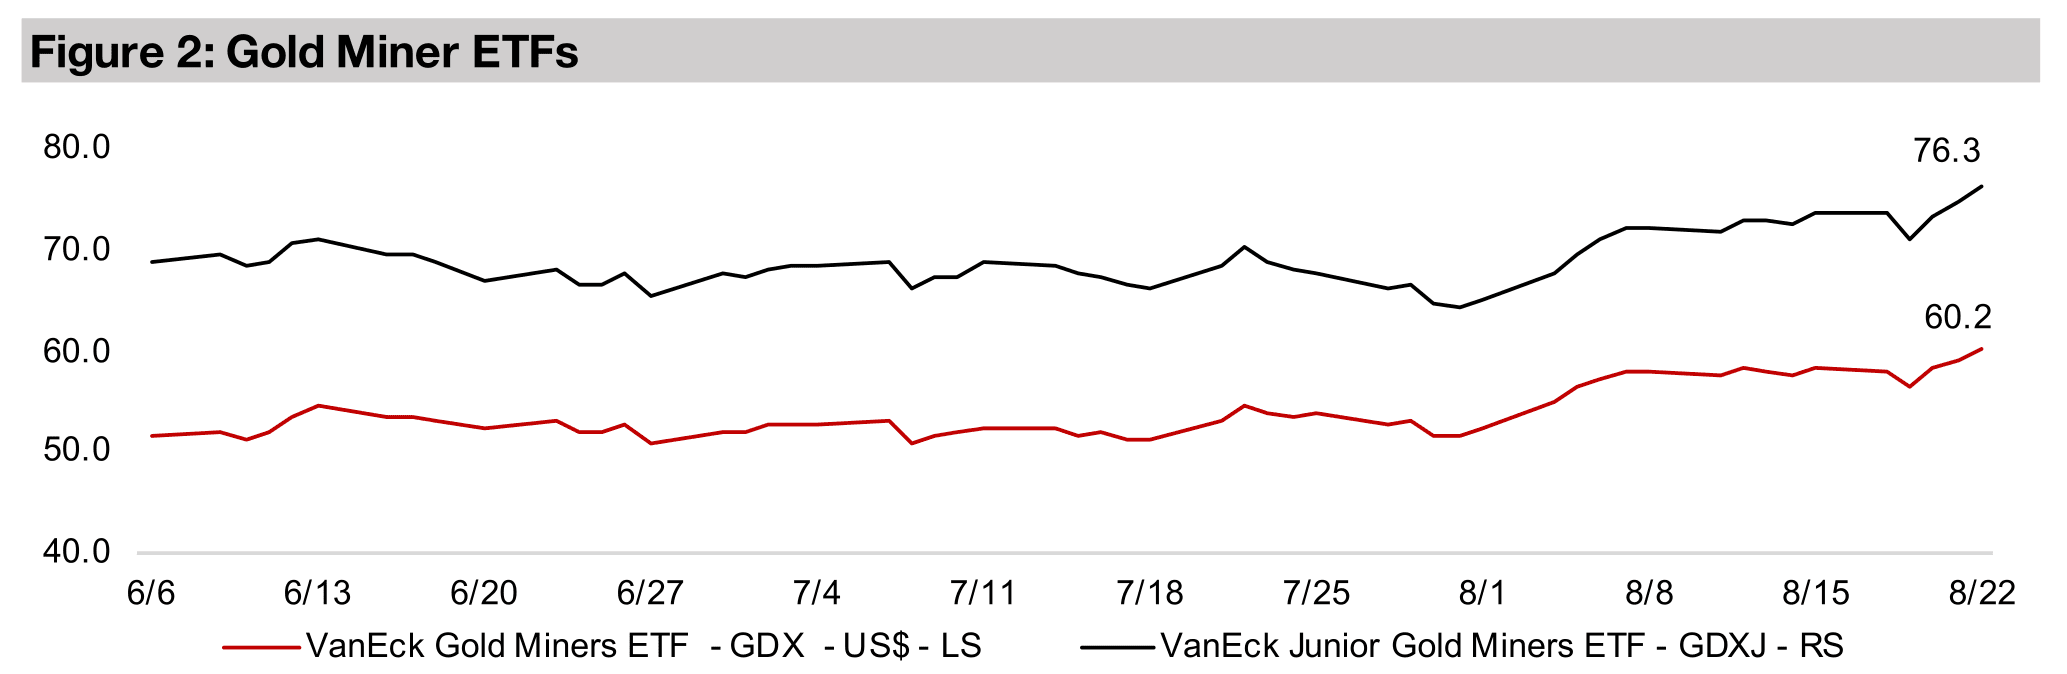
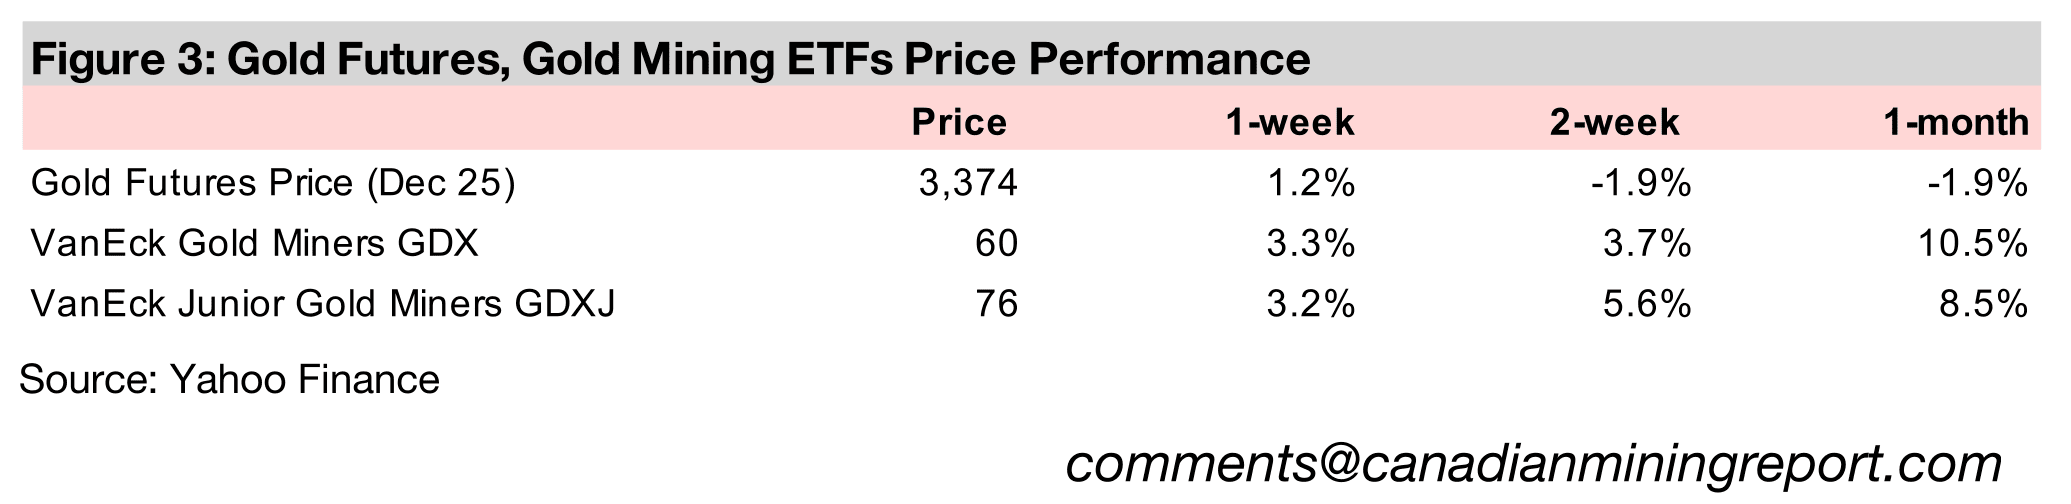
The gold stocks rose on the gain in the metal price, with the GDX up 3.3% and GDXJ up 3.2%, and both ETFs reaching new highs, as equities struggled, with the S&P up just 0.3% and the Nasdaq down -0.5%, although the Russell 2000 gained 3.2%.


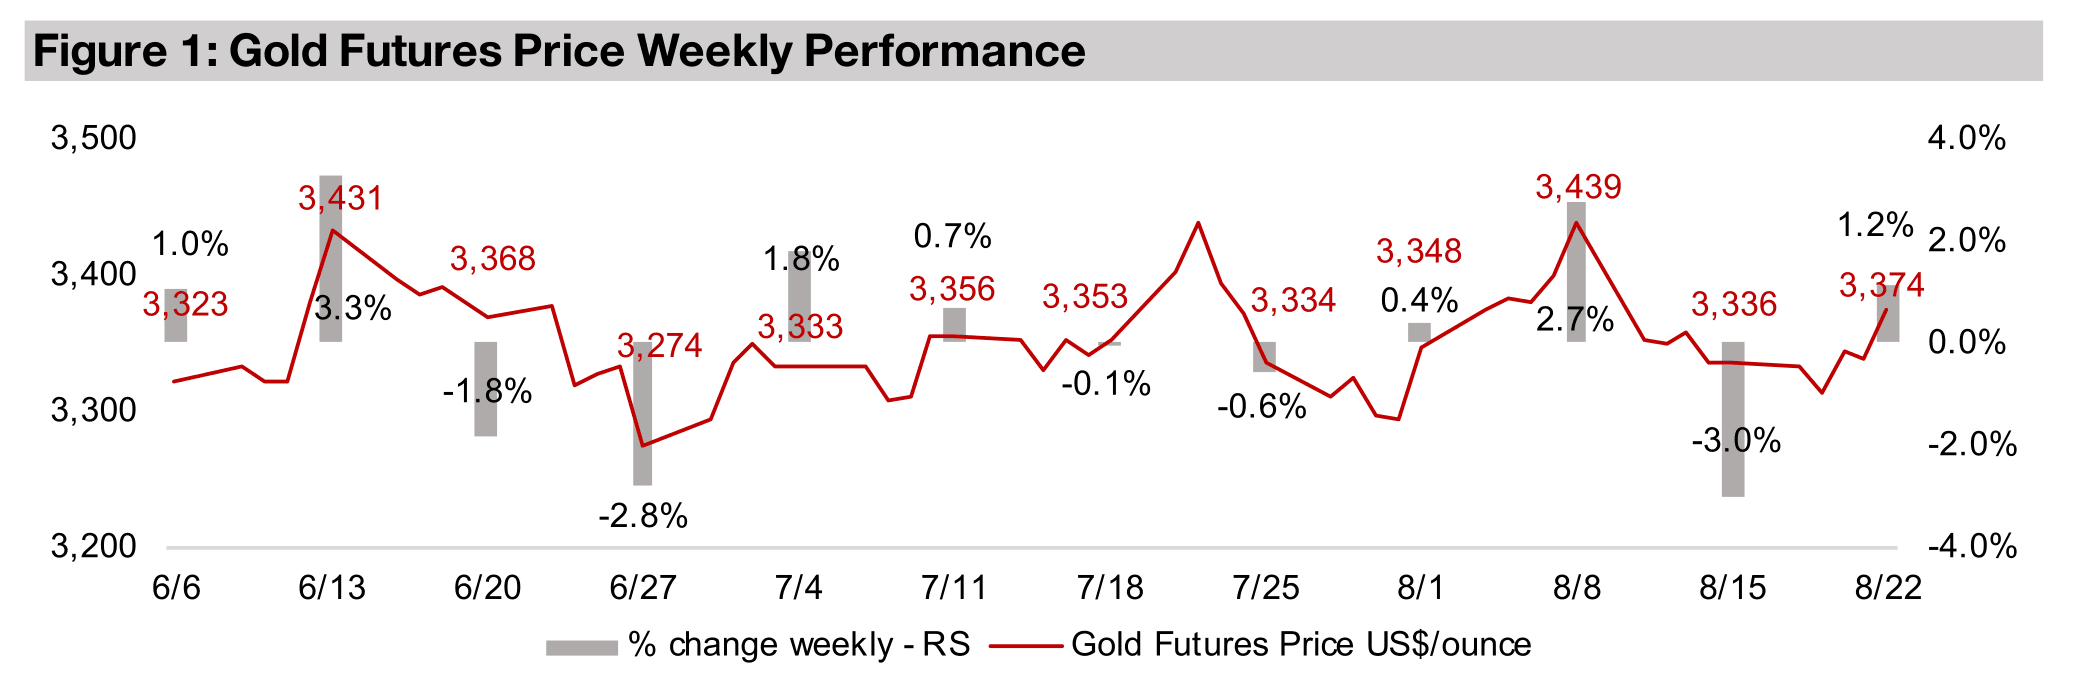
The gold price rose 1.2% to US$3,374/oz, well into its fourth month in a US$3,200/oz-
US$3,400/oz trading range. The biggest economic driver this week was the Fed
Chairman’s comments at the Jackson Hole economic symposium, an annual meeting
of central bankers and other major financial players, which the markets viewed as
indicating a rate cut in September. The probability of a Fed cut in September 2025
reported by the CME was at 75%, although this was actually down from 85% last
week, showing that some in the market still see a chance that upcoming employment
or other data could still swing the decision.
If the Fed does cut in September, it would see the last major global central bank with
rates still on hold this year finally enter the cutting cycle already underway for most
of the rest of the world. The US monetary base was already growing even with the
Fed maintaining rates, and cuts would likely boost this growth further, which could
be a driver for gold as it tends to rise along with the global money supply. The biggest
danger of rate reductions going fully globally is a resurgence of inflation that does not
drive significant economic growth, resulting in stagflation, although historically the
gold price has tended do well in this type of scenario.
As markets had actually declined earlier in the week, the Fed Chairman’s comments
on Friday only pushed the S&P 500 back to a marginal 0.3% gain. While the Nasdaq
actually declined -0.5%, the small cap Russell 2000 index outperformed, rising 3.2%,
showing that there was some risk taking, but it was not focussed entirely on tech as
had been the case for much of last year. The gold stocks went on to set new highs,
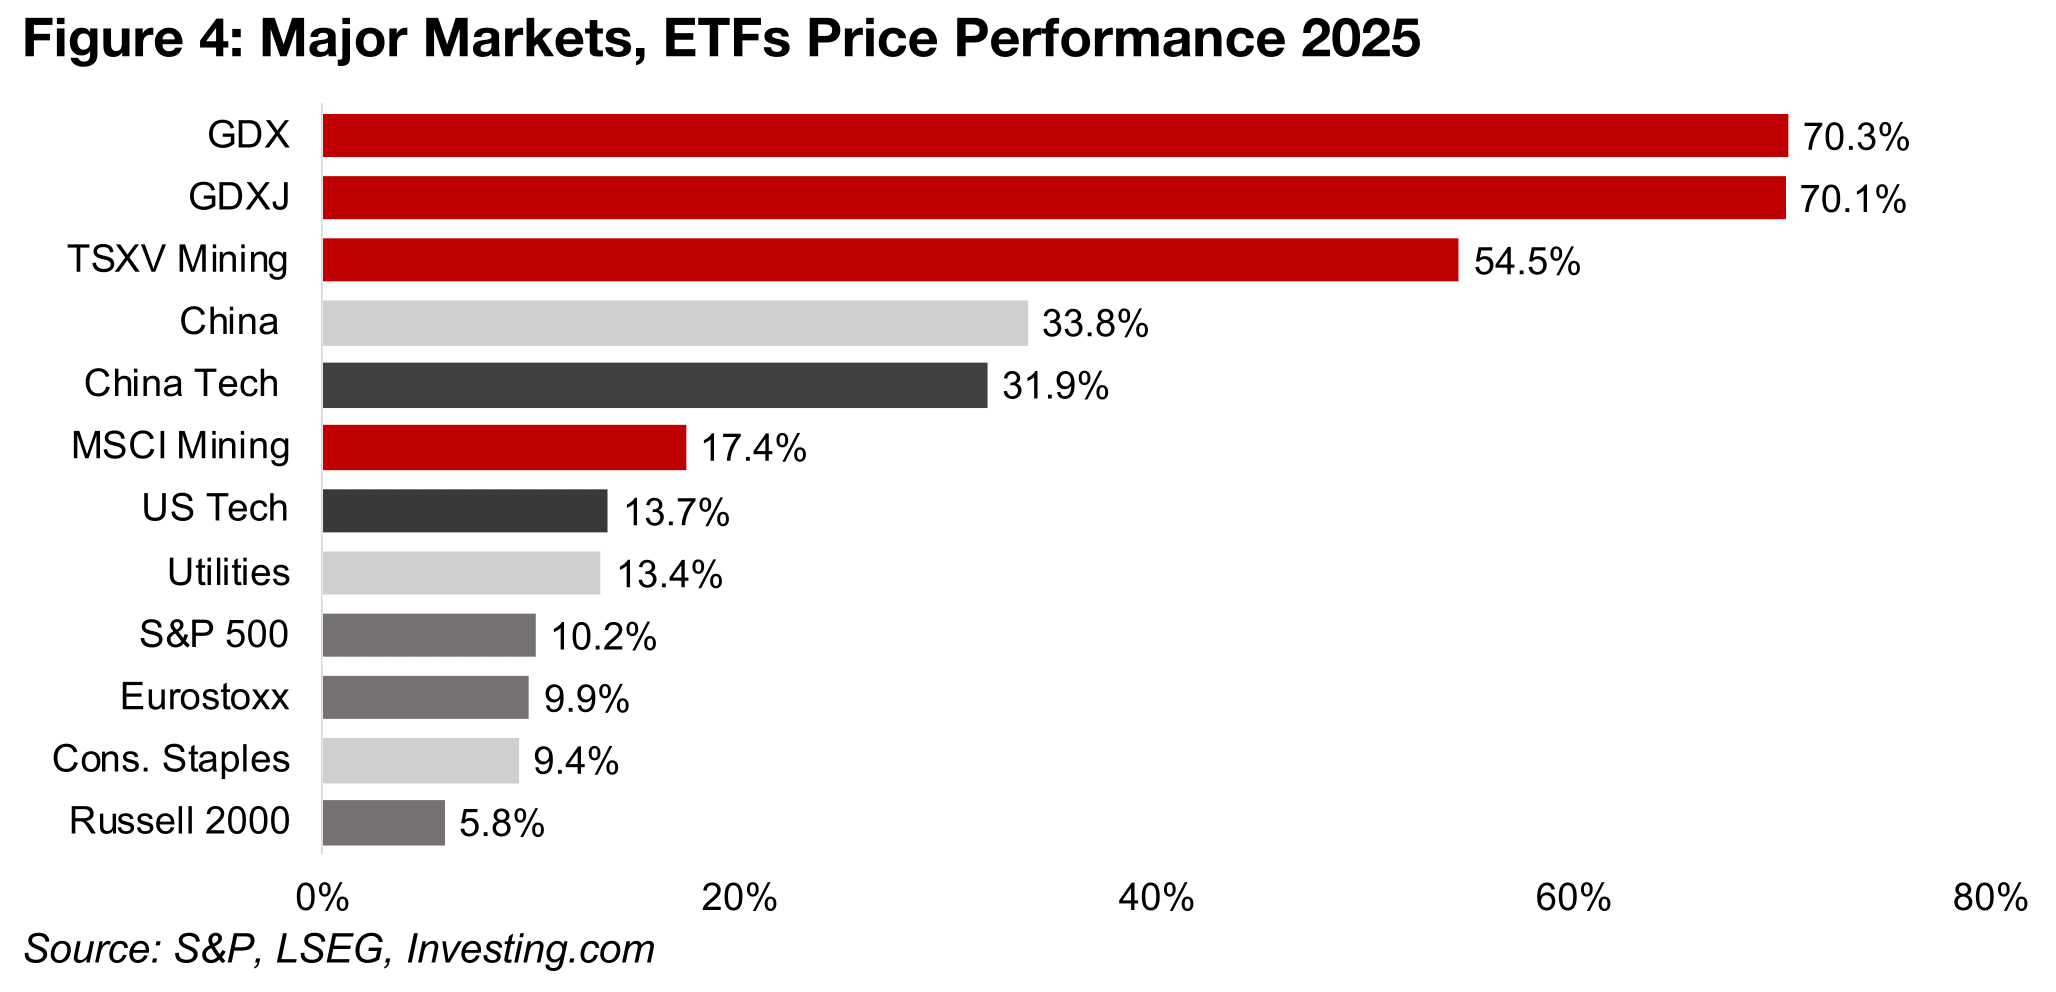
with the GDX up 3.3% and GDXJ rising 3.2%, which has seen the ETFs dramatically
outperform all the major global equity markets this year, rising 70.3% and 70.1%
respectively (Figure 4). The gold sector has been a large part of the TSXV Mining
sector’s outperformance this year, with it up 54.5% and also far ahead of the major
global equity markets. Even the MSCI Metals & Mining sector, which had been a
major laggard last year, because of its high exposure to a sliding iron ore price, has
outperformed global markets, up 17.4%.
The gold stocks and TSXV Mining are dramatically ahead of the 10.2% gain YTD of
the S&P 500 and the 9.9% rise in the Eurostoxx 600. They have also doubled even
the huge rebound in China, up 33.8%, which has been partly been driven by a big
year for Chinese tech, up 31.9%. This shows that tech trade has actually continued,
but just shifted away from being mostly being driven by US tech, which is up just
13.7%. US tech gains have likely been truncated by extreme valuations, with the
sector P/B at twice the level of the next highest few sectors. In addition to gold, the
market also continues to hedge with other defensive sectors, with the Global Utilities
sector up 13.4%, just below US Tech, and consumer staples, another defensives
sector, up 9.4%, slightly under the gain in the S&P 500.
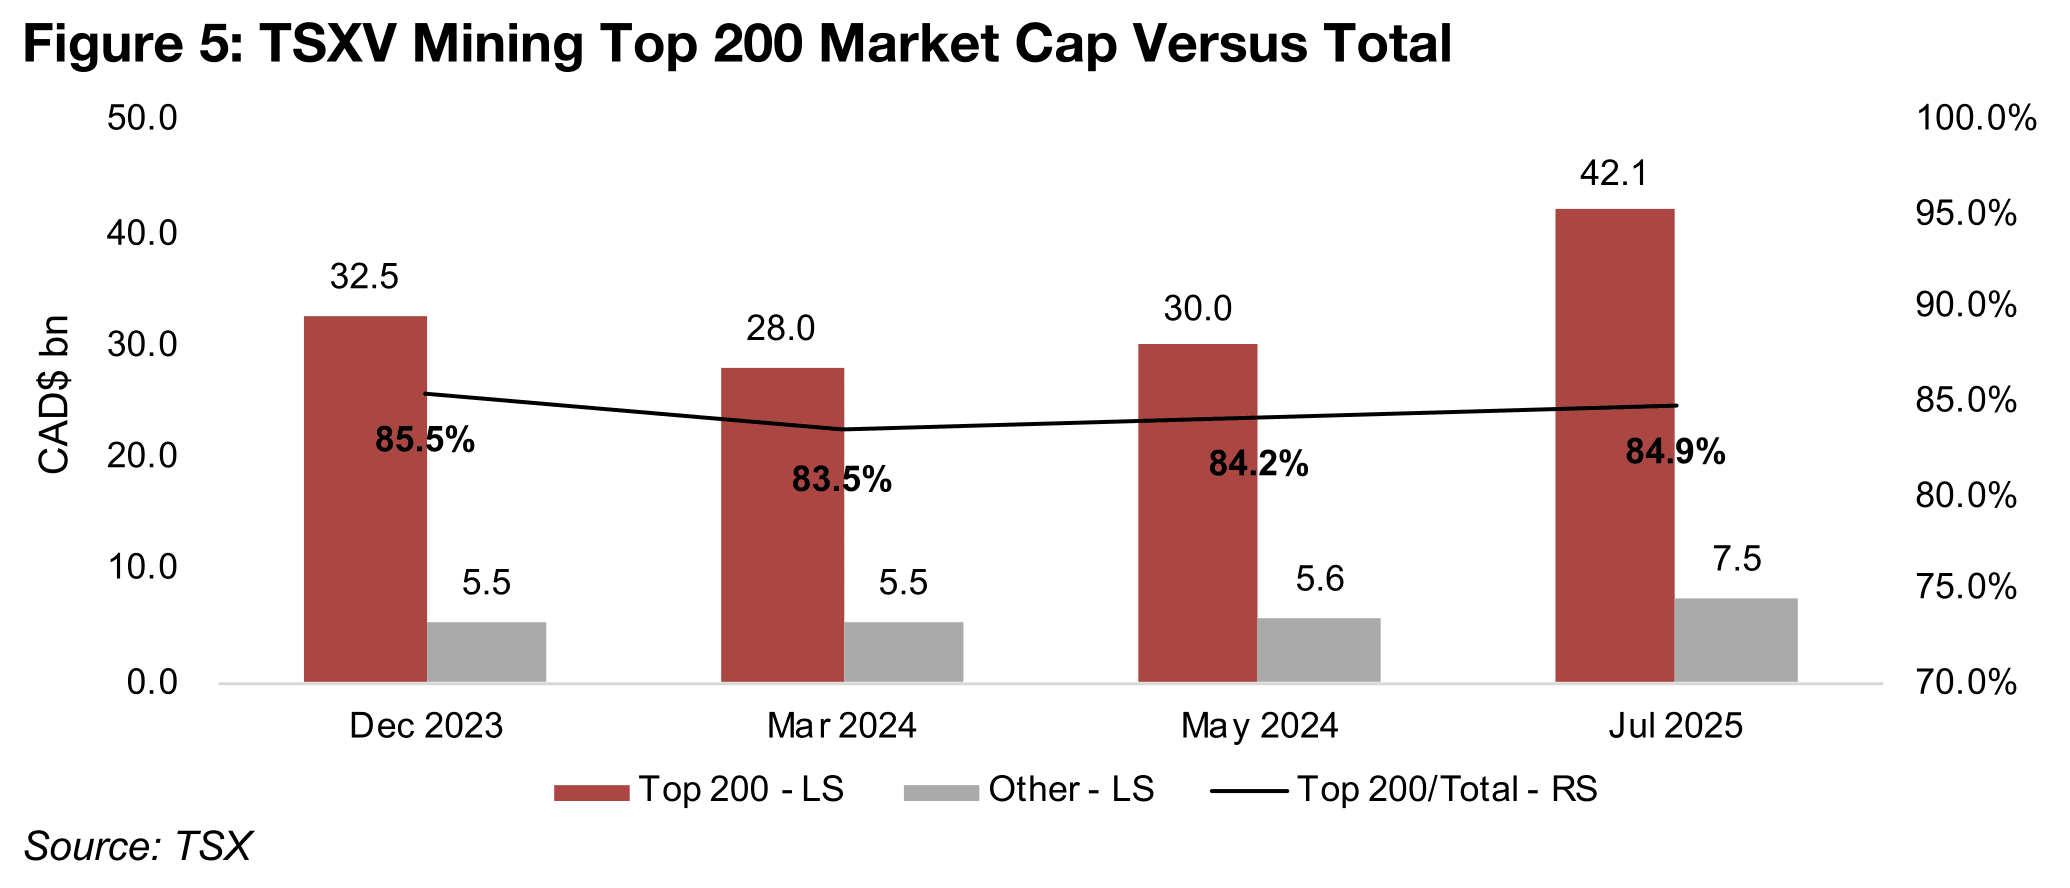
While the strong gains in gold stocks have the main driver behind the surge in the TSXV Mining sector this year, there have been gains for copper stocks and other metals. The underlying movements of most of the TSXV Mining sector can be tracked just looking at the Top 200 stocks in the index, which have comprised about 84%- 86% of the total market cap in recent years (Figure 5). This year has seen a clear jump in the market cap of the TSXV Mining sector, to CAD$49.6bn, after it was relatively stagnant through 2024 averaging around CAD$35.0bn. The TSXV Mining sector tends to have just below thousand stocks, with only the top two hundred currently with a market cap of around CAD$100mn or more. The CAD$42.1bn for the Top 200 in July 2025 implies an average market cap just over CAD$200mn, with the rest very small or microcap stocks, with the CAD$7.5bn for the remaining 700 stocks implying an average market cap of just CAD$10.0mn.
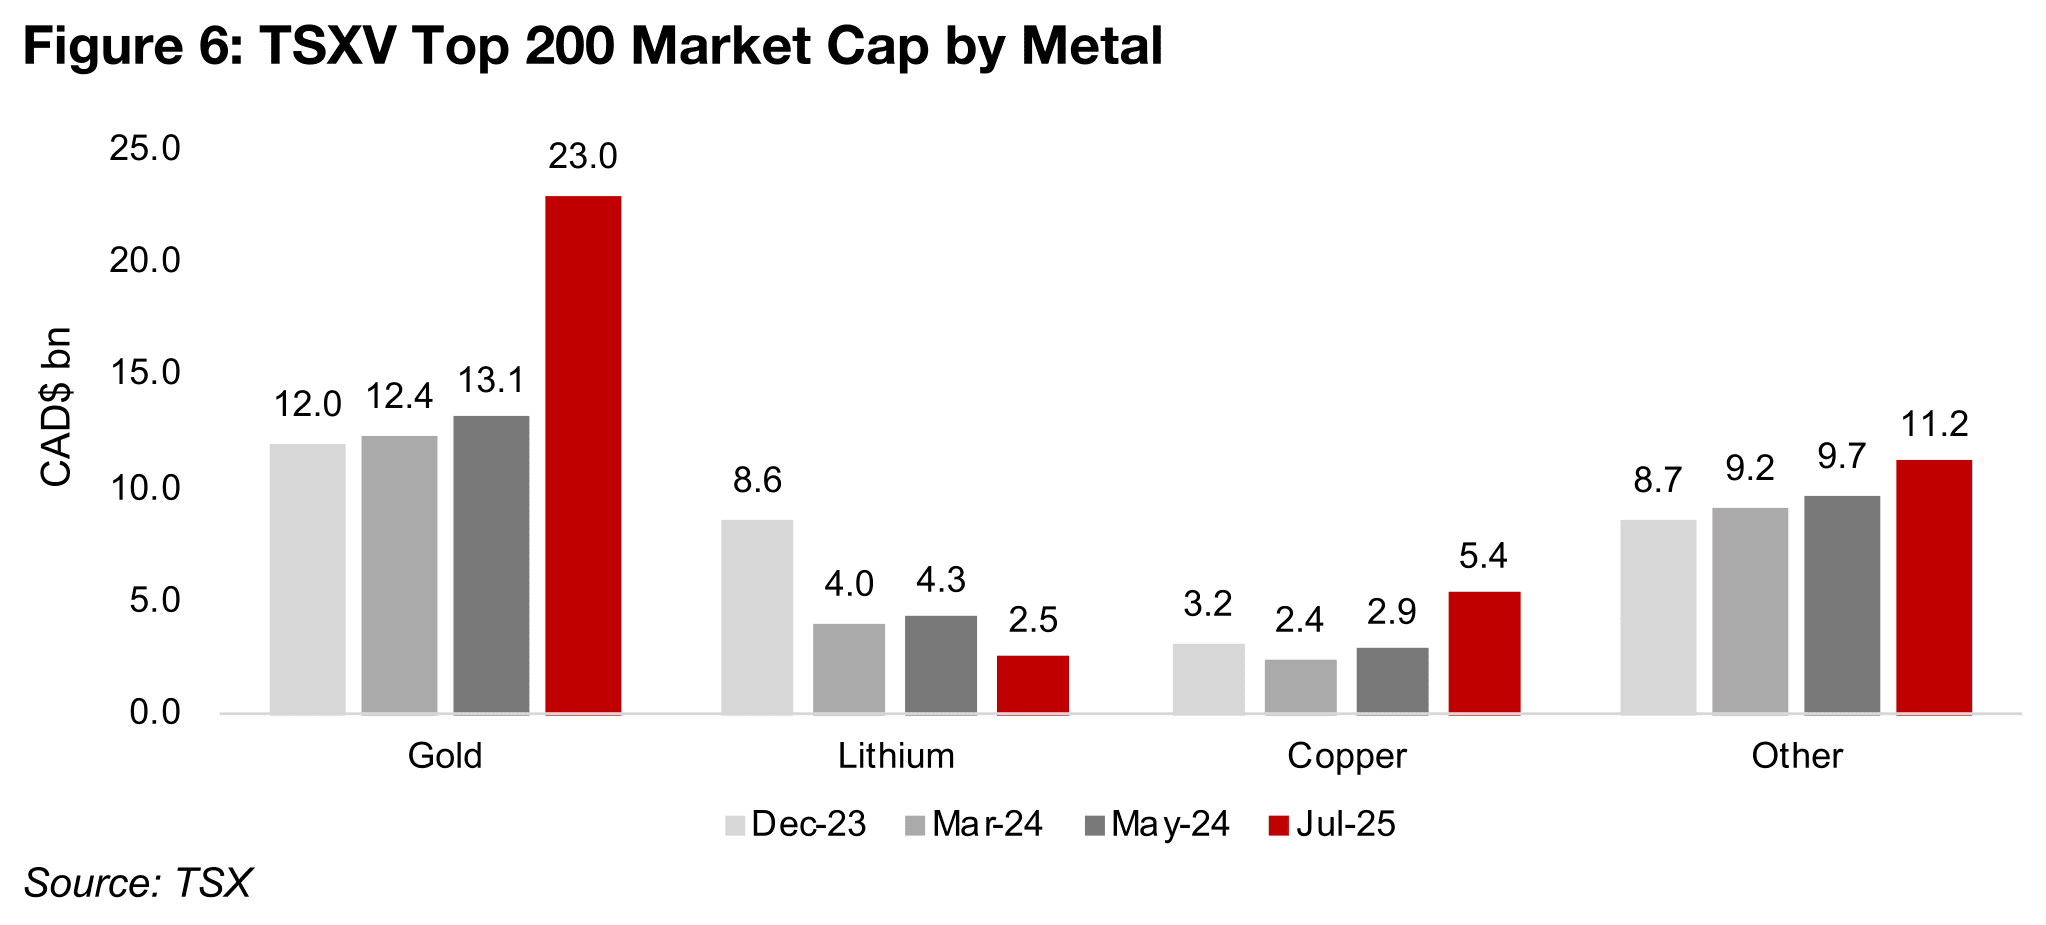
The major gain in the market cap from May 2024 to July 2025 has clearly come from the gold sector, up around CAD$10.0bn to CAD$23.0bn (Figure 6). The growth rate for the copper sector has also been strong, but it is a much smaller contributor, at just CAD$5.4bn, rising CAD$2.5bn from CAD$2.9bn as of May 2024. The lithium sector has seen a major decline, down CAD$1.8bn to CAD$2.5bn on the plunge in the metal price. The other metals combined are a high CAD$11.2bn, but their rise has been much more gradual, up CAD$1.5bn from CAD$9.7bn last year.
The entire TSXV Mining sector is only updated periodically by the TSX, and the
constituents of the Top 200 can have major shifts month to month, with the market
caps of junior miners often rising or falling rapidly on drill results and other releases.
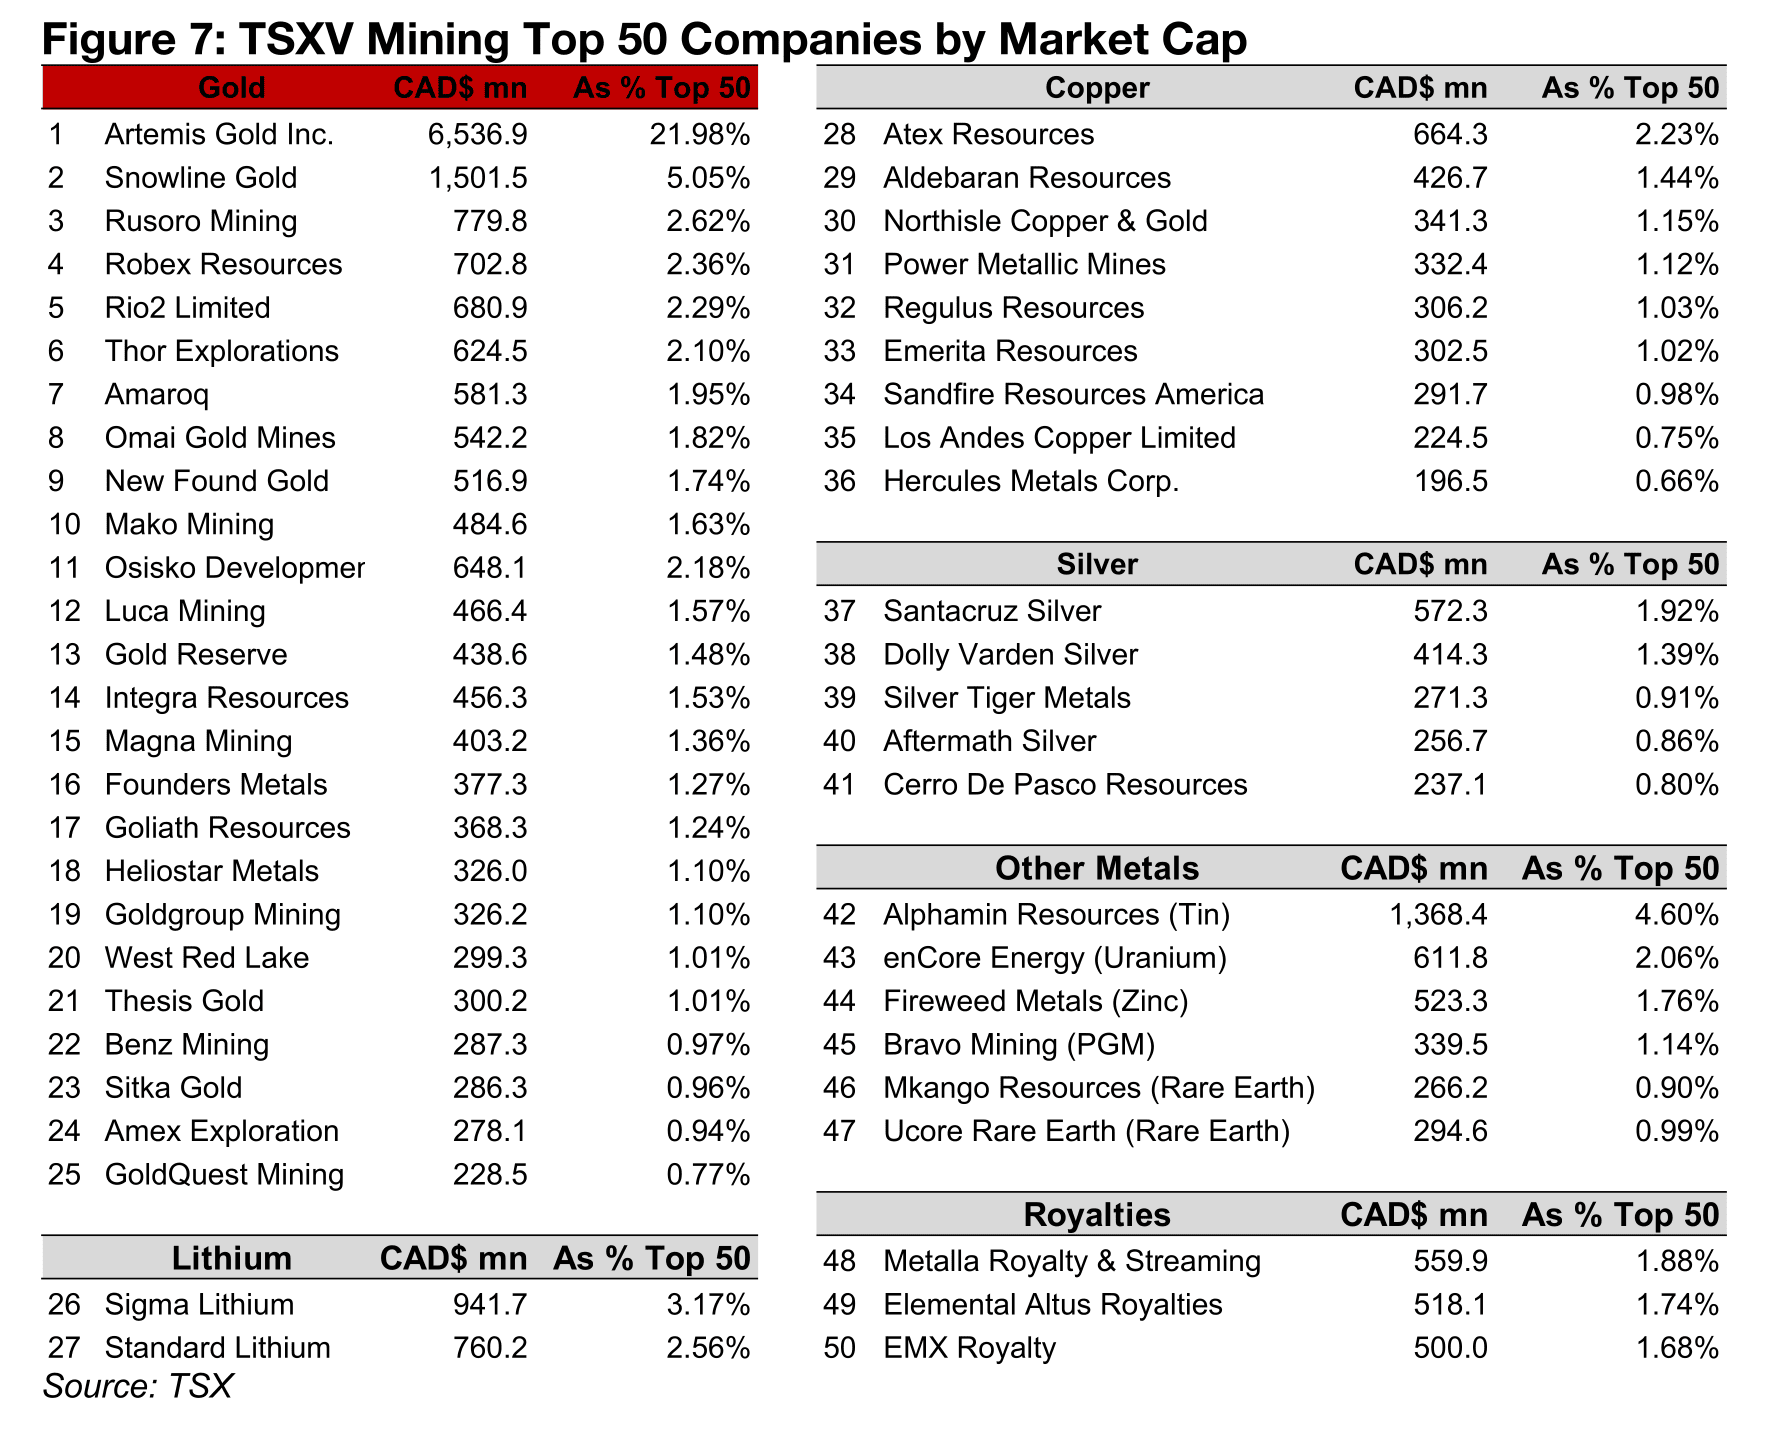
The TSXV Mining Top 50 constituents tend to be more stable, and account for about
50% of the TSXV Mining market cap, which still gives a detailed picture of the main
components of the sector, with the rankings as of August 2025 shown in Figure 7.
There is a single stock, the gold producer Artemis, which clearly outweighs every
other TSXV Mining stock, with a CAD$6.5bn market cap, or 22.2% of the total Top
50. The company’s huge gold and silver Blackwater project in British Columbia
entered commercial production this year, and its value has more than quadrupled
from CAD$1.8bn in May 2024. The second largest stock in the sector, Snowline Gold,
has a market cap of CAD$1.5bn, at 5.1% of the Top 50 market cap, with it being
driven by strong drill results from its Rogue project in the Yukon. The rest of the
largest gold stocks are tiered more gradually from CAD$770mn to CAD$232mn.
The other two largest stocks in the index are Sigma Lithium, with a CAD$0.9bn market
cap, although this has plunged well over CAD$1.0bn from CAD$2.3bn in May 2024,
and Alphamin, a tin company, with a market cap of CAD$1.4bn, around the same
level of the CAD$1.5bn of May 2024. The largest copper, silver and royalties
companies have far smaller market caps of around CAD$600 mn.
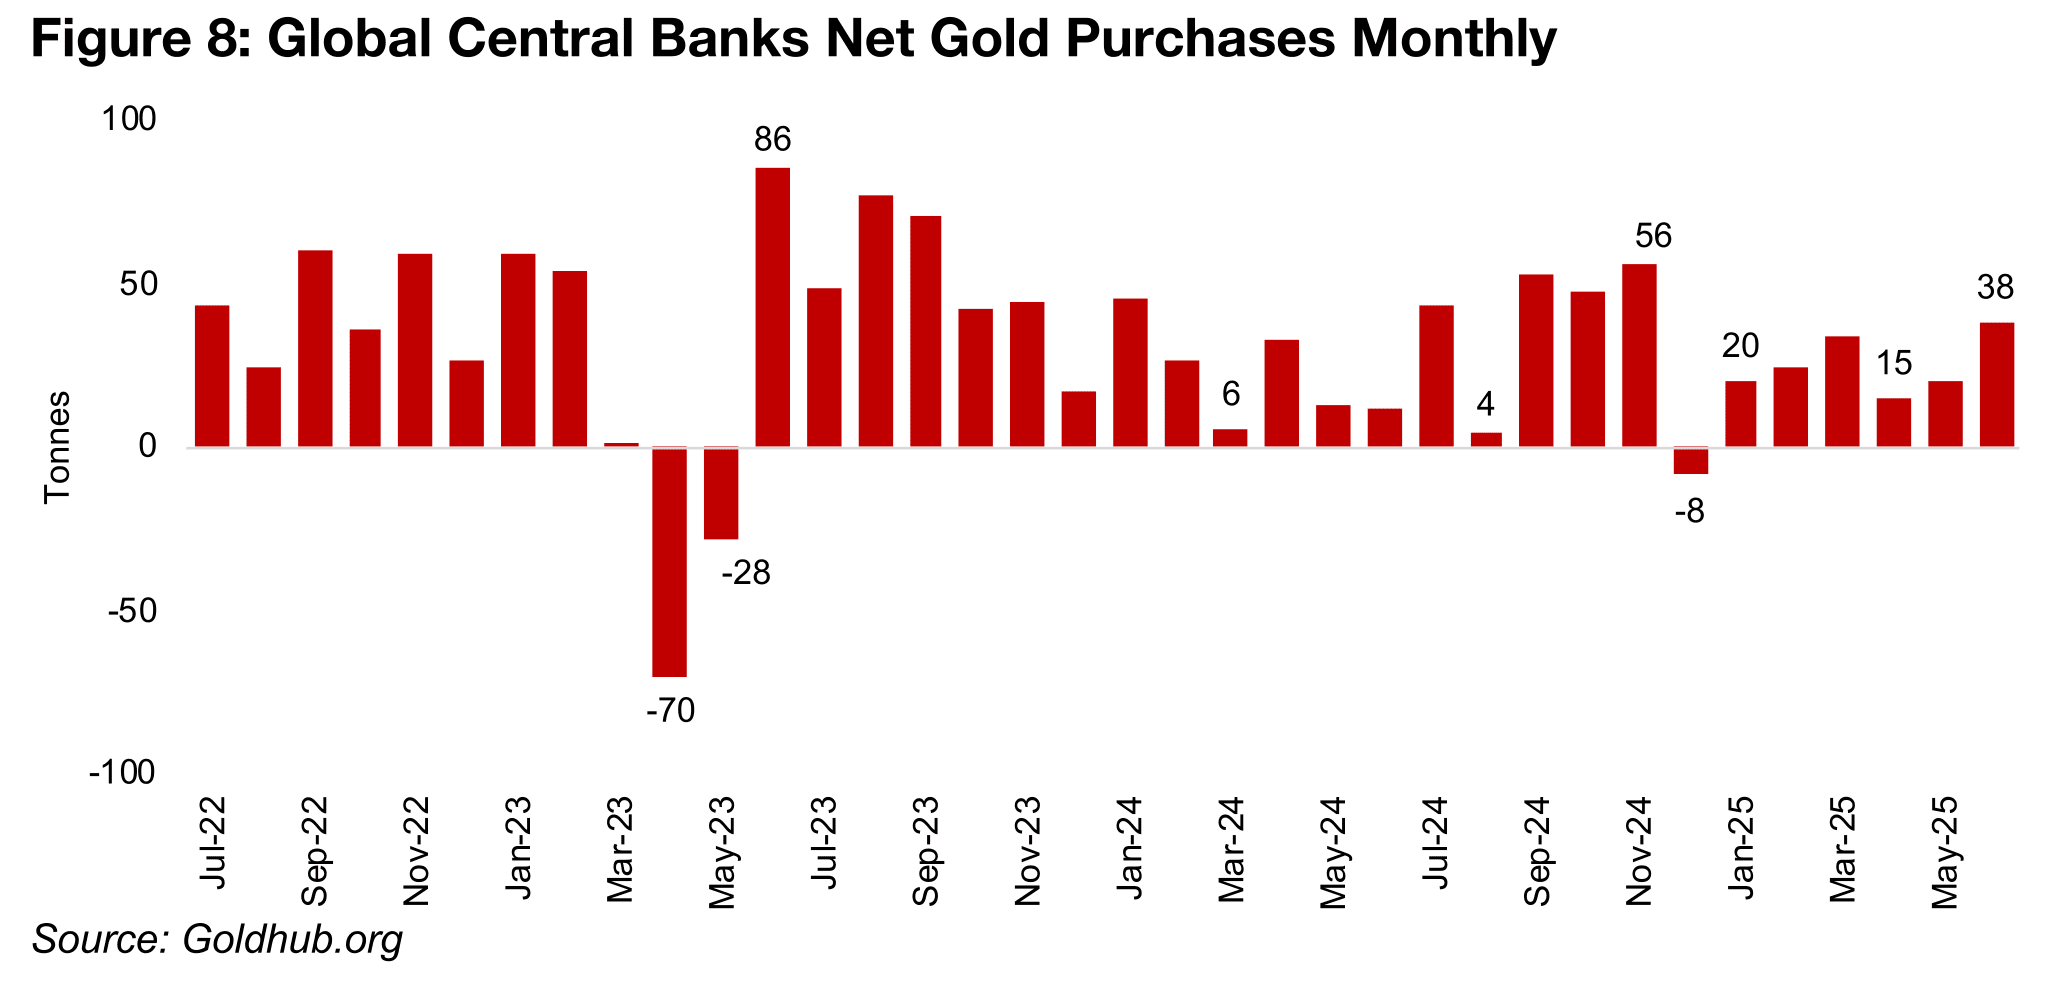
One major driver of the gold price in recent years has been ongoing central banks
buying, which has continued year to date. Net purchases as of the latest reported
June 2025 figures were 38 tonnes, the highest level so far this year, with an average
25 tonnes of monthly buying, just slightly below the 2024 average of 28 tonnes (Figure
8). Last year had one month with net sales of gold by global central banks and another
two months where they were near zero, but so far this year even the lowest month,
April 2025, still saw purchases of 15 tonnes.
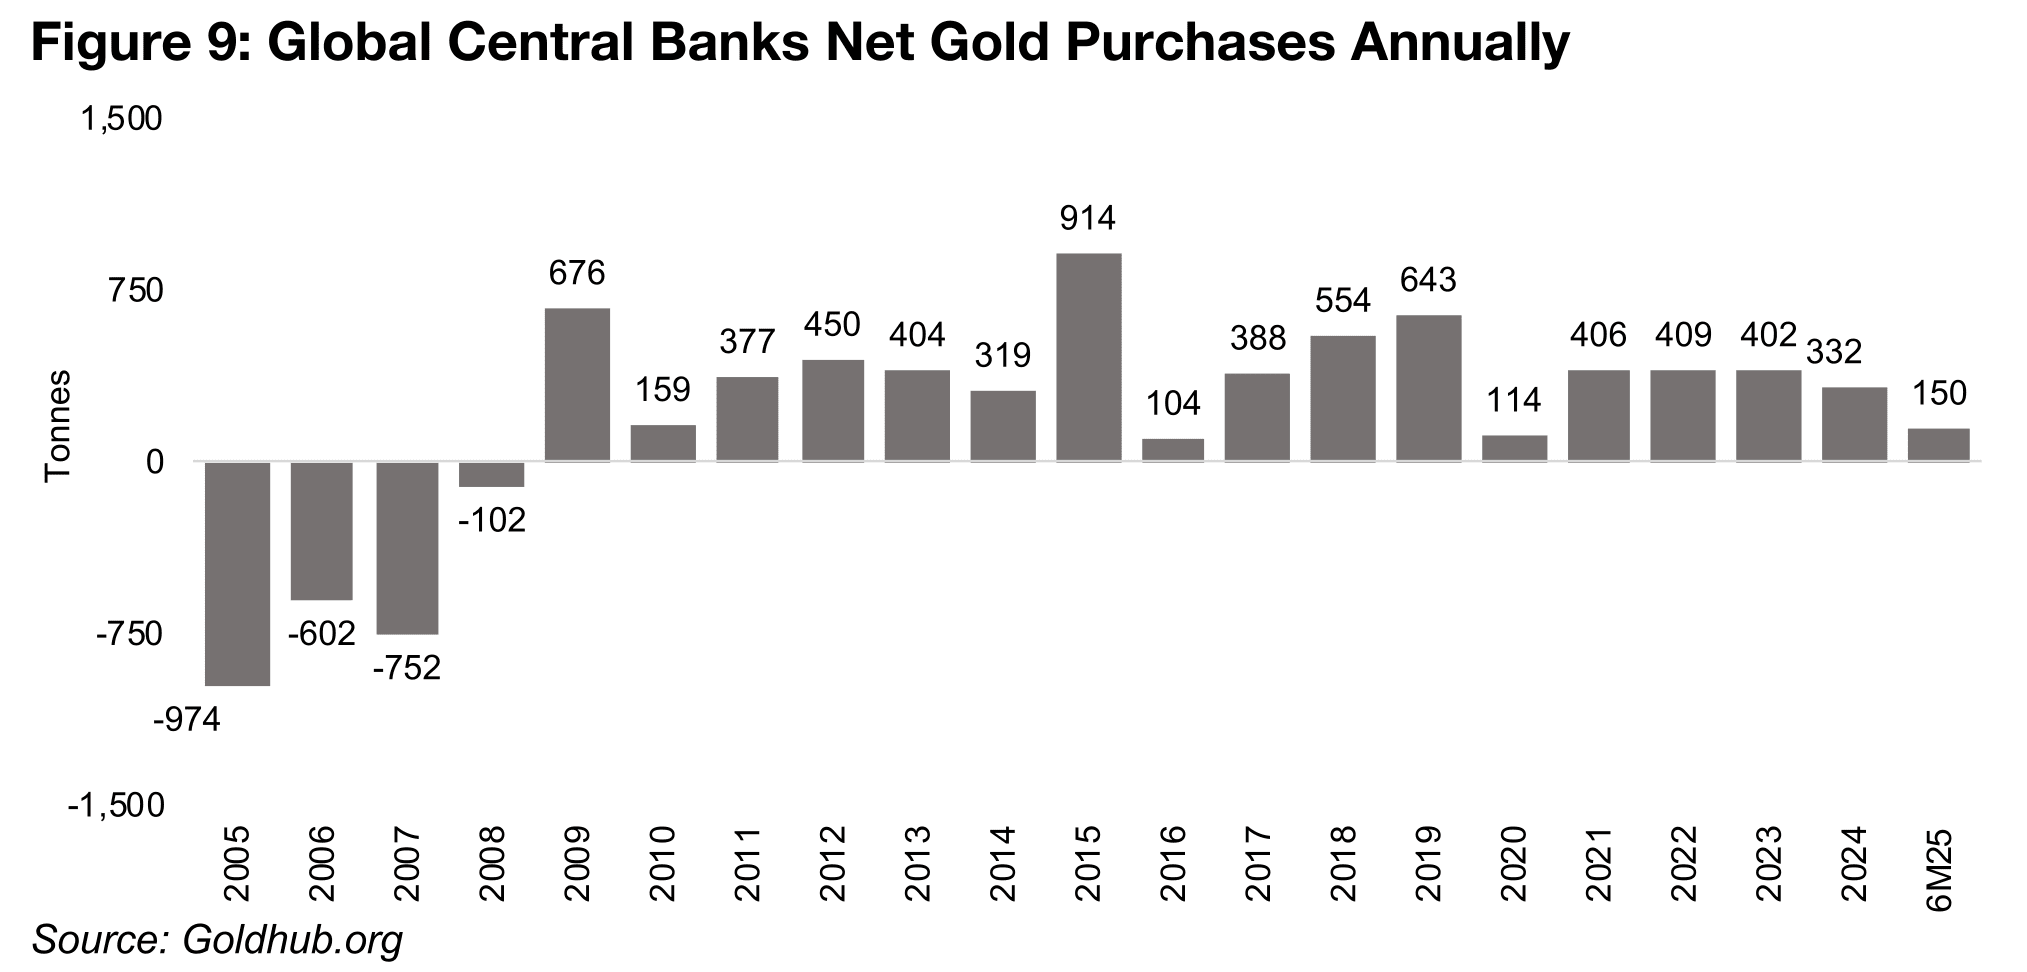
The total H1/25 purchases were 150 tonnes, on track for 300 tonnes at the current
rate, and with a slight rise half on half, could reach the 2024 level of 332 tonnes (Figure
9). While we had previously been concerned that the high gold price could drive
central banks to hold back on gold purchases, this has not been the case. This could
partly be because of a gradual and ongoing rebalancing of the global financial system
away from the US$ as the reserve currency. Many central banks may be building up
gold holdings to hedge against any major disruption that could arise from this shift.
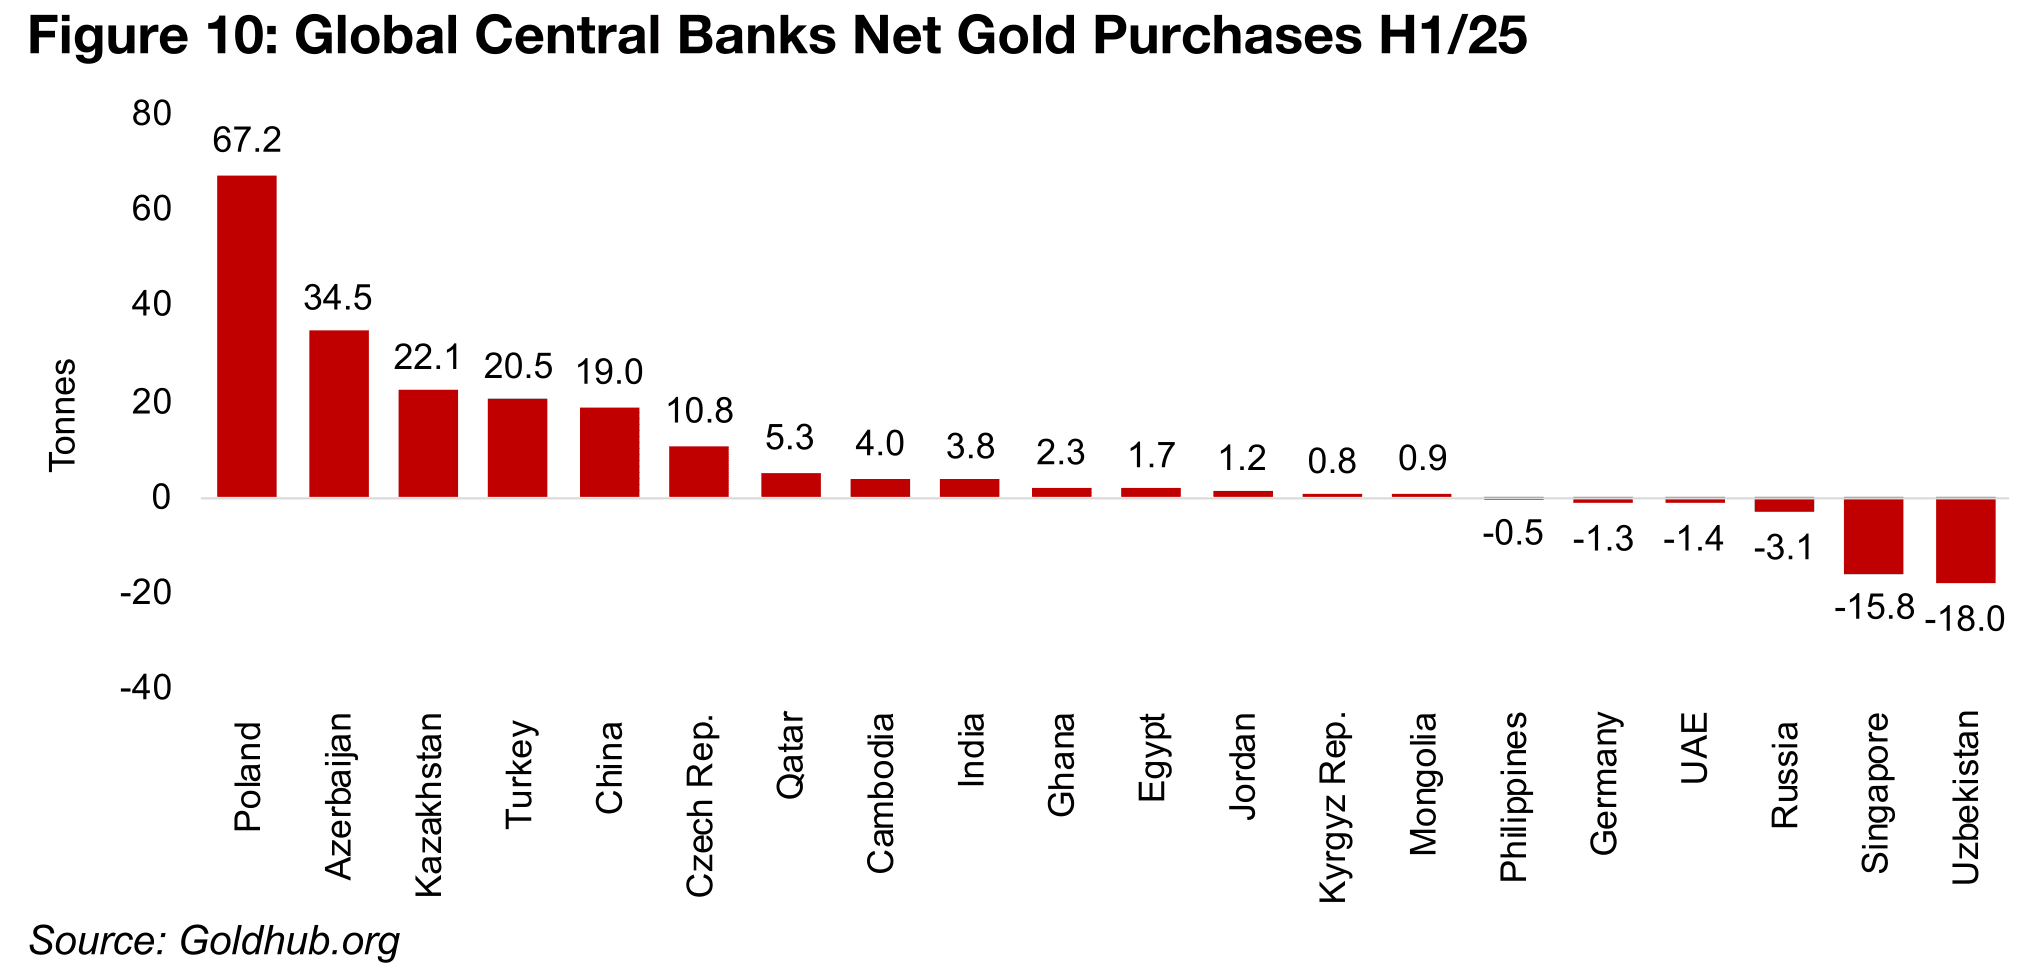
The major central bank net buyers of gold over the past twenty years have been Russia and China, but this has not been consistent and very large purchases can be concentrated in a given period. For H1/25, of these two, only China made relatively large net purchases of 19.0 tonnes, while Russia had net sales of -3.1 tonnes (Figure 10). Gold buying by central banks for small and mid-sized countries can come in quite large blocks, but these can be one offs with no additional purchases made for a long period. This year shows this with several mid-sized countries making by far the largest purchases. Poland made net gold purchases of 67.2 tonnes in H1/25, Azerbaijan, 34.5 tonnes, Kazakhstan, 22.1 tonnes and Turkey, 19.0 tonnes. The largest net sellers were Singapore at -15.8 tonnes and Uzbekistan, at -18.0 tonnes. Net purchases or sales from other countries were comparably small.
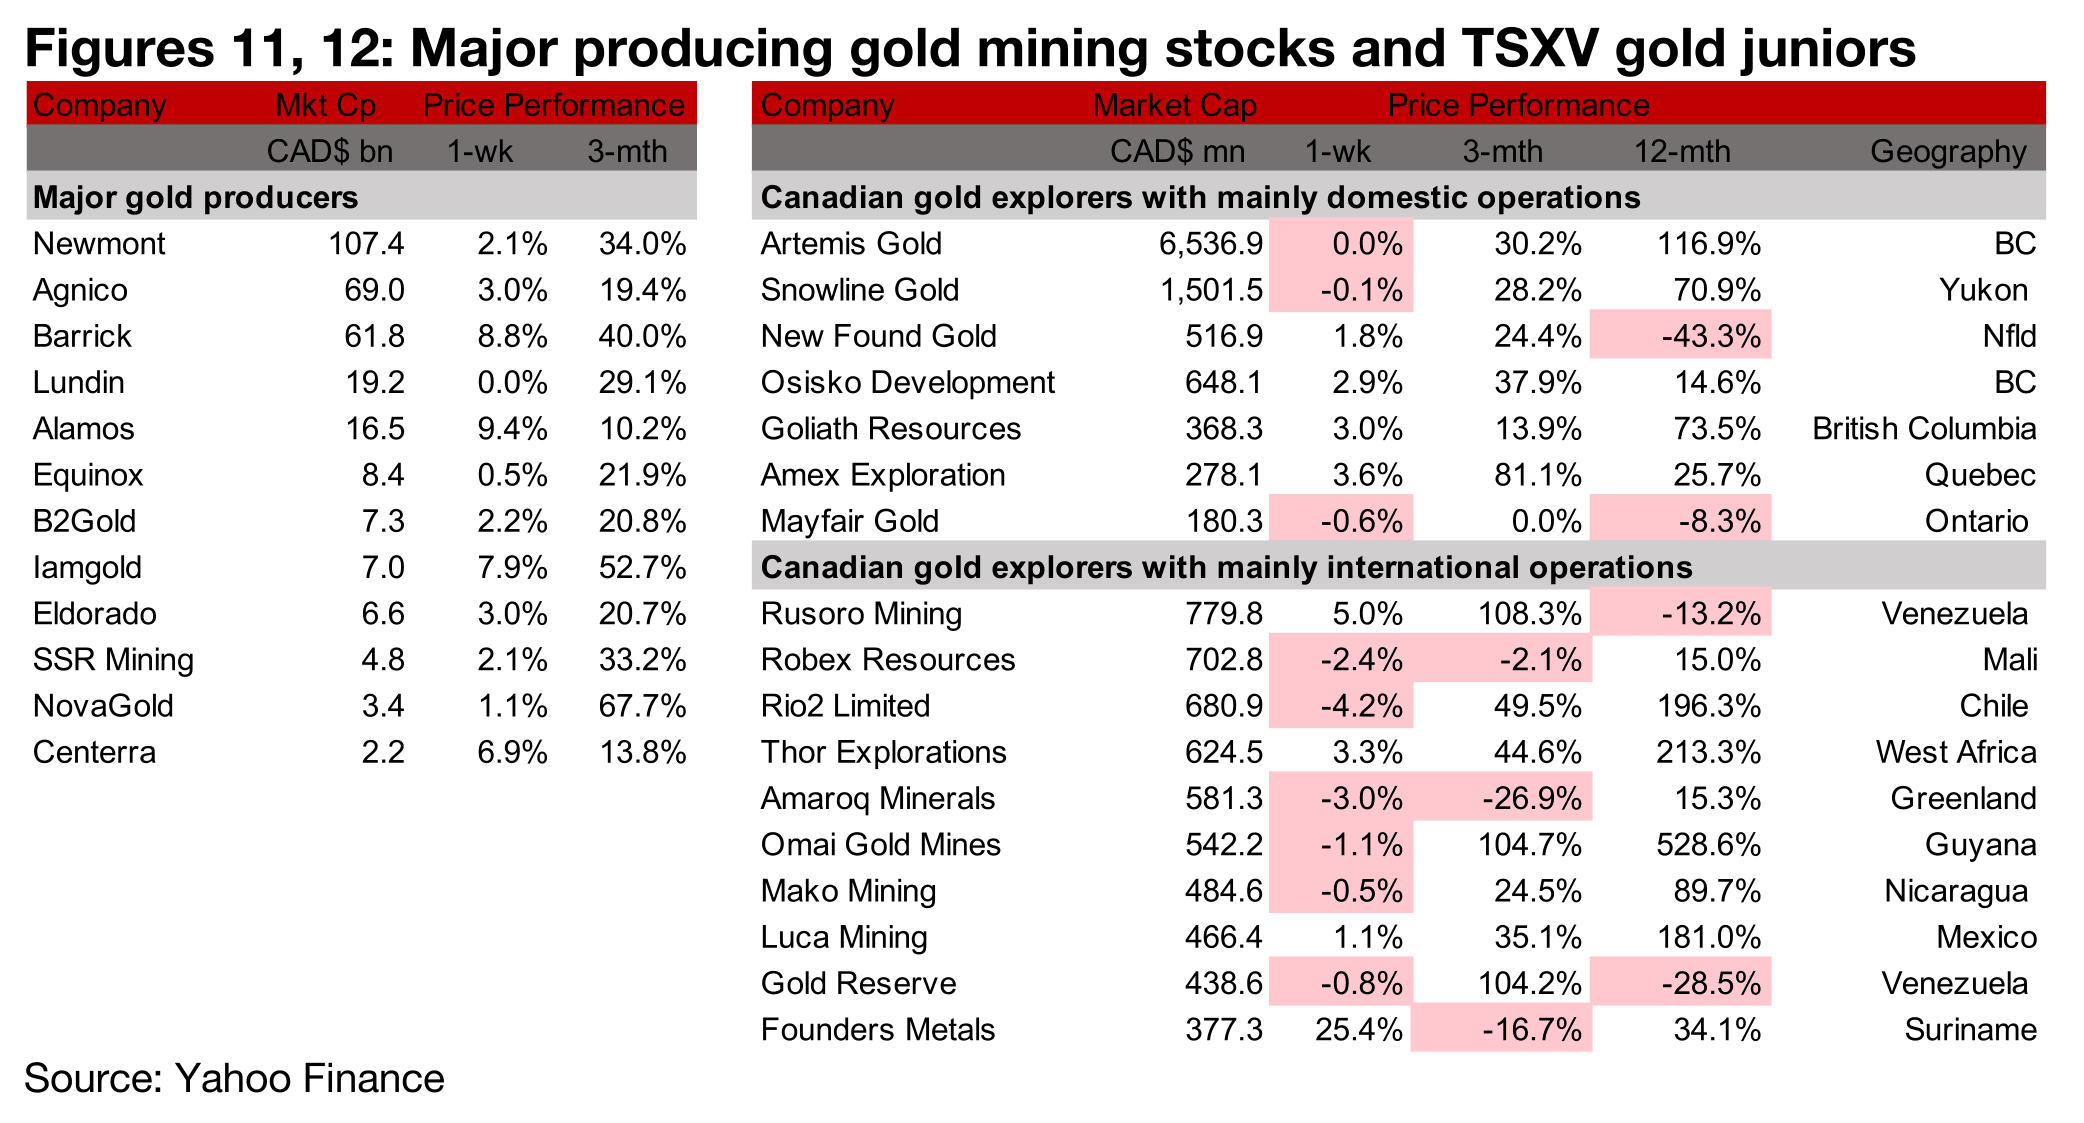
All of the large producers rose and TSXV large gold was mixed as the gold price
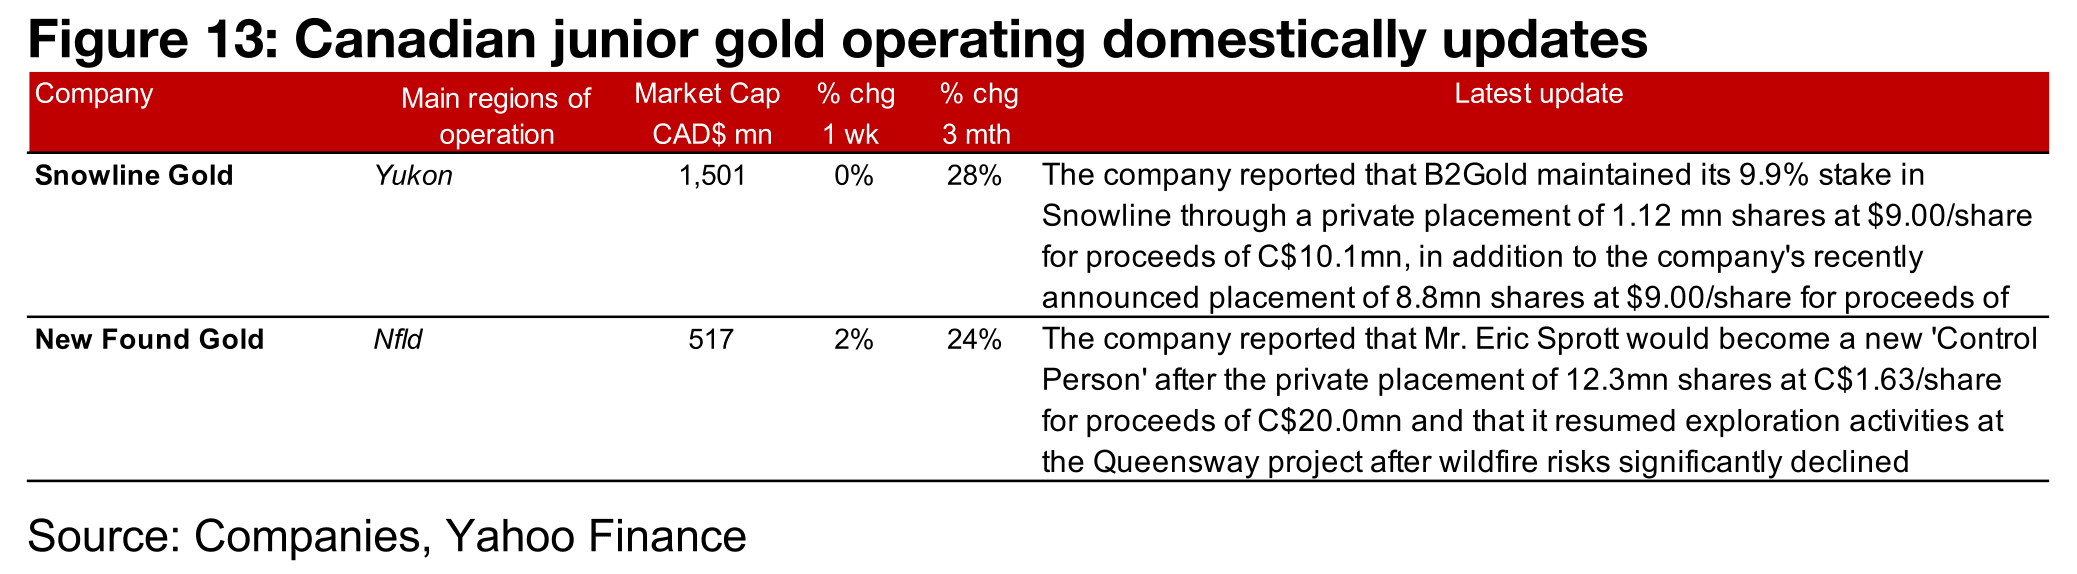
gained (Figures 11, 12). For the TSXV gold companies operating mainly domestically,
Snowline Gold reported that B2Gold has maintained its stake in the company through
a private placement in addition to the recently announced larger private placement.
New Found Gold reported that Mr. Eric Sprott would become a new ‘Control Person’
of the company after a private placement, and that it had resumed its exploration
activities after fire risks had declined significantly (Figure 13).
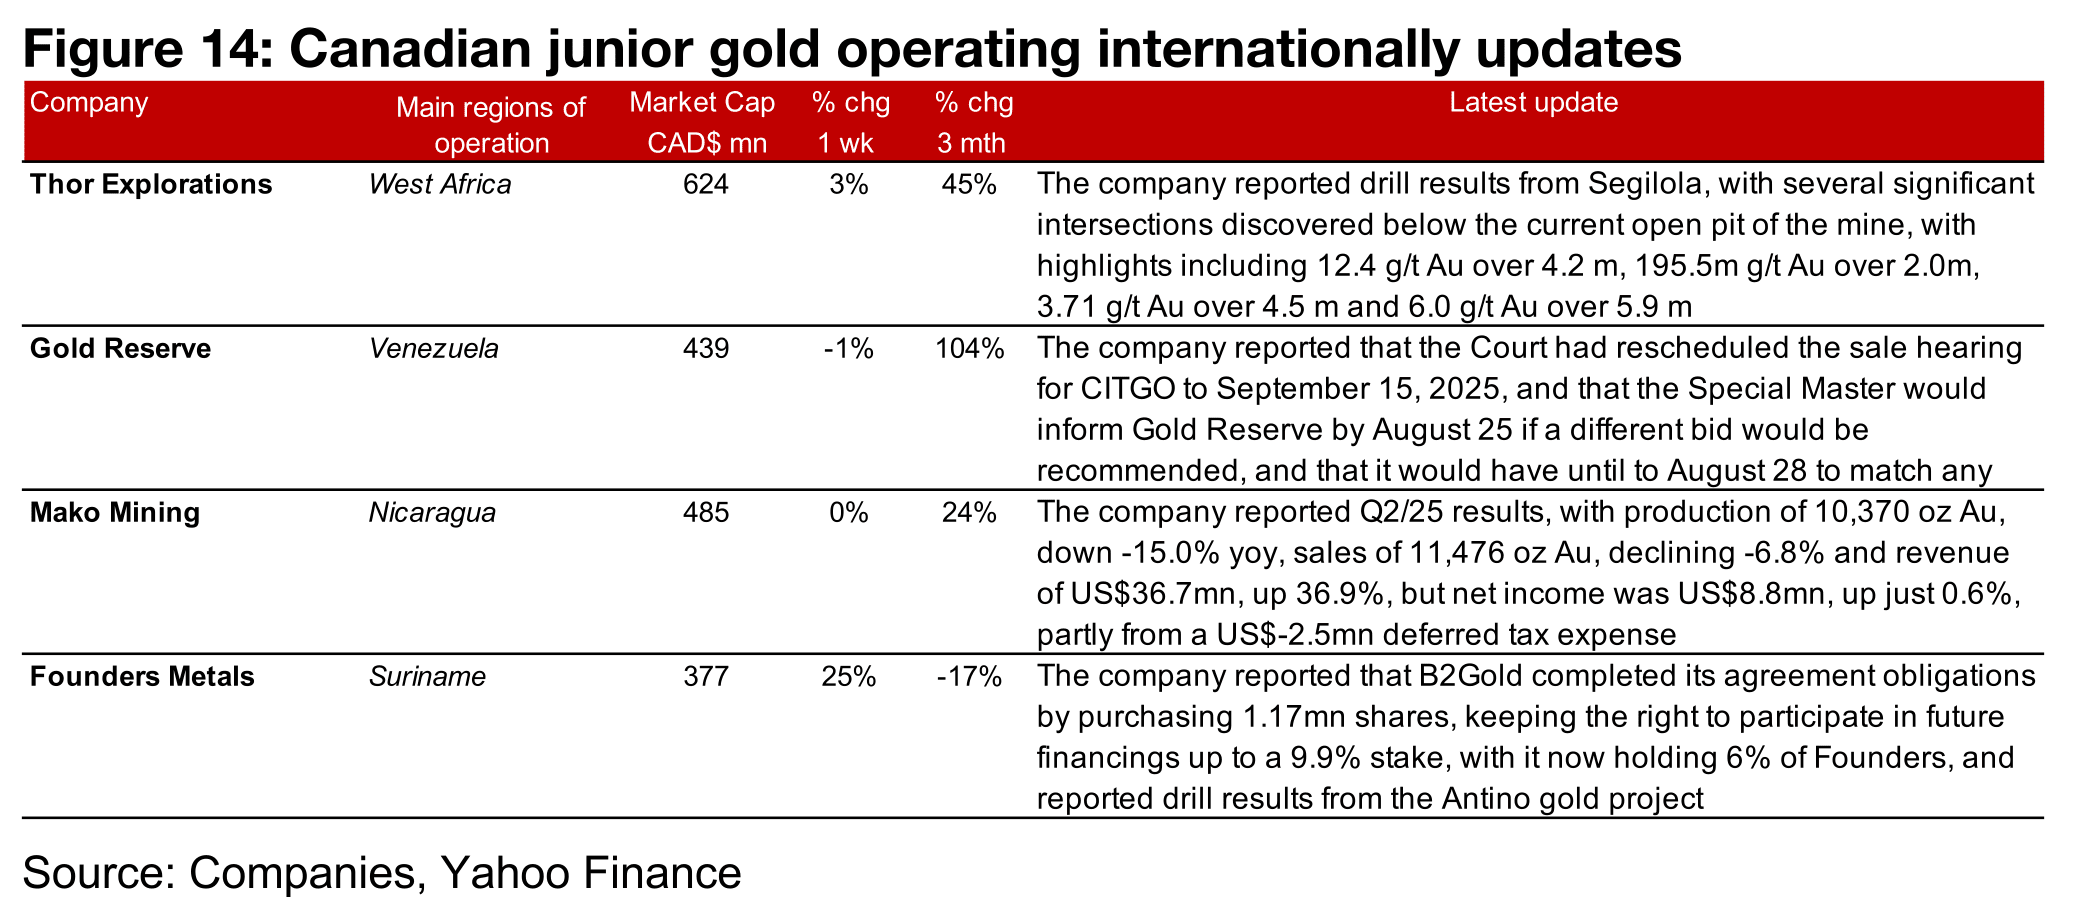
For the TSXV gold companies operating mainly internationally, Thor Explorations
reported drill results from Segilola and Gold Reserve announced that the CITGO sales
hearing has been postponed to September 15, 2025, the Special Master would inform
the company of any recommended new bid by August 25, 2025, and that it would
have until August 28, 2025, to match any bid (Figure 14). Mako Mining reported Q2/25
results and Founders reported that B2Gold had completed agreement obligations
keeping its rights to participate in future financings up to a 9.9% stake, with it holding
6.0% currently, and announced drill results from the Antino gold project.
Disclaimer: This report is for informational use only and should not be used an alternative to the financial and legal advice of a qualified professional in business planning and investment. We do not represent that forecasts in this report will lead to a specific outcome or result, and are not liable in the event of any business action taken in whole or in part as a result of the contents of this report
Author
Ben McGregor authors the Weekly Roundup at CanadianMiningReport.com, providing sharp analysis of the metals and mining sector. With a talent for spotting trends, Ben distills complex market shifts into clear, engaging insights on TSXV junior miners. His weekly updates cover gold, copper, uranium, and more, blending data-driven perspectives with a knack for identifying opportunities. A vital resource for investors, Ben’s work navigates the dynamic junior mining landscape with precision.