
April 17, 2023
Gold ticked down -0.5% to US$2,002/oz, but has held above US$2,000/oz for eight of the last nine trading days, as key economic data came in as expected, including a further decline in US inflation and US employment numbers that remained strong.
This week Osino Resources is in Focus, a relatively new entrant to the larger cap TSXV gold development group, operating the PFS-stage Twin Hills projects in Nambia's emerging gold belt, with a DFS targeted by the end of 2023.
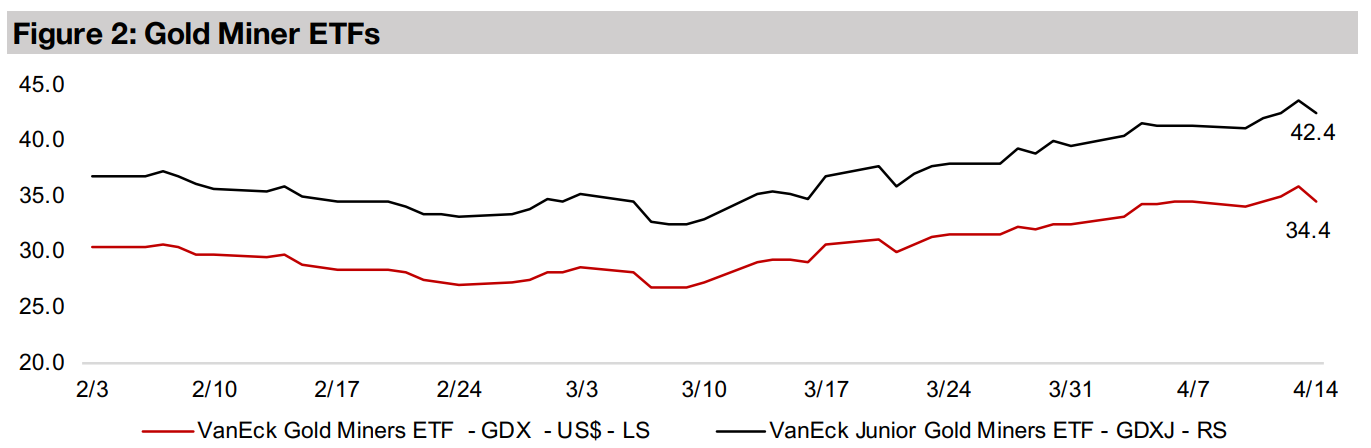
Gold stocks were mixed, with the producers near flat, with the GDX down -0.1% but the juniors gaining, with the GDXJ up 2.5%, while the larger TSXV gold juniors were mixed, as gold declined slightly and the equity markets made thin gains.


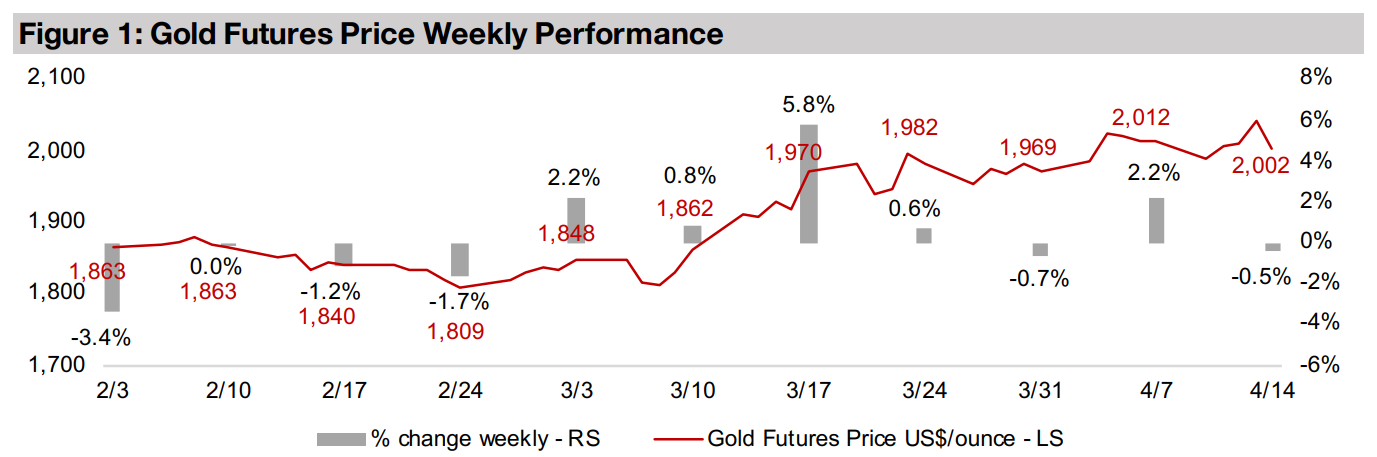
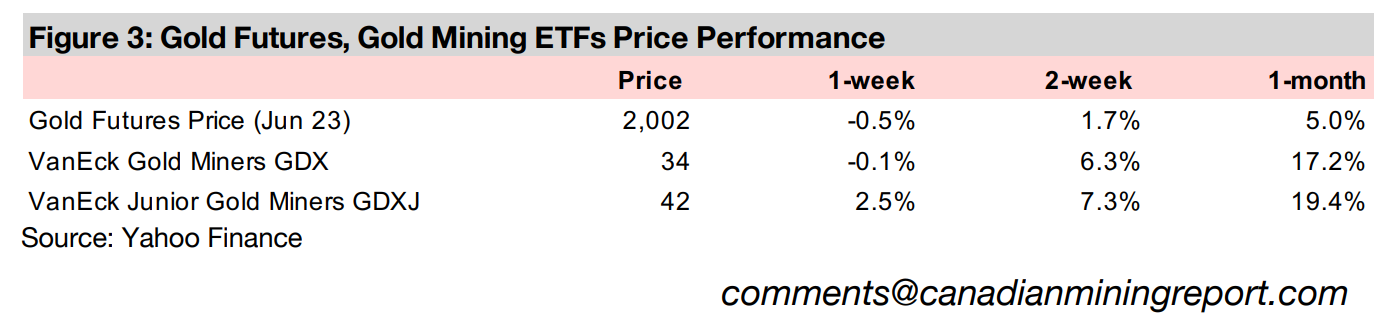
Gold edged down -0.5% this week to US$2,002/oz, and has held above the US$2,000/oz level for eight of the last nine trading days. The key economic data this week was regarding US inflation, which has continued to decline, but remains high, and US employment, which continues to run hot. Neither of the datasets appeared to have particularly surprised the market to the upside or downside, and equity markets saw slight gains, with the S&P 500 rising just 0.6%.
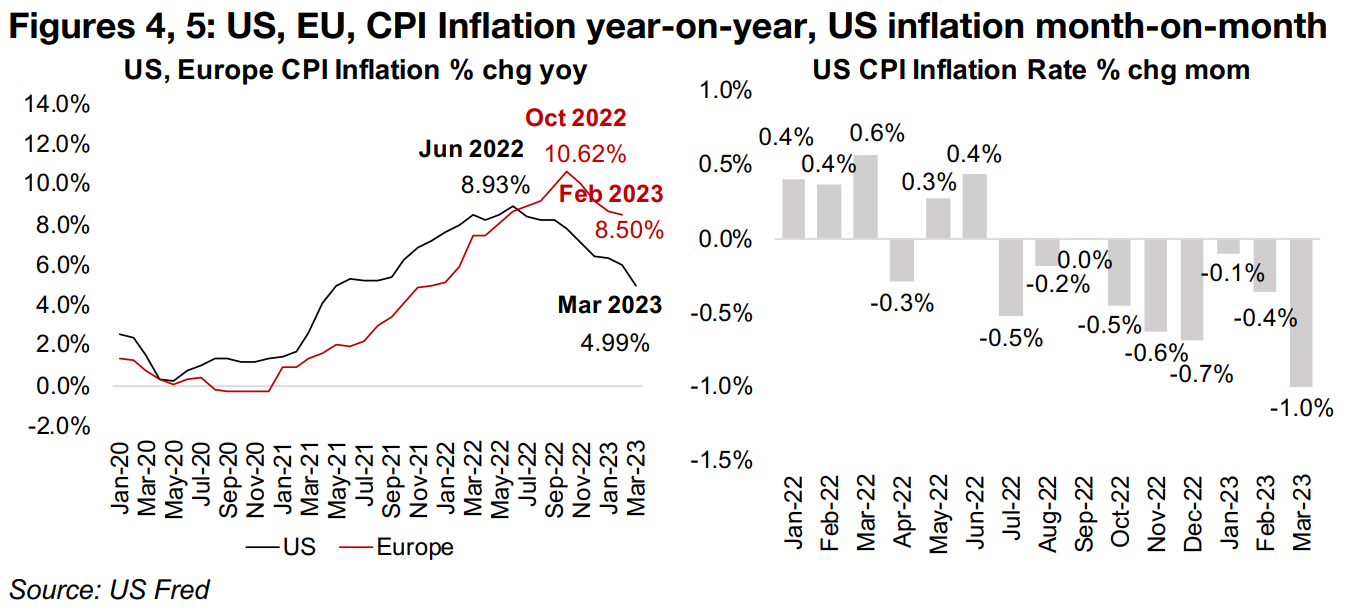
US CPI inflation, reaching 4.99% in March 2023 (Figure 4), saw a substantial -1.0% decline month on month from 5.99% in February 2023, its largest sequential drop since April 2020 (Figure 5). While US inflation has almost declined by half from its 8.93% June 2022 peak, it is still high in the context of the past thirty-years, when 5.0%-6.0% inflation has generally marked a peak, and certainly well ahead of the Fed's 2.0% inflation target. With the Fed's rate hikes successful so far in curbing inflation, rather than prompting them pull back anytime soon, it could instead embolden them to continue, and attempt to entirely crush high inflation expectations.
While the recent banking crisis has shown the downside of the Fed's rate hikes, these issues are still not showing up in the broader US employment data, which remains relatively strong. The employment situation is as critical to the Fed as inflation, as the second half of its mandate, after maintaining price stability, is supporting full employment. We expect that it will not be until inflation nears the Fed's 2.0% target, or unemployment spikes, that the central bank could justify large rate cuts. While a combination of these two would be very likely to drive the Fed to open the money spigots, and likely be a major driver for gold, this seems unlikely to occur in 2023.
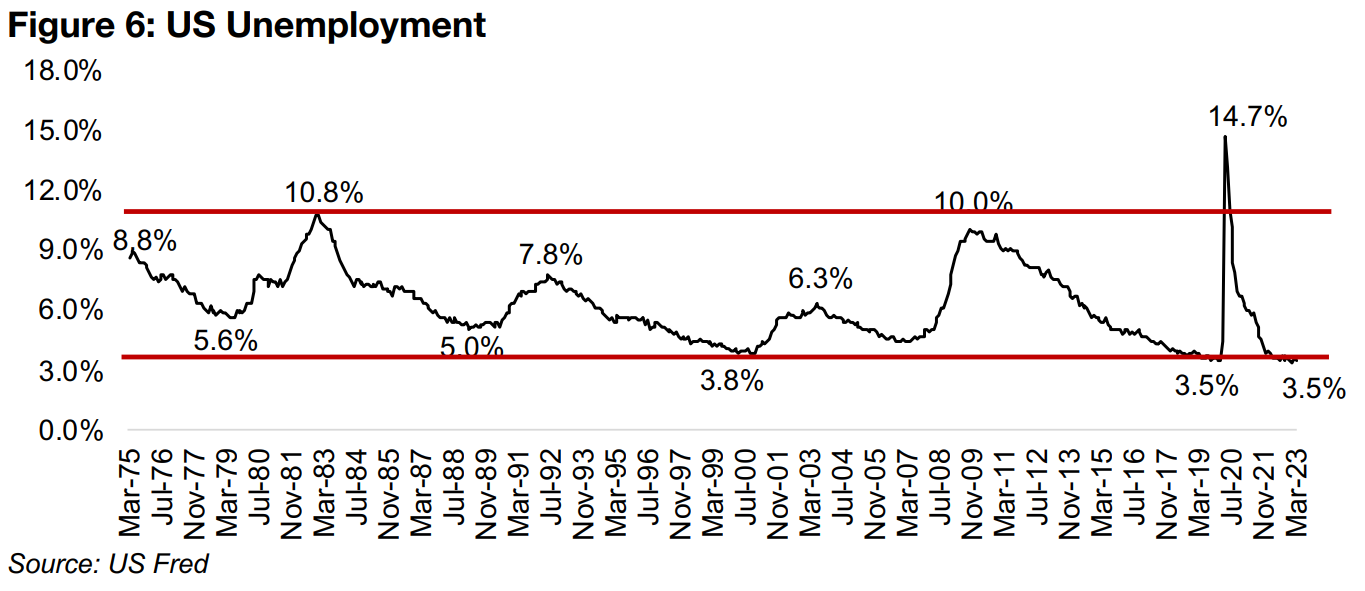
For now, US employment still continues to run relatively hot. The US unemployment
rate hit a trough of 3.5% in January and February 2020, its lowest level in at least
forty years and spiked in the crisis to a peak 14.7%, but was back down to 3.5% by
September 2020 (Figure 6). While it edged up briefly as high as 3.70% in October
2022, it reached new lows of 3.4% in January 2023, and was back again at 3.5% in
March 2023.
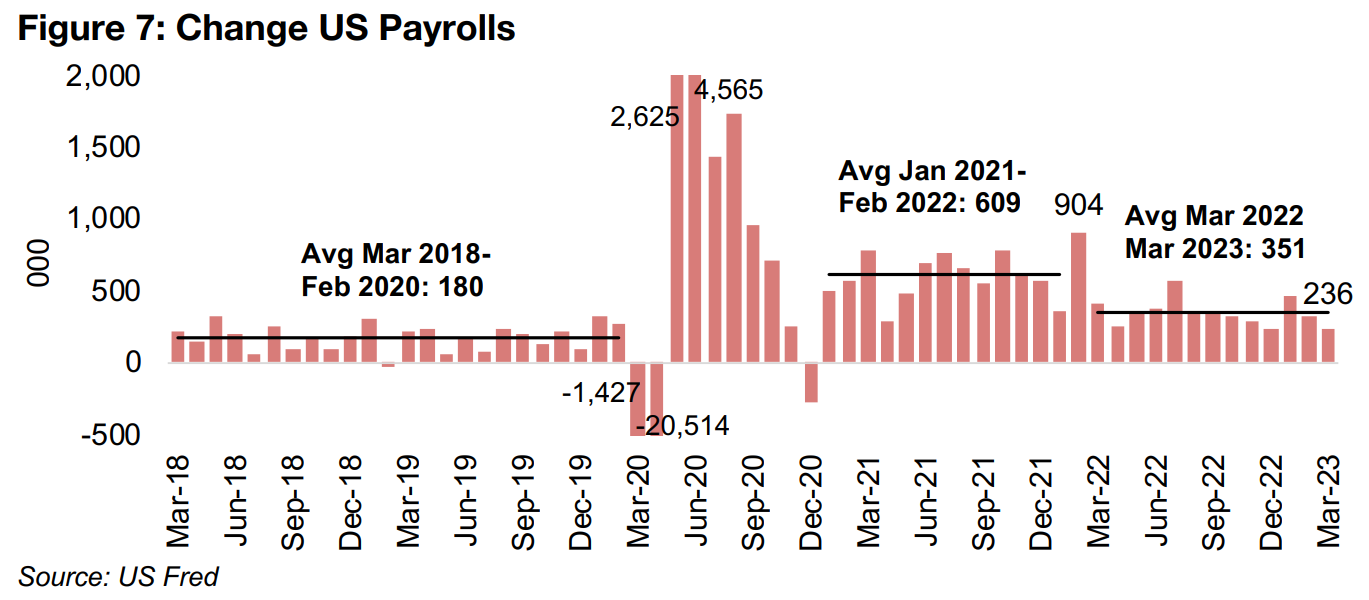
The change in March 2023 US payrolls hinted at some relative weakness in US
employment, with their lowest month on month gain in a year, at just 236k, well below
the average monthly gain from March 2022-March 2023 of 351k (Figure 7). This was
in turn far below the average monthly 609k increase from January 2021-February
2022 in the post-global-health-crisis boom. However, even the relatively low March
2023 gain was still substantially above the 180k average rise March 2018-February
2020, indicating that US employment is still stronger than prior to the crisis.
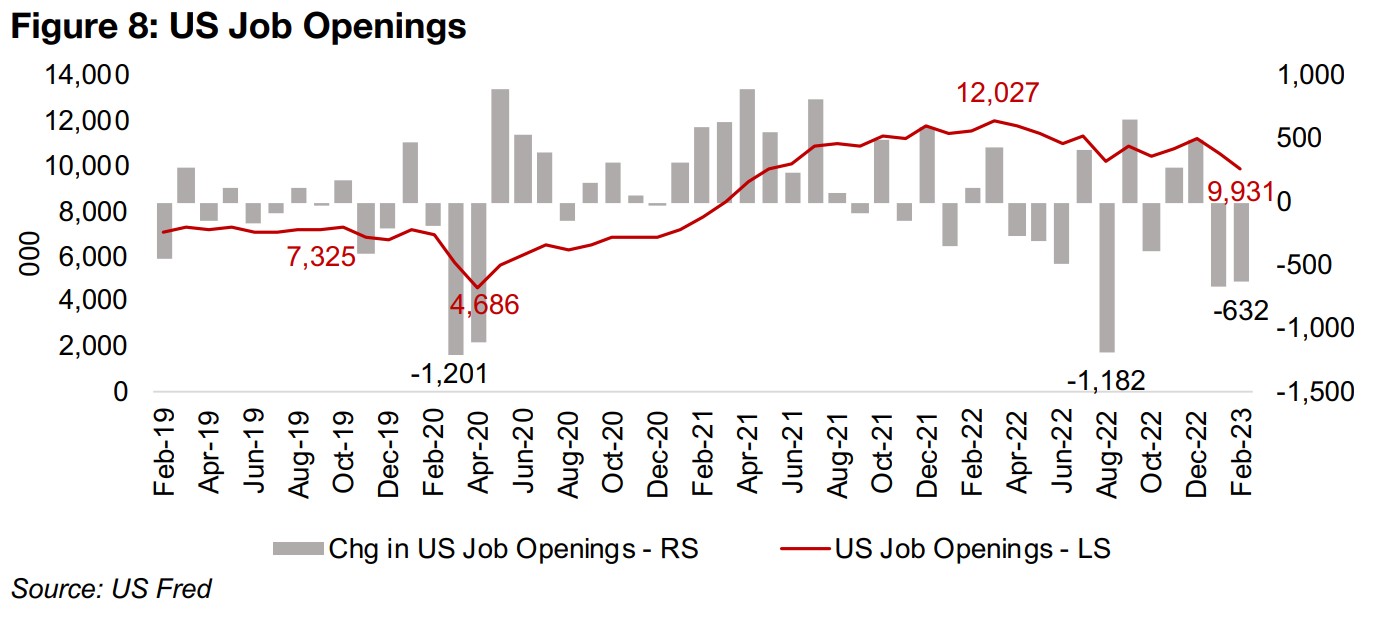
US Job Openings show a similar trend to the payrolls, indicating that employment has certainly declined off its post-crisis highs, but remains significantly stronger that prior to the crisis. While Job Openings declined considerably month on month, by 632k in February 2023, following a major drop in January 2023, the total number of Job Openings, at 9,931k, is still well above the 7,325k peak in October 2019, just prior to the start of the crisis (Figure 8).
Overall, similarly to inflation, US employment has simply not weakened enough quite yet to either pressure, or permit, the Federal Reserve to start aggressively bringing down rates. For the gold price, it is interesting how far it has gone without the support of a major monetary expansion recently, having gotten this high mainly as an overall economic and political risk hedge. If we were to add the resumption of blatant money printing, apart from the more 'stealth' easing of the recent measures to curb the banking crisis, it seems that gold could see a further substantial boost, even from current levels nearing all-time highs.
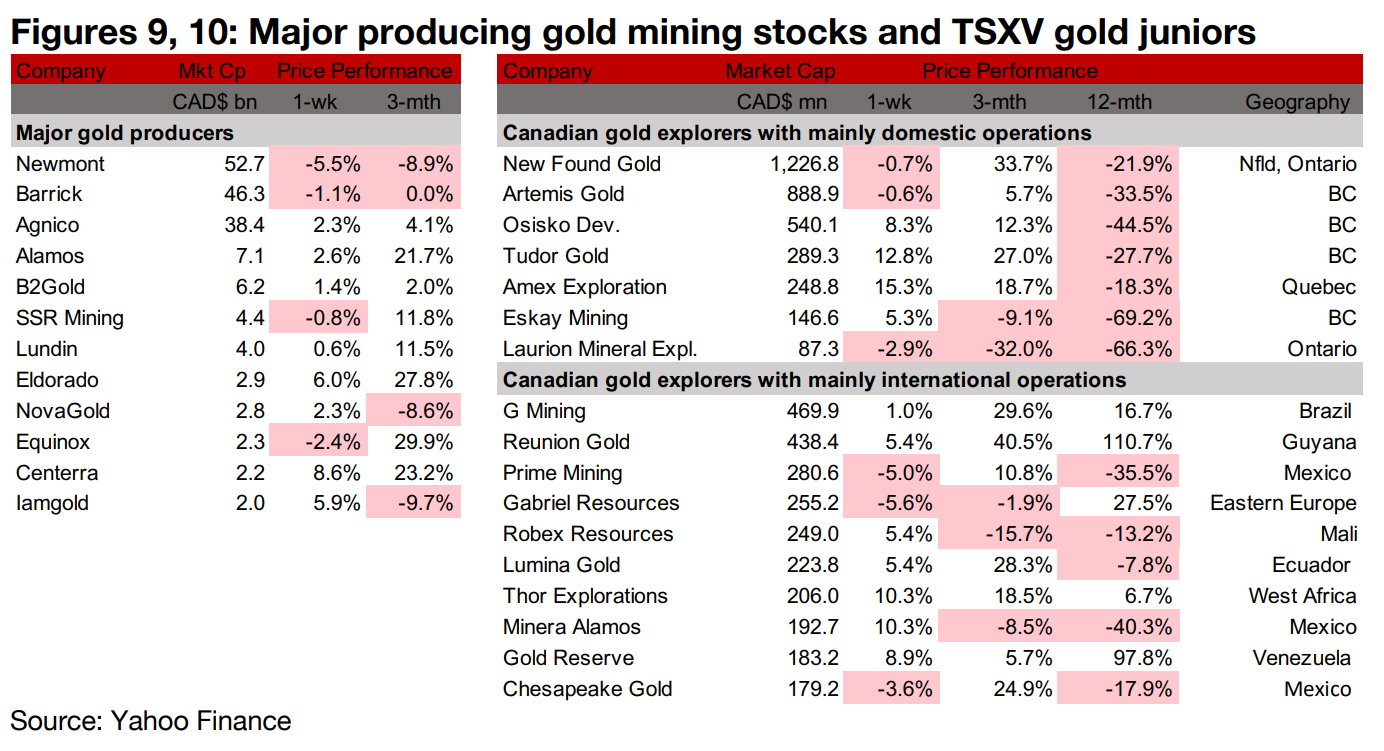
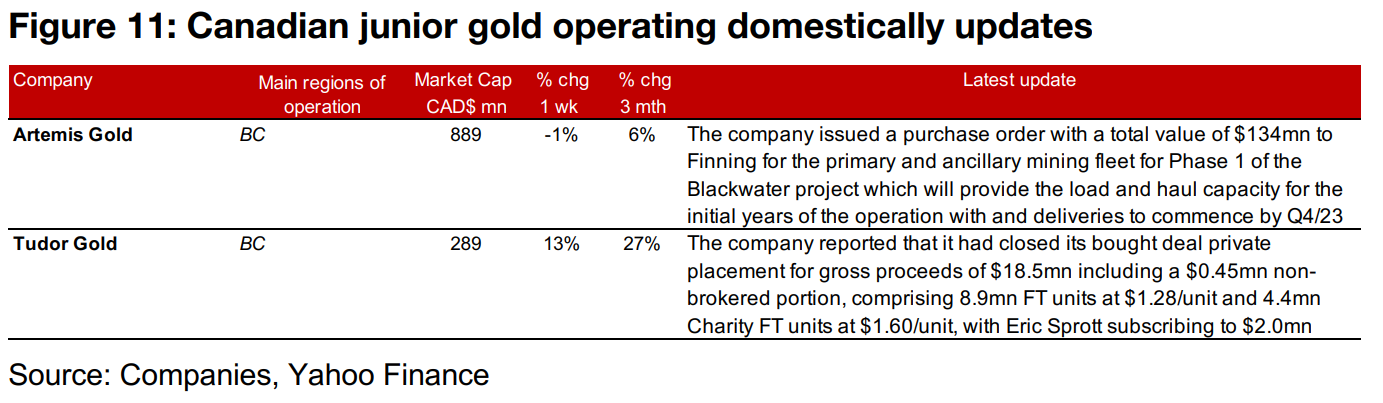
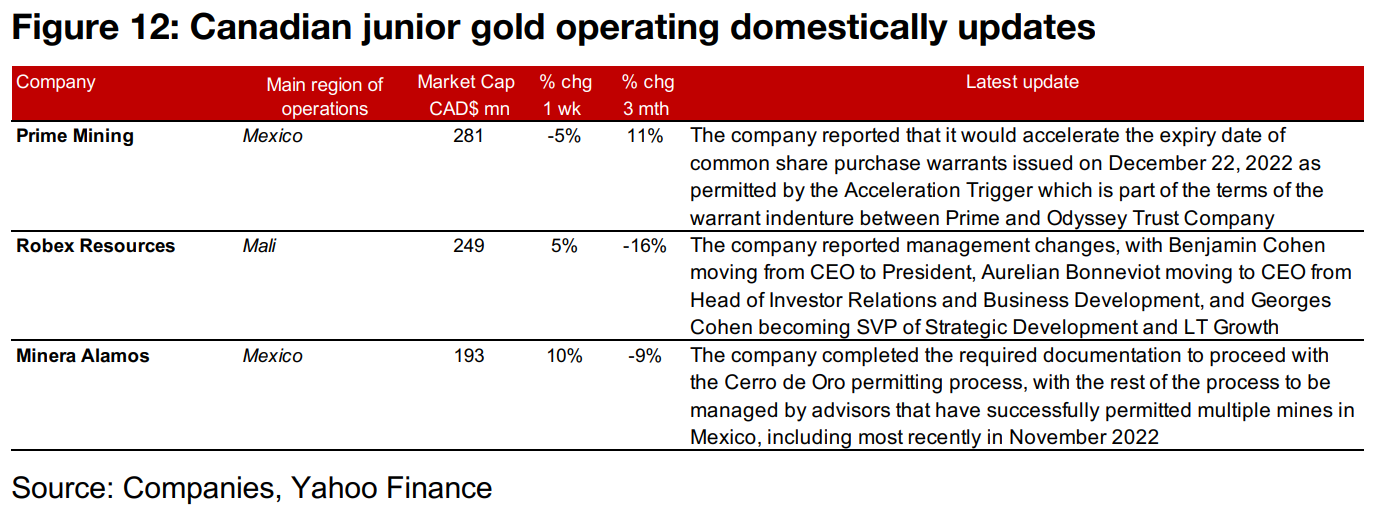
The gold producers and larger TSXV gold stocks were mixed as gold edged down but equity markets ticked up (Figures 9, 10). For the TSXV gold companies operating mainly domestically, Artemis Gold announced a $134mn purchase order with Finning for the primary and ancillary mining fleet for Blackwater and Tudor Gold announced the closing of its $18.5mn private placement (Figure 11). For the TSXV gold companies operating mainly internationally, Prime Mining accelerated the expiry of its warrants issued in December 2022, Robex Resources announced management changes, and Minera Alamos completed the required documentation to proceed with the Cerro de Oro permitting process, which will be managed by advisors that have recently successfully permitted mines in Mexico (Figure 12).
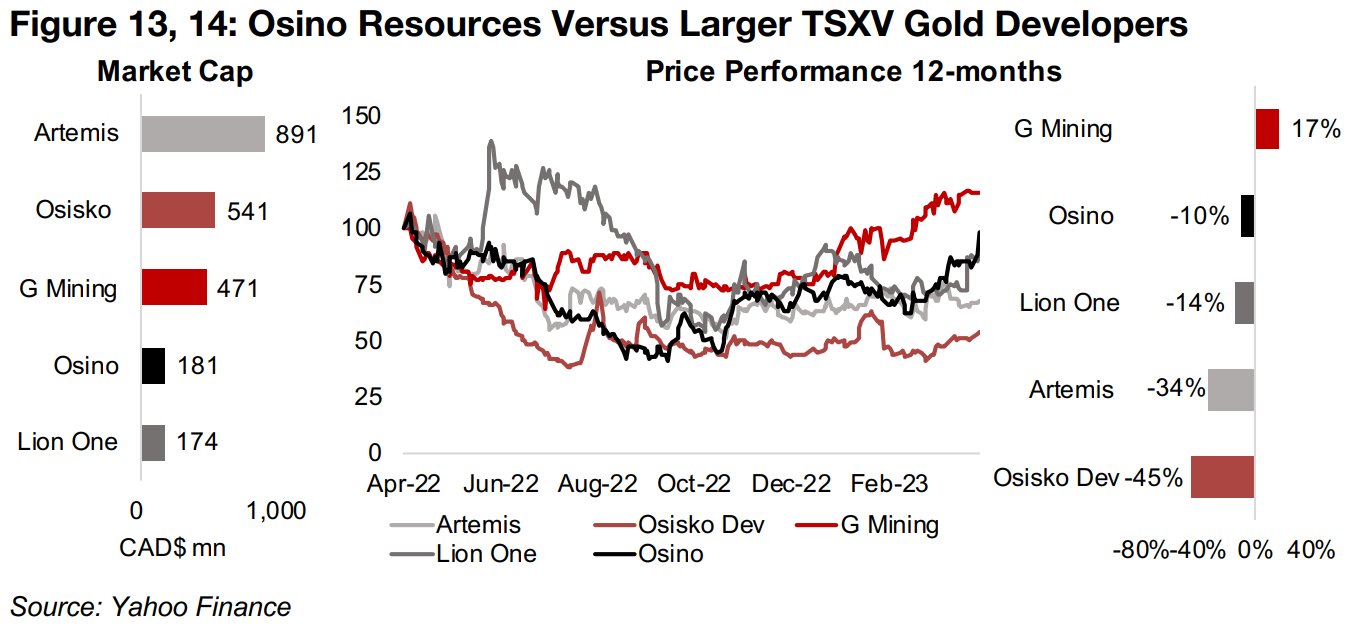
Osino Resources enters group of larger cap TSXV gold developers
Osino Resources' market cap had been below the larger TSXV gold developers we
regularly track for most of H2/22, but with the pickup in its share price over Q1/23,
and with some developers moving to the TSX, it has recently shifted into this group.
Its market cap has reached $181mn, putting it ahead of Lion One Metals, at $174mn,
but still less than half that of G Mining, at $471mn and Osisko Development, at
$541mn, and about fifth the size of Artemis Gold, at $891mn (Figure 13). While
Osino's share price is still down -10% over 12-months, this is still the second
strongest performance of the group, with only G Mining making gains (Figure 14).
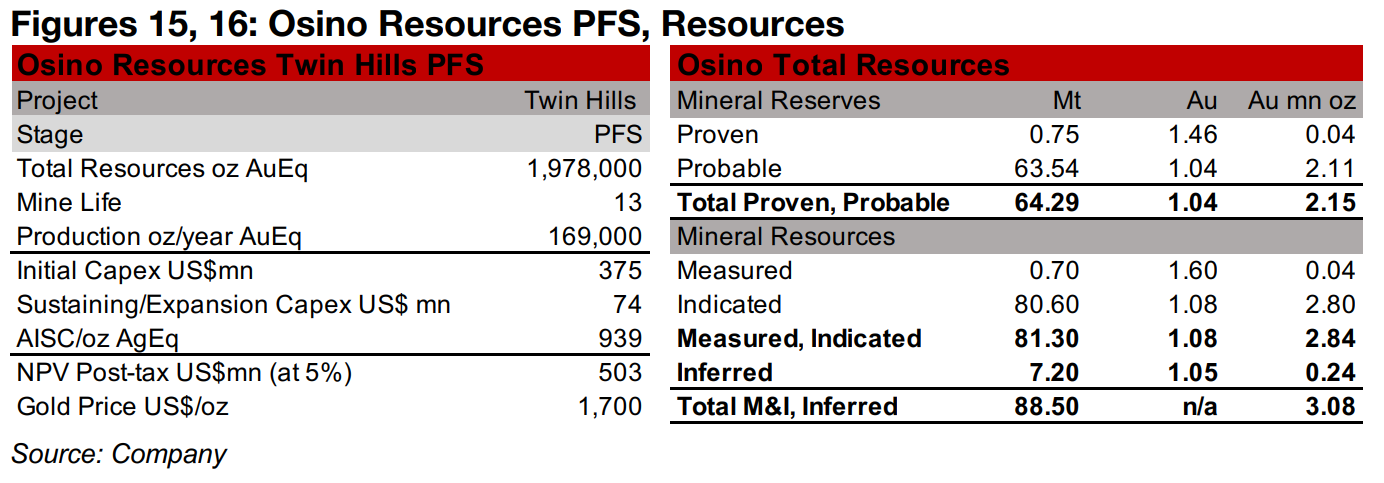
Osino is developing the Twin Hills project, with an 8,000 km land position in the
emerging gold belt in Namibia, Africa, a stable jurisdiction with a government that has
been supportive of the mining industry. The project has a Pre-Feasibility Study (PFS)
completed, and a Definitive Feasibility Study (DFS) is targeted by mid-2023, with
project financing expected to be secured of H2/23, early works on the mine to begin
by Q4/23 and first gold targeted by the end of 2025.
The PFS outlines a total production of 1.98mn oz AuEq with 169k oz AuEq on average
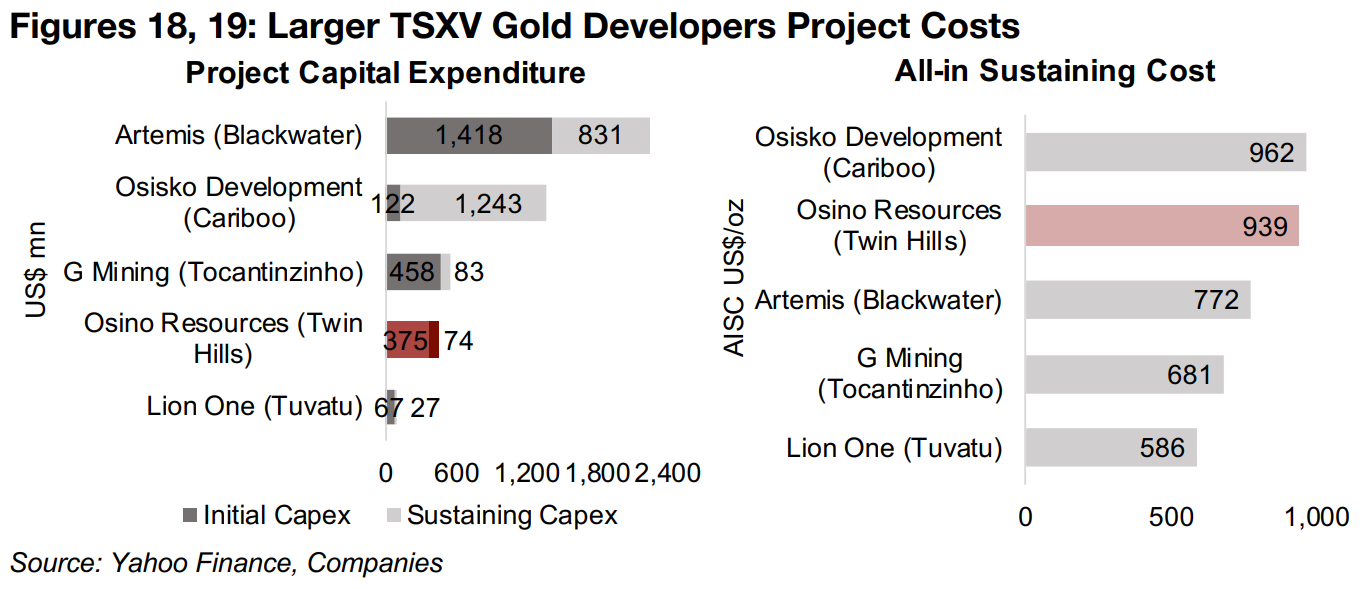
over 13 years. Initial capex is estimated at $375mn and sustaining capex at $74mn,
and the AISC is $939/oz AuEq, for a post-tax NPV of $503mn using a $1,700/oz gold
price (Figure 15). The company's total Proven and Probable Reserves are 2.15mn oz
AuEq, and its Measured, Indicated and Inferred Resources are 3.08 mn (Figure 16).
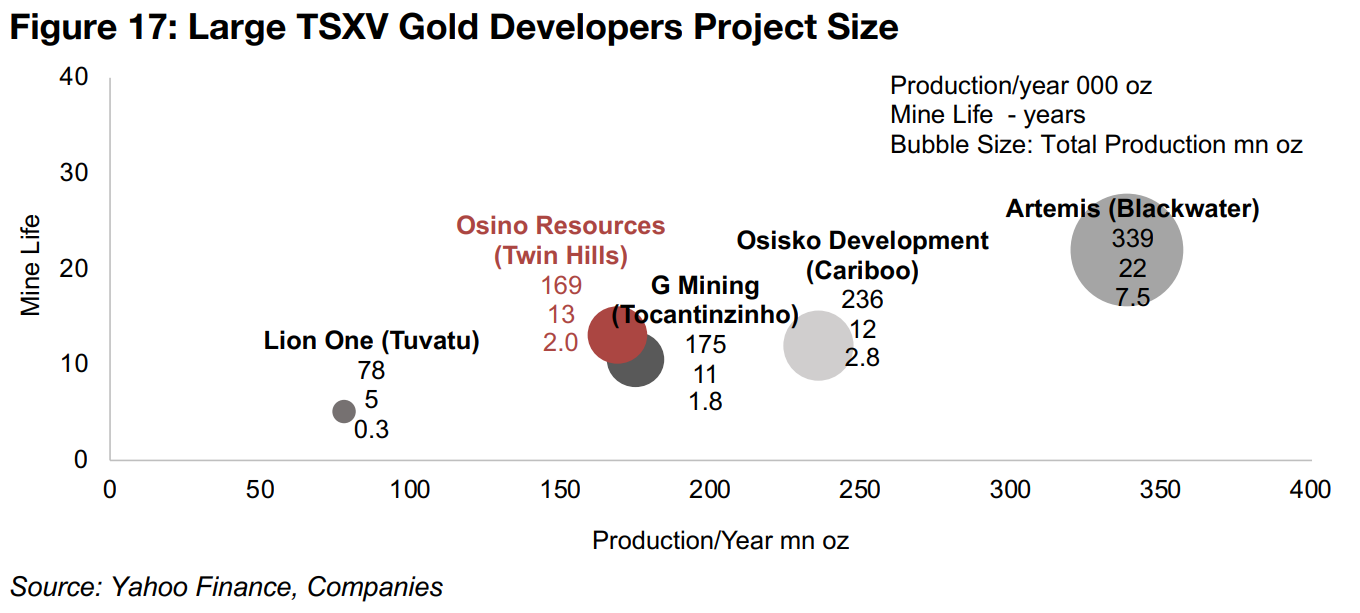
G Mining's Tocantinzinho project is the most similar in size to Twin Hills of the larger
TSXV gold developers, with total resources of 1.8 mn oz AuEq and annual production
of 175k oz AuEq over 11 years (Figure 17).
Twin Hill's initial and sustaining capex of US$375mn and U$74mn, respectively, are
again similar in size to Tocantinzinho, at US$458mn and US$83mn (Figure 18).
However, Twin Hill's all-in-sustaining-cost (AISC) of $939/oz AuEq is high versus the
group, with only Osisko Development's Cariboo project higher, at US$962/oz AuEq,
and the next highest, Artemis's Blackwater, US$167/oz below Twin Hills (Figure 19).
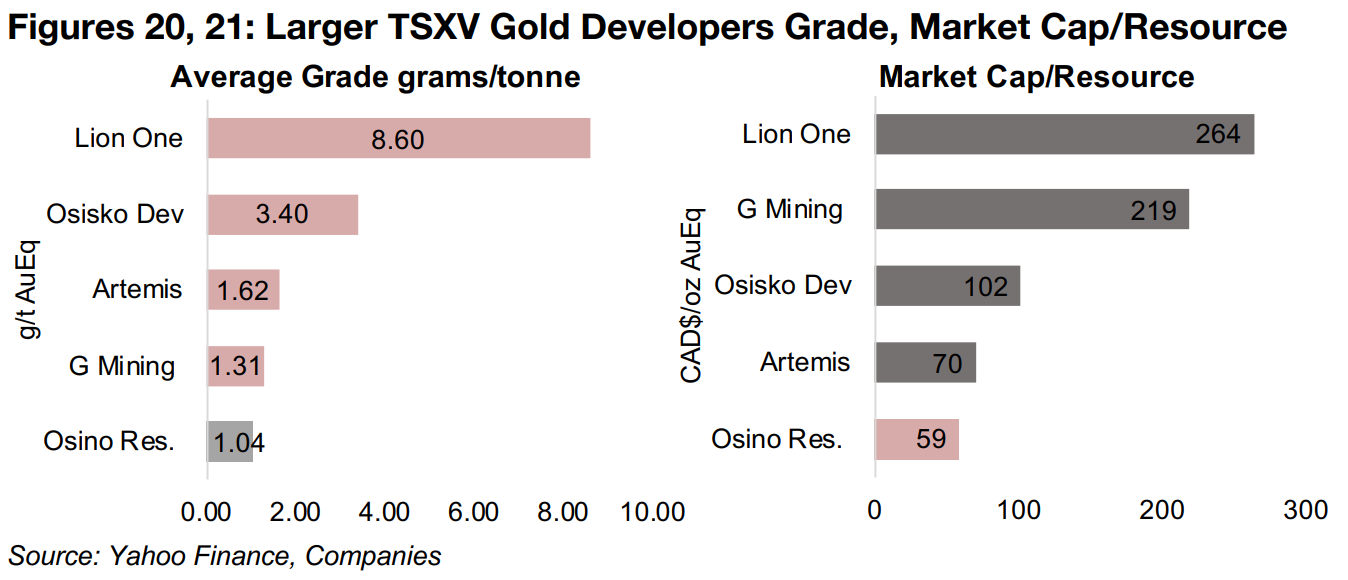
Twin Hills has the lowest grade of the group, at an average of 1.04 g/t AuEq, versus
G Mining's comparable Tocantinzinho project, at 1.31 g/t AuEq (Figure 20). This lower
grade is reflected in Osino's relatively low valuation in terms of Market Cap/Resource,
at just $59/oz AuEq, the lowest of the group, and below the Tocantinzinho project,
which is ahead of Twin Hills terms of development timeline, by $11/oz (Figure 21).
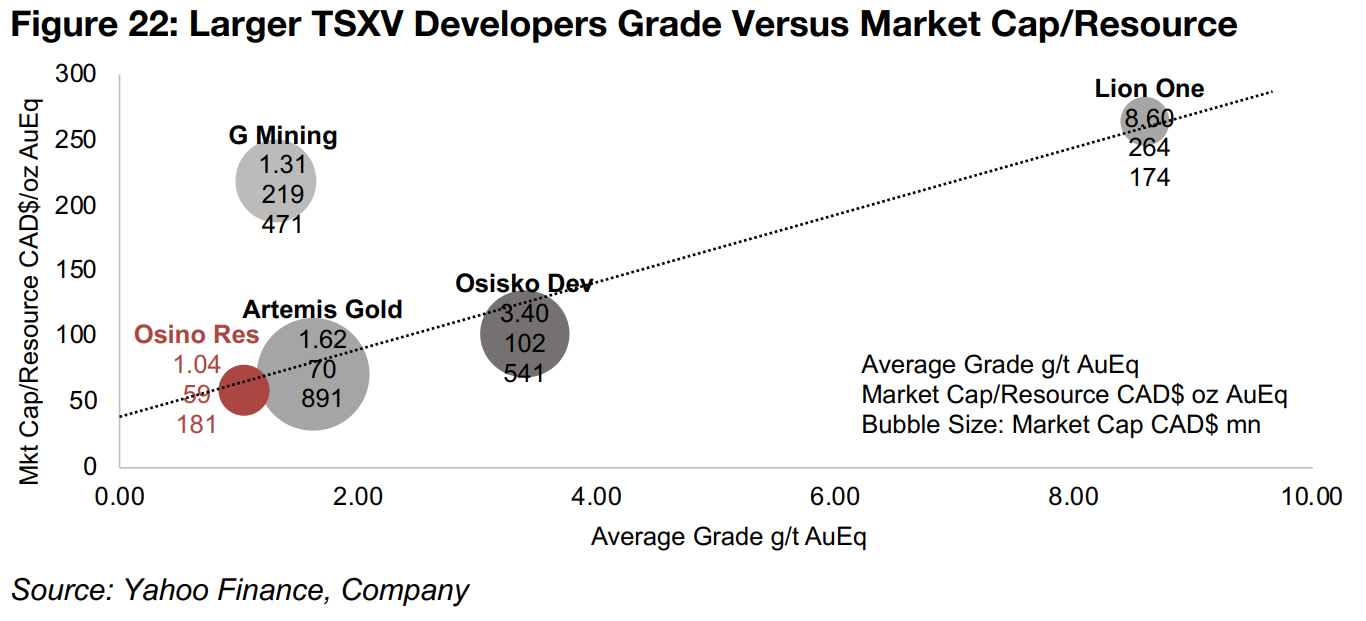
Comparing average grade to Market Cap/resource, most of the valuations for the
group land near a straight line with Market Cap/Resource rising as grade increases,
apart from the outlier G Mining, trading significantly above the line (Figure 22).
Disclaimer: This report is for informational use only and should not be used an alternative to the financial and legal advice of a qualified professional in business planning and investment. We do not represent that forecasts in this report will lead to a specific outcome or result, and are not liable in the event of any business action taken in whole or in part as a result of the contents of this report.
Author
Ben McGregor authors the Weekly Roundup at CanadianMiningReport.com, providing sharp analysis of the metals and mining sector. With a talent for spotting trends, Ben distills complex market shifts into clear, engaging insights on TSXV junior miners. His weekly updates cover gold, copper, uranium, and more, blending data-driven perspectives with a knack for identifying opportunities. A vital resource for investors, Ben’s work navigates the dynamic junior mining landscape with precision.